1. INTRODUCTION
From the 17th century, Joseon began to import and employ Western science practices from China (Yu 1983;Lee 1985;Hahn 2004). The Shixian Calendar was introduced and established in Joseon in 1654 and this marked the beginning of the practice of Western science in the field of Joseon’s royal politics (Yu 1982;Lee et al. 2010). The continuous influx of Western science also had an influence on the astronomical observation instruments utilized in the late Joseon Dynasty. A representative example is the manufacture of a Western-style horizontal sundial (新法地平日晷) (Hahn 2004).
The sundials of the Joseon Dynasty could measure the time and 24 solar terms together. The various sundials developed in the reign of King Sejong were mostly equatorial sundials (Lee & Kim 2011;Kim et al. 2012;Lee et al. 2016). However, Angbuilgu, a scaphe sundial was installed within Hanyang, the capital of this kingdom (Seoul), and thus was a sundial that could be used by the public as well as the palace dwellers. This scaphe was the modification of Yangyi (仰儀), which is a large-scale observation instrument of the Yuan (元) Dynasty. Interestingly, hour-lines and solar-term-lines are drawn on this hemispherical sundial. Thanks to Angbuilgu, it was recognized that a sundial indicates the time of a day and the date (or season) of a year in Joseon. This perception seems to have motivated Crown Prince Sohyeon (1612~1645) to introduce sundials to his country when he received a Western-style horizontal sundial as a gift from Adam Schall von Bell around 1644 (Lee 1985).
The hour-lines and solar-term-lines of Western-style hori zontal sundials featured a new format which had never been used in the early Joseon Dynasty. It seems that a Western-style horizontal sundial imported by Crown Prince Sohyeon could not be immediately reconstructed into another version in accordance with Hanyang. According to the record of Gukjoryeoksang-go (國朝曆象考, Reference for Astronomy and its Calendar of Our Country), Kim Young (1749~1817) made a horizontal sundial in 1789. Also, it explains the hour-lines and solar-term-lines of this sundial in detail (Lee & Moon 2004). Besides Chen & Hua (2011) has described a vertical gnomon related to a drawing of a horizontal sundial with an old Chinese method which is similar to a drawing method of the record of Gukjo-ryeoksang-go.
In Korea, some extant Western-style horizontal sundials have been designated as treasures. A black stone horizontal sundial and a white marble horizontal sundial were once displayed in the King Sejong Great Memorial Hall (Lee 1984). They have been designated as Treasure No. 840 (hereafter ‘T840’) and Treasure No. 839 (hereafter ‘T839’) respectively, and are currently housed in the national palace museum of Korea (NPM). The former has an inscription that records the latitude (the altitude of the north celestial pole) of Hanyang, and the latter has an inscription that is thought to relate details about the manufacturing date and the sundial maker. For these stone horizontal sundials, the gnomon is lost, and thus its shape is not known. In addition, an artifact made of copper is owned by the Seoul national university museum (SNUM) (Song et al. 1994). This artifact could be related to the metallic horizontal sundial that was manufactured by Kim Young as mentioned in Gukjo-ryeoksang-go.
Lee (1984) investigated the external characteristics of the two stone horizontal sundials. Lee (1985) also discussed the permanent residence of the white marble horizontal sundial (T839), and calculated the latitude of this sundial with the rubber of this horizontal sundial. We received the 3D scan data of T840 from the cultural heritage administration of Korea (CHA). In the present study, the latitude of the black stone horizontal sundial (T840) and the length of the stylus were analyzed using the 3D scan data with a point density of 1 mm. In Chapter 2, the 3D scan data and the analytic method are discussed. In Chapters 3 and 4, the latitude and stylus of the T840 horizontal sundial are analyzed and compared based on the inscription engraved on the original artifact.
2.DATA REDUCTION AND CALCULATION
To obtain detailed information on the lines and features of the horizontal sundial, a three-dimensional scanner was used with the optical triangulation method. The optical triangulation method can be classified into a fringe projection type and an optical triangulation laser type. The former obtains the information through illuminating a light source onto the object, and the latter acquires the information on an object by shooting a laser (Choi & Ko 2017).
In the case of the T840 horizontal sundial, 3D scan measures were conducted in 2015 using the ATOS Compact Scan 5M (GOM, Germany). This is based on the fringe projection-type phase shift pattern method. The data precision of the 3D scanner was 0.001 mm ~ 0.02 mm, and the resolution of the camera was 2,448 × 2,050 pixels. The projection method was the phase shift pattern method, and the light source was blue light-emitting diode (LED). Based on the aforementioned settings, highresolution 3D data could be obtained. The fringe projection-type 3D scanner (Fig. 1(a)) consisted of a light source, an illuminant lens, and a charge coupled device (CCD) (Lee et al. 2012).
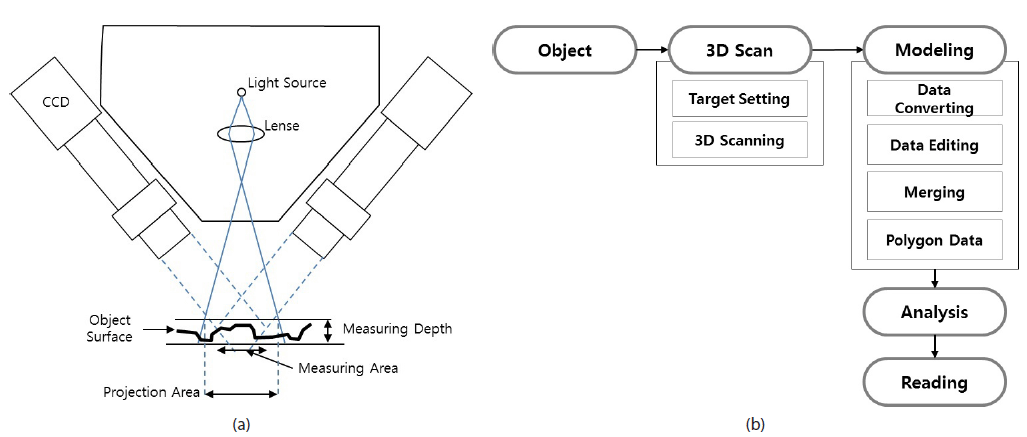
In the fringe projection measurement, a dispersive light through the lens illuminates an object, and the CCD camera detects the illuminated light reflected from the object. At the same time, the depth pattern of an object surface is analyzed from the detected light, and the three-dimensional shape of the object surface is digitized. Fig. 1(b) shows the 3D scanning and analysis process for the horizontal sundial used in the present study. The work process consists of the 3D scanning stage and modeling stage for the horizontal sundial. In the scanning stage, the measurement area of the object is determined at first and then scanned at the optimum distance of the scanner for that area (Choi & Ko 2017). The raw scan data is converted into an editable data format. The data is optimized to 3D points through a noise removing process and a hole filling process. The 3D point data of each detection area is optimized and merged to finally become polygon data (Choi & Ko 2017). Through these modeling stages the polygon data contains the depth information of the sundial’s surface where the hour-lines and solar-term curves are engraved. For the colors according to the depth ranges, the deeper the part is, the darker it gets, and the shallower the part is, the brighter it gets. When the polygon image is assigned black intensity depending on the depth, it becomes a complanation image such as the one shown in Fig. 2.
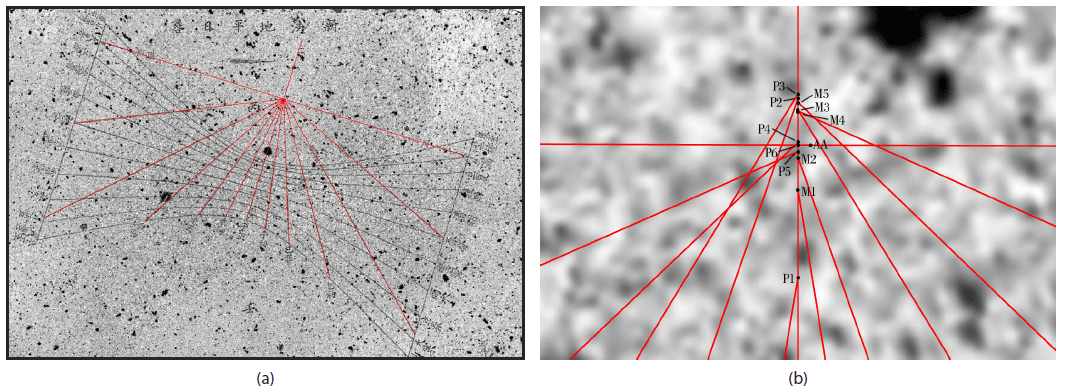
Fig. 2 shows the complanation image of T840 (hereafter ‘T840-plate’). As in the original form of the T840-plate, the center line of all hour-lines (i.e., 12h-line) are rotated by about 17.242° in the clockwise direction relative to the vertical line of the black stone. This sundial has a total of 13 hour-lines (every hour from 6:00 to 18:00), and a total of 11 solar-term-lines that represent the 24 solar terms. However, there are not 13 solar-term-lines. A curve for Bearded grain (芒種) and Great heat (大暑) are used as the summer solstice line together, and in the same manner a curve for Heavy snow (大雪) and Slight cold (小寒) are used as the winter solstice line. In addition, there is a horn-shaped groove with a length of 43.1 mm below the inscription that reads ‘新法 地平日晷’ indicating a Western-style horizontal sundial. An inscription that states that the latitude of this sundial is 37° 39´ is engraved on the southern lateral face of this horizontal sundial (i.e., the upper side of Fig. 2).
The coordinate system of the horizontal sundial can be conveniently specified as shown in Fig. 2. The origin of this coordinate system is identical to the convergent point obtained by extending the hour-lines of a horizontal sundial (Lee 1982). It is generally set up so that the west in the horizontal plane is determined as the X-axis, and the south as the Y-axis. Fig. 3 shows the diagram for the gnomon’s projection for a horizontal sundial. Point A is the position of the gnomon, and point C is the position where the shadow of the gnomon’s tip is cast, that lies on a line of the vernal and autumnal equinoxes. The direction from the origin toward the gnomon’s tip is the North celestial pole, and thus the angle between OB and a horizon is identical to the latitude of its sundial. When the length of the gnomon is H and the declination of the sun is δ, D is a shadow position of the gnomon’s tip on the 12h-line and AD is N.
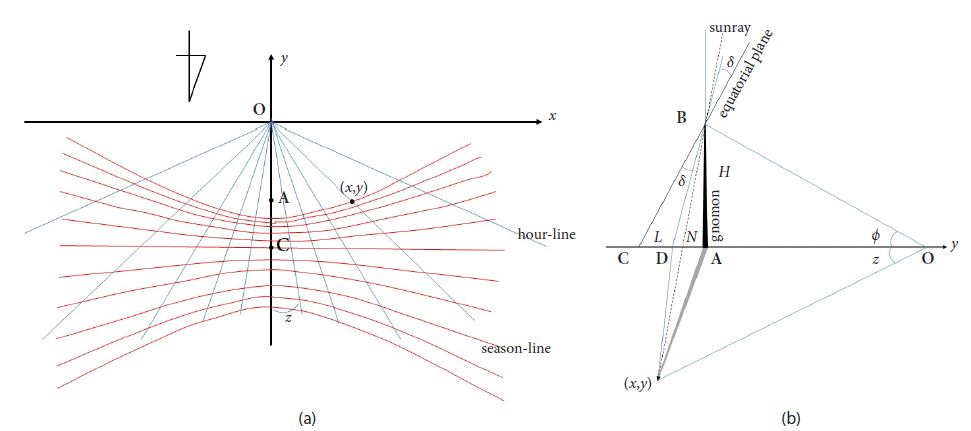
Fig. 4 shows the convergent point of each hour-line in the T840-plate. When the convergent point was magnified, it is not only one point, but is a lot of intersection points. Owing to an eccentric error of hour lines, the intersection points between the noon line (12h-line) and the other hour-lines are dispersed from a virtual convergent point. In Fig. 4(b), each intersection point was expressed as symbols (P1, P2, P3, …, M1, M2, M3…, P6 = M6). The center point of the east-west line (AA) is also one of the intersection points. If these intersection points are eligible to be a convergent point, then they are assumed as the origins of the sundial coordinate system. These origins have characteristics similar to the convergent point’s samples which can be analyzed statistically. In other words, when each intersection point lies as the origin of the sundial coordinate, the latitude of the sundial and the length of the gnomon can be inversely estimated from the hour-lines and solar-term-lines at each origin.
The inscription of T840 specifies the latitude of Hanyang (Seoul) installed in this sundial. For each origin shown in Fig. 4(b), the latitude of the sundial can be estimated based on the angle between the 12h-line and the hour-line (z) shown in Fig. 4(a) (Lee 1982;Rohr 1996).
where ϕ is the calculated latitude of the sundial, HA is the hour angle, and z is the angle between the 12h-line and the hour-line. The dummy index i represents the 12 origins, and j represents the 12 hour angles. In Eq. (1), the mean latitude of the sundial for each origin can be calculated as .
On the other hand, the intersection point between the 12h-line and a solar-term-line (0, y) corresponds to a point Dj (j = 1, 2, 3, …) in Fig. 3(b). The latitude of the sundial can also be calculated from two solar-term-lines with the same declination of the sun (Lee 1985).
where yik is the y value of each solar-term point on the 12h-line measured from T840-plate. The dummy index i represents the 12 origins, and j represents the 6 solar-term-lines (declination of the sun).
Based on the mean latitude of the sundial obtained by Eq. (1) and the intersection points (x, y) of each solar-termline and the hour-line, the length of the gnomon (H) can be calculated as follows.
where the dummy index i represents the 12 origins, j represents the 12 hour angles, and k represents the 6 solar-term-lines. In Eq. (3), the mean gnomon length for each solar-term-line or the mean gnomon length for each hour-line can be calculated for each origin. Also, the mean gnomon length for all origins is .
With the yik in Eq. (2) and the values in Eq. (3), the distance from each Dk on the 12h-line to the gnomon (A), can be calculated as follows.
The mean distance from each solar-term point on the 12h-line to the gnomon can be calculated as . In Fig. 3(b), .
3.RESULTS
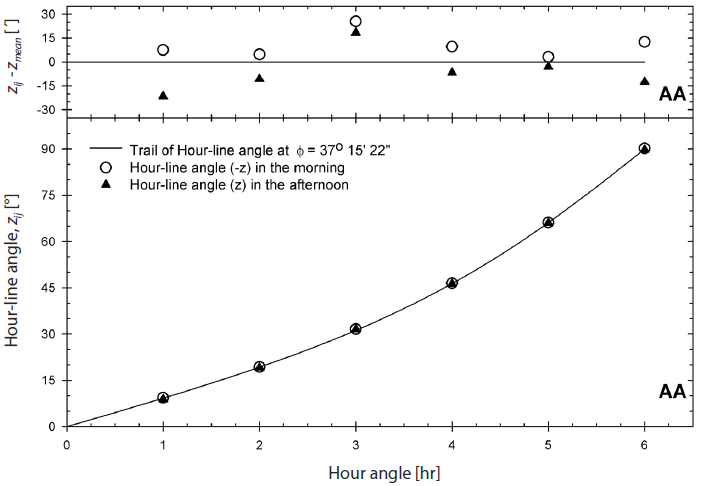
The ϕij calculated by Eq. (1) is analyzed statistically for a given origin. As shown in Fig. 5, the ϕij for the origin AA could be indirectly compared with the actual trajectory of the mean latitude (ϕAA). The abscissa is the hour angle, and the ordinate is z. For each of the given origins of i, the ϕij calculated for each hour angle was different from the mean latitude (ϕi), and they were consistent within a maximum of 42´. In this regard, the difference between zmean and zij was several 10´, where zmean is an hour-line’s angle calculated by mean latitude ϕij for a j’s hour-line and the zij is j’s hour-line’s angle measured from T840-plate. Regarding the origin of other i-s , the results were also similar to that shown in Fig. 5.
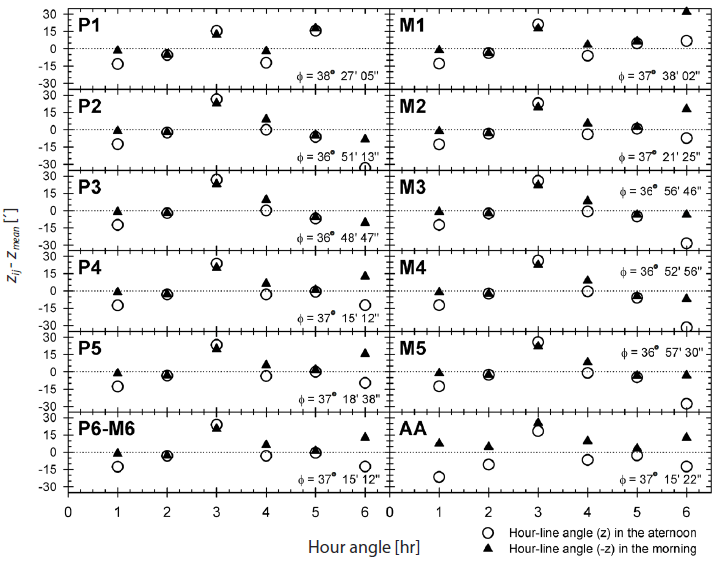
For every origin of Fig. 4(b), the mean latitude and zij-zmean of a j’s hour angle is shown in Fig. 6. The mean of each origin’s mean latitude is 37° 15´ ± 26´, and this value embraces the latitude of T840 (37° 39´). However, this mean for all origins showed a difference of about 24´ compared to the actual value of the inscription.
The length of the gnomon for each origin can be estimated by Eq. (3). This value is calculated using two variables: hour angle and the declination of the sun. Accordingly, for the statistical results, the length of the gnomon (H) can also be analyzed for each hour-line and for each solar-term-line, respectively. Let Hi be the mean gnomon length of i’s origin. Let Hij be the mean gnomon length of i’s origin and j’s hourline. Let Hik also be the mean gnomon length of i’s origin and k’s solar-term-line. When the difference between Hi and Hij was defined as Δ Hij (= Hij- Hi), the Δ Hij is presented in Fig. 7. When the difference between Hi and Hik is defined as Δ Hik (= Hik- Hi), the Δ Hik is presented in Fig. 8. The abscissa is the hour angle, and the ordinate is the Δ Hij in Fig. 7. The abscissa is the solar-term-line, and the ordinate is the Hik in Fig. 8. The acronym of 24 solar terms is derived from the designation of them by Kim et al. (2017).
In Figs. 7 and 8, the Δ Hij and Δ Hk showed slightly different distribution patterns relative to the Hi. In general, Hij is more distributed than Hk relative to Hi. On the other hand, the standard deviation of each Hij was smaller than that of each Hk. For example, in the case of Point AA, the mean of Δ Hij was 0.3 mm, and that of Δ Hk was 0.2 mm. On the other hand, the mean of the standard deviations of Hij was 0.4 mm, and that of Hk was 0.6 mm. The mean of the gnomon lengths by Eq. (3) for i’s origin ( Hi) was 43.70 ± 0.66 mm. On T840-plate (Fig. 2), the horn-shaped groove (or pin mark) below the title’s inscription reads 43.1 mm long. Although there is an error up to approximately 1 mm, the horn-shaped groove represents the length of the gnomon. It is possible that the gnomon of T840 sundial used a vertical stylus as shown in Fig. 3(b), rather than a triangular gnomon whose side is inclined from the horizontal plane by as much as the latitude of sundial (Lee 1985).
T840-plate only has hour-lines and solar-term-lines without a gnomon. Each solar-term point on the 12h-line can estimate the position of the gnomon using Eq. (4). Let Nk be the mean distance from the gnomon to each solar-term point on the 12h-line. The distance from the winter solstice point to each solar-term point on the 12h-line (DkD11) can be measured from T840-plate. It can be compared with Nk + DiD11 as summarized in Table 1. The mean value of Nk + DiD11 is 76.29 ± 0.44 mm.
The measured from T840-plate was 76.0 mm. Therefore, the statistical position of the gnomon obtained by Eq. (4) is consistent with the actual position of the gnomon on the T840 sundial.
4.DISCUSSIONS
As shown in Fig. 4(b), various origins were generated during the acquisition of the convergent point. For T840-plate, the other origins except AA were distributed on the extended line of the 12h-line. If any origin is farther away from or close to the solar-term-lines, the statistical value may change to larger or smaller. The origin P1 is the closest to solar-term-lines, and the origin P3 is the farthest from them.
The mean latitude calculated is sensitive to changes in the origin. Fig. 9 shows the distribution of ϕi for each origin. The abscissa is the position of the origin, and the ordinate is the mean latitude (ϕi) for each origin. The closer the origin is to the solar-term-lines, the larger the mean latitude is estimated by Eq. (1). The rate of the mean latitude change was -19.32´/mm. When two origins had a difference of 3 mm, the latitude between the two shows a difference of 1° statistically.
On the other hand, the ϕi obtained by Eq. (2) was 36° 55´ ± 24´. This value was smaller than the mean latitude obtained by Eq. (1) (37° 15´ ± 27´), and showed a larger difference from the real latitude of T840 (37° 39´). The rate of ϕi’s change by Eq. (2) was -18´/mm.
The mean length of the gnomon was impervious to the change in the origin. Fig. 10 shows the distribution of Hi for each origin. The farther the origin is from the solar-termlines, the larger the mean length of the gnomon is estimated by Eq. (3). The rate of Hi’s change per 1.0 mm in the origin was 0.27 mm. When two origins had a difference of 3.6 mm, the length of the gnomon between the two statistically shows a difference of 1 mm.
Finally the position of the gnomon was also insensitive to the change in the origin. Fig. 11 shows the distribution of OA for each origin (see Fig. 3). The farther the origin is from the solar-term-lines, the larger the OA value is calculated by Eq. (4). The rate of OA’s change per 1.0 mm in the origin was 1.12 mm.
5.CONCLUSIONS
T840 is a horizontal sundial that was newly manufactured considering the latitude of Hanyang (Lee 1984). This Westernstyle sundial with a missing gnomon is owned by the National Palace Museum of Korea. According to the studies of Lee (1982, 1985), the gnomon of this sundial is widely accepted as being triangular in shape, and the triangular gnomon is applied to its reconstruction in many museums.
In the present study, the latitude of T840 sundial is estimated using its 3D scan data provided by the Cultural Heritage Administration of Korea. By extending the hour-lines of T840- plate, the various origins are produced around the ideal convergent point. This study can verify whether the statistical results of a horizontal sundial are consistent with the inscription of T840 in which the latitude of Hanyang is specified as 37° 39´. This study can be summarized according to the following three main points.
First, the latitude of T840 was statistically estimated to be 37° 15´ ± 26´, which is consistent with the actual value in its inscription within a difference of about 24´. However, the estimation of the latitude is very sensitive to variation of an origin, and the rate of its change was -19.32´/mm. For the latitude estimation, its calculation could be performed using only the solar-term point on the 12h-line, but it showed a larger difference from the real value.
Second, the length and position of a vertical gnomon were consistent with the measure of T840-plate. It is generally understood that it is convenient to use a triangular gnomon to read a time from hour-lines on a horizontal sundial. However, if this sundial used to a vertical gnomon similar to Chen & Hua (2011), it is very interesting the fact that the length of the gnomon was consistent with the size of the cone-shaped groove engraved on the artifact. The length of the triangular cone-shaped groove was 43.1 mm, and our statistical result is 43.70 ± 0.66 mm. Also, the position of the gnomon showed an error of 0.29 mm. In addition, when the origin is varied by 1 mm, estimates of the length and position of the gnomon vary only 0.27 mm and 1.12 mm, respectively.
Third, this study found that T840 used a vertical stylus, that is, perpendicular to the horizontal plane, rather than an inclined triangular gnomon. This is why a triangular gnomon needs to have at least two hole traces for the gnomon’s installation where the two holes are placed on the extension of the 12h-line. However, T840-plate has the trace of installation only at the position where the stylus is installed vertically.
We hope that this study will help in the investigation of the astronomical characteristics of a horizontal sundial which is remained only both straight lines and curved lines like T839. In the last decades in Korea, ones have made a lot of T840’s replication which is measured by a triangular gnomon, not a vertical gnomon. It will also need to investigate more evidence why replicas of T840 ware manufactured with a triangular gnomon, except the suggestion of Lee (1985).


