
1. INTRODUCTION
Predicting the 6 degree of freedom (6DOF) pose, that is, the relative position and attitude, of a spacecraft in space is a crucial aspect in the field of automatic rendezvous docking and space waste removal. Docking with space stations and spacecrafts facilitates the supply equipment, fuel, and crew. In 2020, mission extension vehicle-1 (MEV-1) supplied fuel to Intelsat 901, which is located in a geostationary orbit, to increase the lifespan of the spacecraft (Mayfield 2021). Because this task must be performed automatically, research on identifying the pose of a spacecraft using visual sensors without a human-in-the-loop is crucial. A software algorithm was developed to predict the pose of the target using light-emitting diodes (LEDs) was developed. The algorithm accepted images of targets, determined the center point of the LEDs, and estimated the three-dimensional (3D) relative positions and orientations from the two-dimensional (2D) coordinates of the LEDs. Software simulations with different observational errors and actual testbed experiments were conducted to determine their applicability in real environments (Hyun et al. 2018). Vision-based active sensors, such as light detection and ranging (LIDAR), are used for the pose determination of uncooperative targets (Opromolla et al. 2015). However, these pose-estimation approaches require special sensors to be attached to the spacecraft. In contrast, deep learning can be used for pose estimation to dock with a noncooperative spacecraft using only a single camera. However, training deep-learning methods in outer space is expensive. Therefore, we constructed a virtual simulation environment on the ground to generate synthetic images for training a deep-learning model based on the unreal engine 4 (UE4) (Sanders 2016).
The Kelvin’s Pose Estimation Challenge (KPEC) was held at ESA’s Advanced Concepts Team (ACT) (Kisantal et al. 2020). Estimating the pose of a spacecraft for given synthetic/real images using deep learning is a challenging task. The KPEC winners used two main methods. The first method directly estimated the relative pose (three-dimensional position vector and relative orientation quaternion) of the spacecraft from the image using deep learning. The second method modeled the spacecraft and determined 2D landmark (key point) coordinates on images using deep learning. They estimated the pose of the spacecraft by associating the landmarks with the corresponding 3D positions in the spacecraft model. Proença & Gao implemented a virtual simulation environment to generate synthetic images. unreal rendered spacecrafts on-orbit datasets (URSO) was built to generate photos of spacecraft orbiting the Earth and was used for deep learning training. URSO is based on a visual simulation program called the UE4. The generated images were directly used in the ResNet model, a deep learning model, to predict the relative position vectors and orientation quaternions (Proença & Gao 2019). By creating a 3D model of an artificial spacecraft called Tango, 11 vertices of the outer skeleton were designated as landmarks. The 2D landmark coordinates on the image were then estimated using a high-resolution network (HRNet) deep-learning model, and the relative pose was estimated using nonlinear least squares (NLS; Chen et al. 2019). Phisannupawong et al. (2020) employed the GoogLet model to estimate 6DOF from the URSO dataset (Phisannupawong et al. 2020). Garcia et al. used spacecraft pose estimation dataset (SPEED) as their dataset. They estimated the bounding box of a spacecraft by using LSPNet (Garcia et al. 2021). Choi et al. manufactured a tong-shaped docking port for docking experiments. Consequently, they developed a deep learning model using images of the docking port set in various external environments. The relative position was predicted and the model was applied to an actual docking experiment (Choi et al. 2021).
In a preliminary study, synthetic images were used for both training and testing of a deep learning model. certain studies have applied deep-learning models trained with synthetic images to several real image samples. In addition, to perform a hardware experiment that identified poses in real time, a deep learning model was trained using similar real images. Owing to the difficulty of obtaining sufficient real data for learning in an actual space environment, this study trained a deep learning model using only synthetic images. We confirmed that the applicability of the model to actual images by performing hardware experiments in a laboratory. Further, a virtual space environment was constructed to generate synthetic images of a spacecraft. Vertices representing the geometric features of the satellite were defined as landmarks, and the 2D coordinates of these landmarks were recorded for each image. The images and each landmark coordinate were entered into the deep learning model for training to find landmark coordinates from the images. Subsequently, the trained deep learning model was applied to a real image captured using an actual camera in a hardware experiment. Finally, the pose was calculated using the least-squares method from the estimated 2D landmark coordinates. In addition, this study demonstrated that a deep learning model trained using only synthetic images can be sufficiently applied to real images. To prove this, we compared the actual hardware experimental results in a laboratory with a software simulation with the same relative distance.
2. METHODS
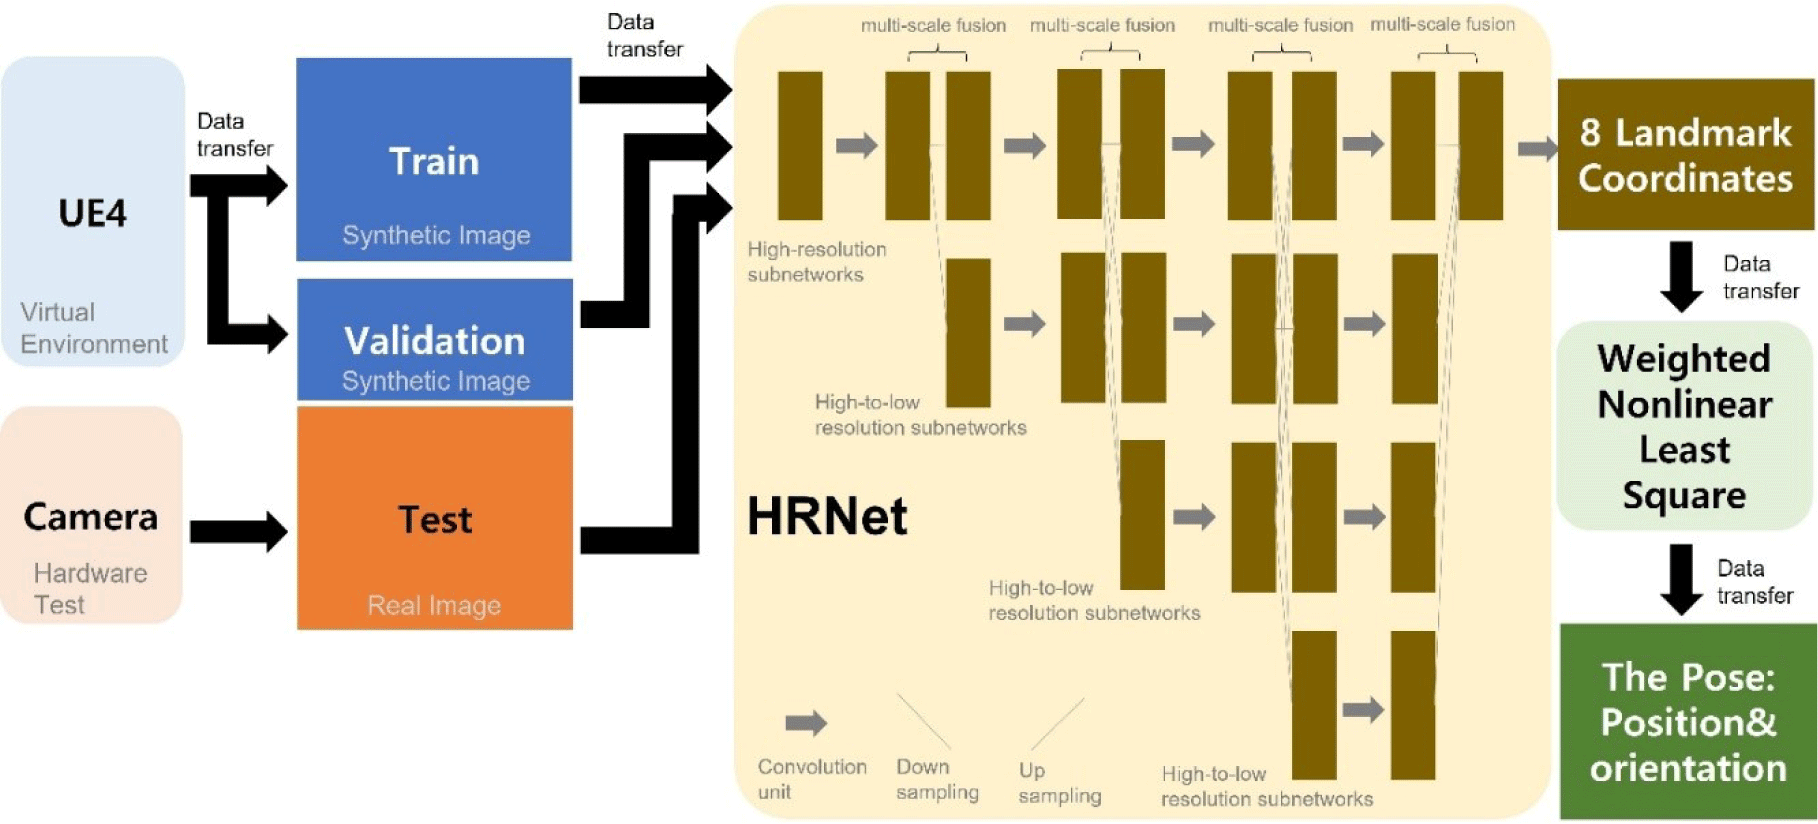
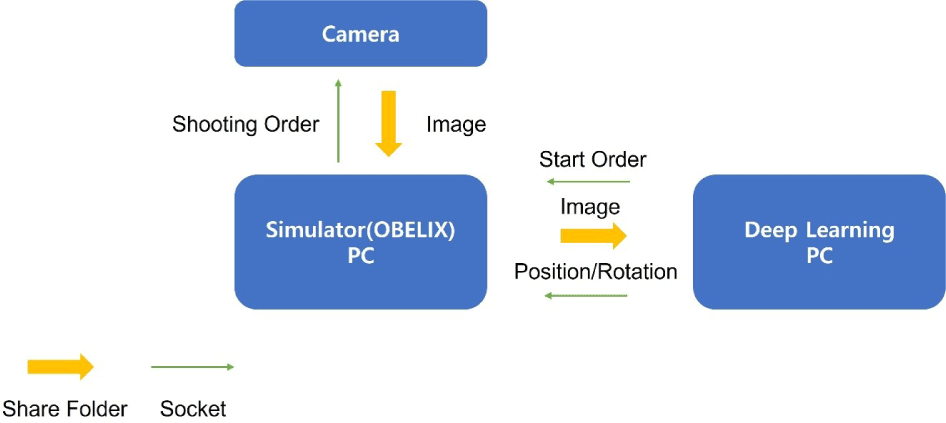
In this study, we established a real-time pose estimation system for docking to confirm its accuracy and calculation time. First, we created a virtual environment and generated synthetic spacecraft images. The images were input into the deep learning model for training to determine the key points. The trained deep learning model was then applied to real images captured by an actual camera. Finally, the pose was calculated based on the estimated key point coordinates using triangulation and the least-squares method. As shown in Fig. 1, the first step involved building a virtual environment that simulated a laboratory using UE4, a 3D game simulation program. For the hardware experiments on the ground, we substituted the spacecraft with a simulator. The program generated images and recorded the position and attitude of the simulator (spacecraft) and camera. As indicated by the arrow in Fig. 1, the image generated in the first stage was transferred to the third stage of the deep learning model, and the location and attitude data for each image were transferred to the second stage. In addition, to test the algorithm, we produced real images by capturing photographs of the simulator in a laboratory.
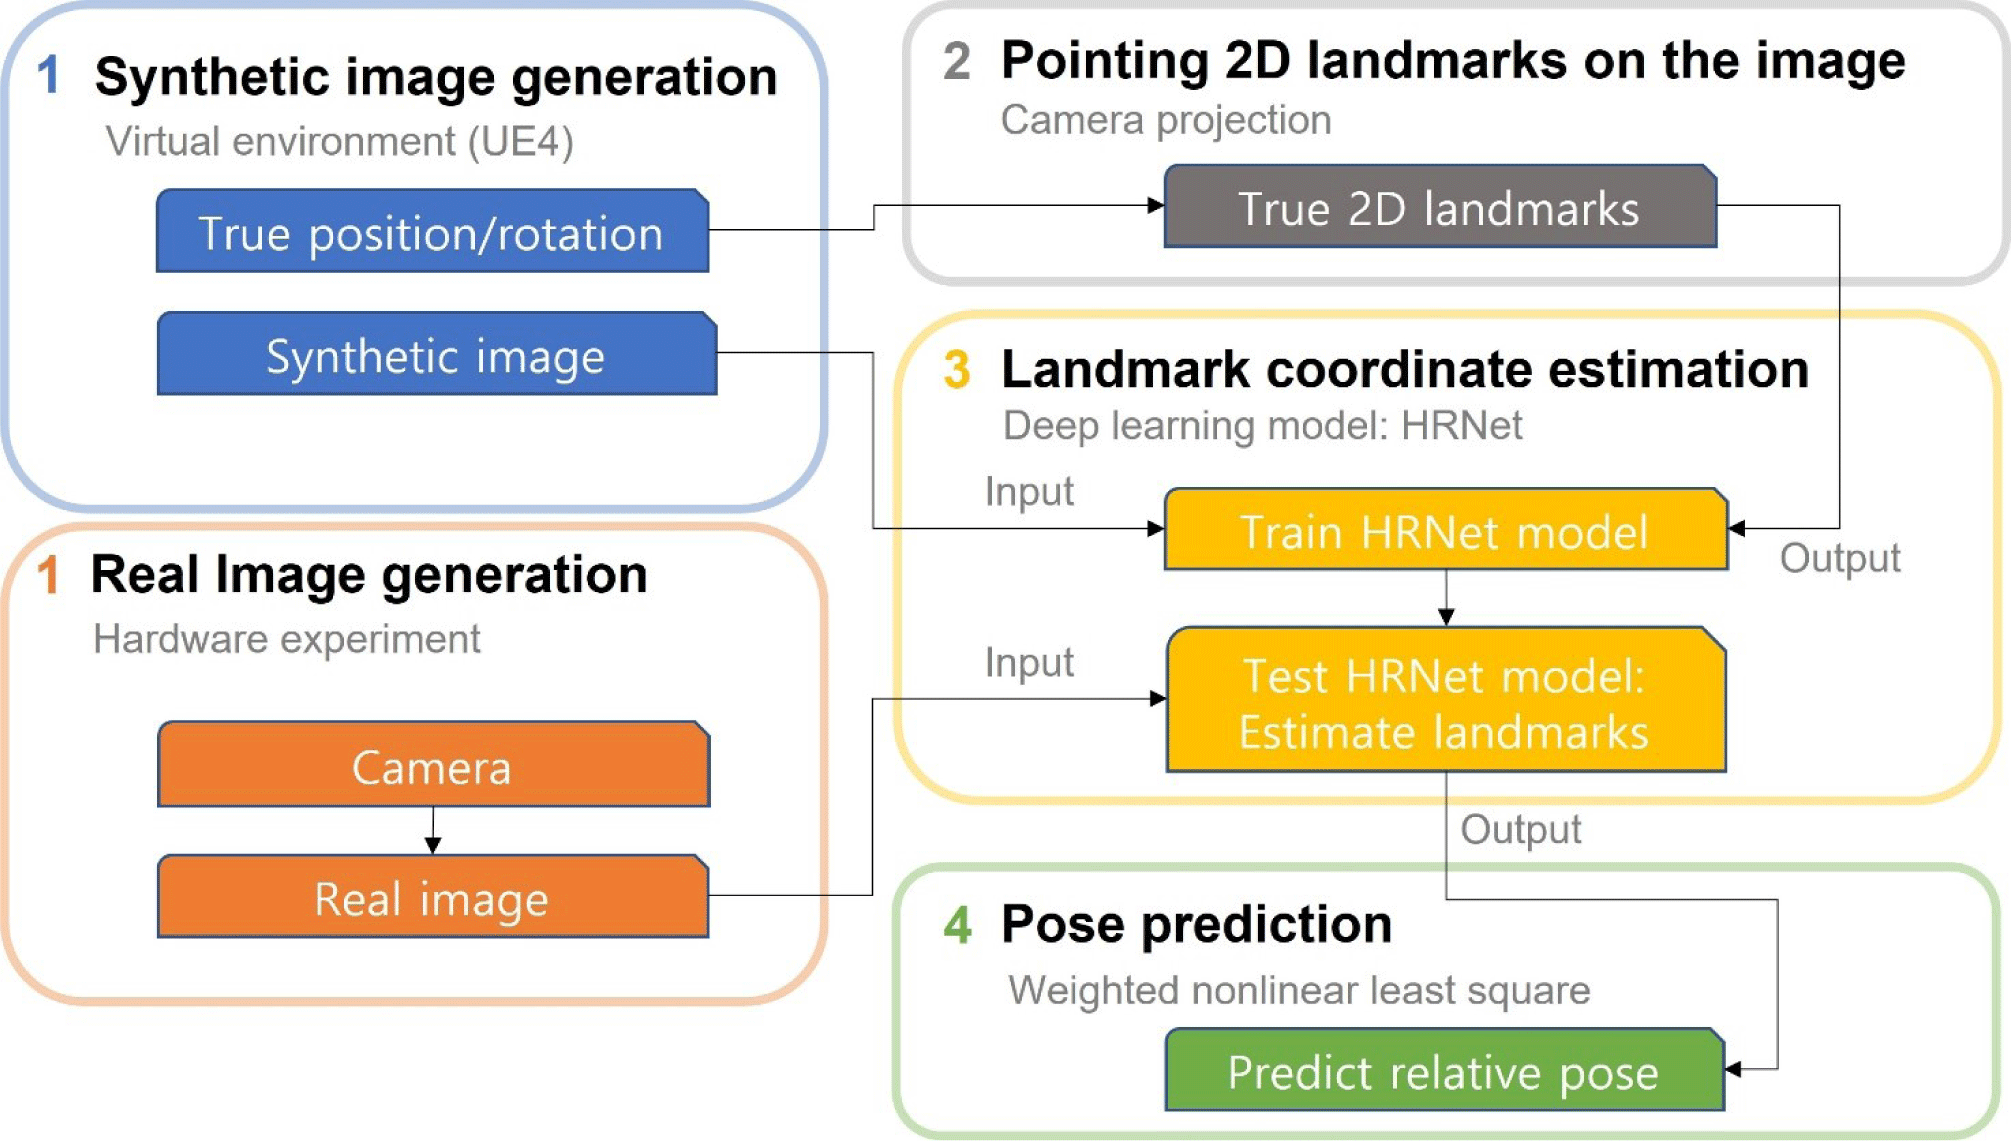
In the second step, the 2D landmarks (keypoints) on the image were calculated based on the position and attitude values of the camera and simulator using camera perspective projection. Subsequently, the coordinate data were transferred to the third step, wherein the deep learning model was trained to use an image as an input value and produce landmark coordinates as output values. In the third step, 90% of the synthetic images were used as training data and the remaining 10% were used as verification data to check for normality. Real images from the hardware experiment were input into the trained model, which then estimated the landmark coordinates. Finally, in the fourth step, the pose was predicted using the weighted nonlinear least-squares method from the landmark coordinate output from the third step.
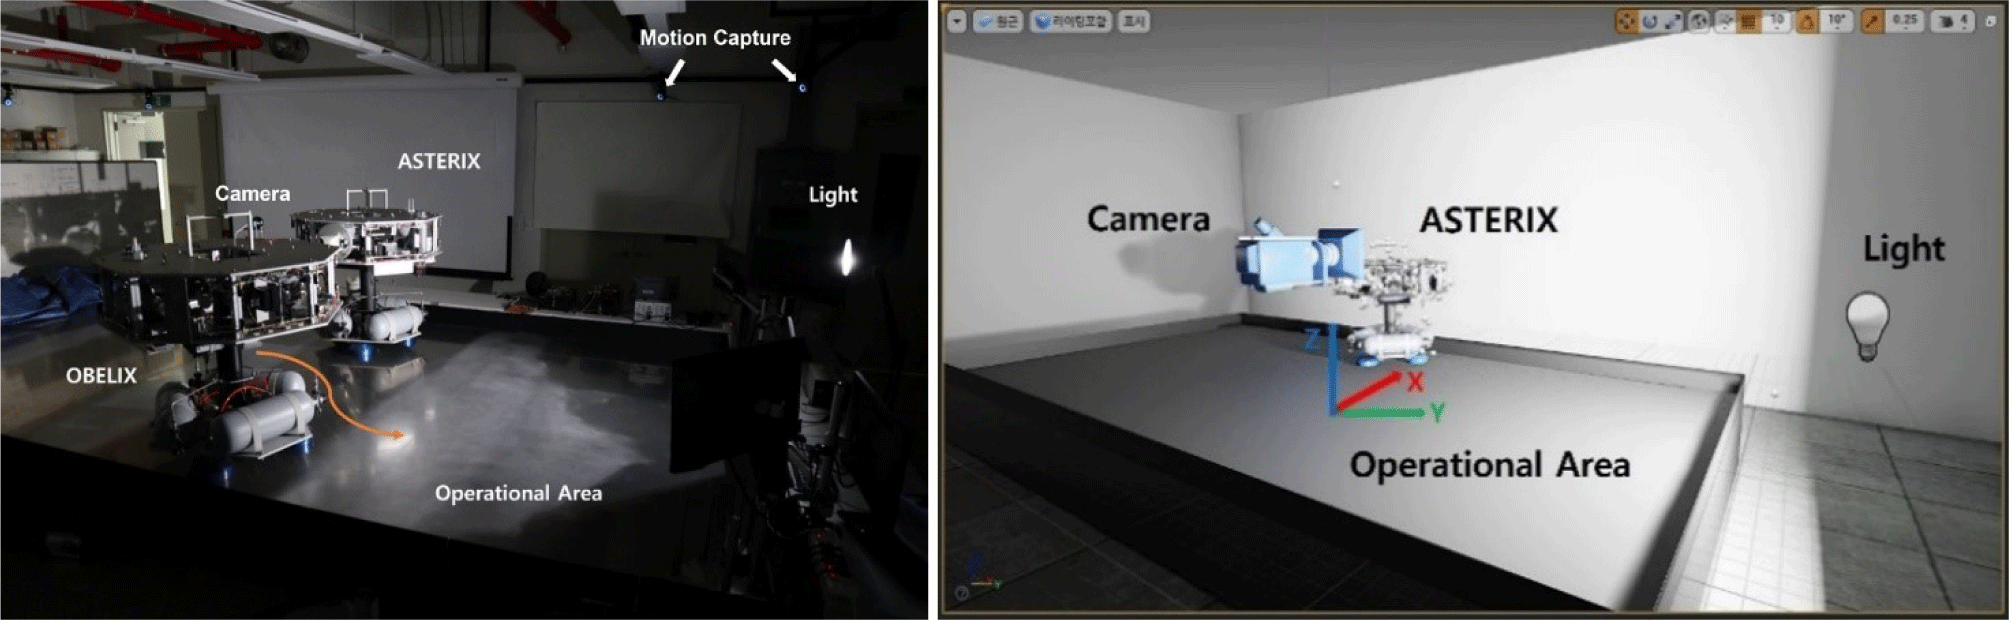
In this study, to generate data for deep learning training, we randomly generated several photographs by creating a virtual environment similar to that of the laboratory and setting the desired pose of the simulator. Fig. 2 shows the laboratory environment for the hardware test. The hardware testbed system comprised an observation target simulator (autonomous spacecraft test environment for rendezvous in proximity, ASTERIX), a simulator (OBLIX) equipped with a camera, and a deep learning computer that estimated landmark coordinates and predicted poses from images. A standing light was placed on the right, and the others were blocked. Eight motion-capture cameras were attached to the ceiling around the test bed. ASTERIX, which has a structure with eight landmarks at the top, fixed its position. The OBELIX photographed ASTERIX with a camera and was moved via an external personnel in this study. We created a virtual simulation environment based on the 3D game engine program UE4. Lighting in our environment involved correct and directional light to simulate standlight and sunlight, respectively. The center of the test bed was set as the origin. We set the vertical axis of the table as the X axis, the horizontal axis as the Y axis, and the direction perpendicular to the work plane as the Z axis. The simulator OBELIX moved with a camera and captures pictures of the other simulator (ASTERIX) in real time to predict the pose. We inserted the ATERIX 3D model into the UE4 and fixed it at a specific position. OBELIX was simulated as a camera moving around ASTERIX and capturing pictures of it. The motion-capture results were used as reference values.
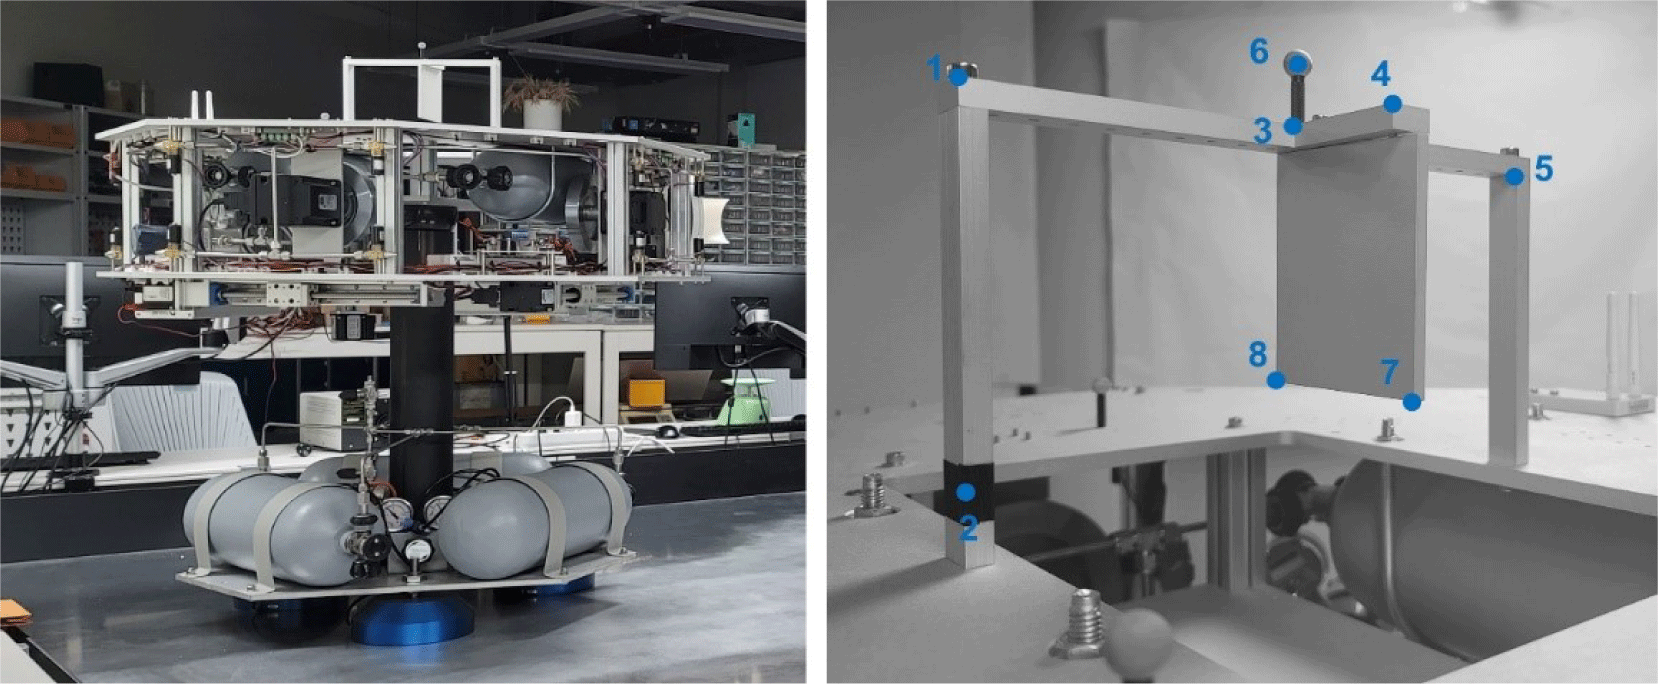
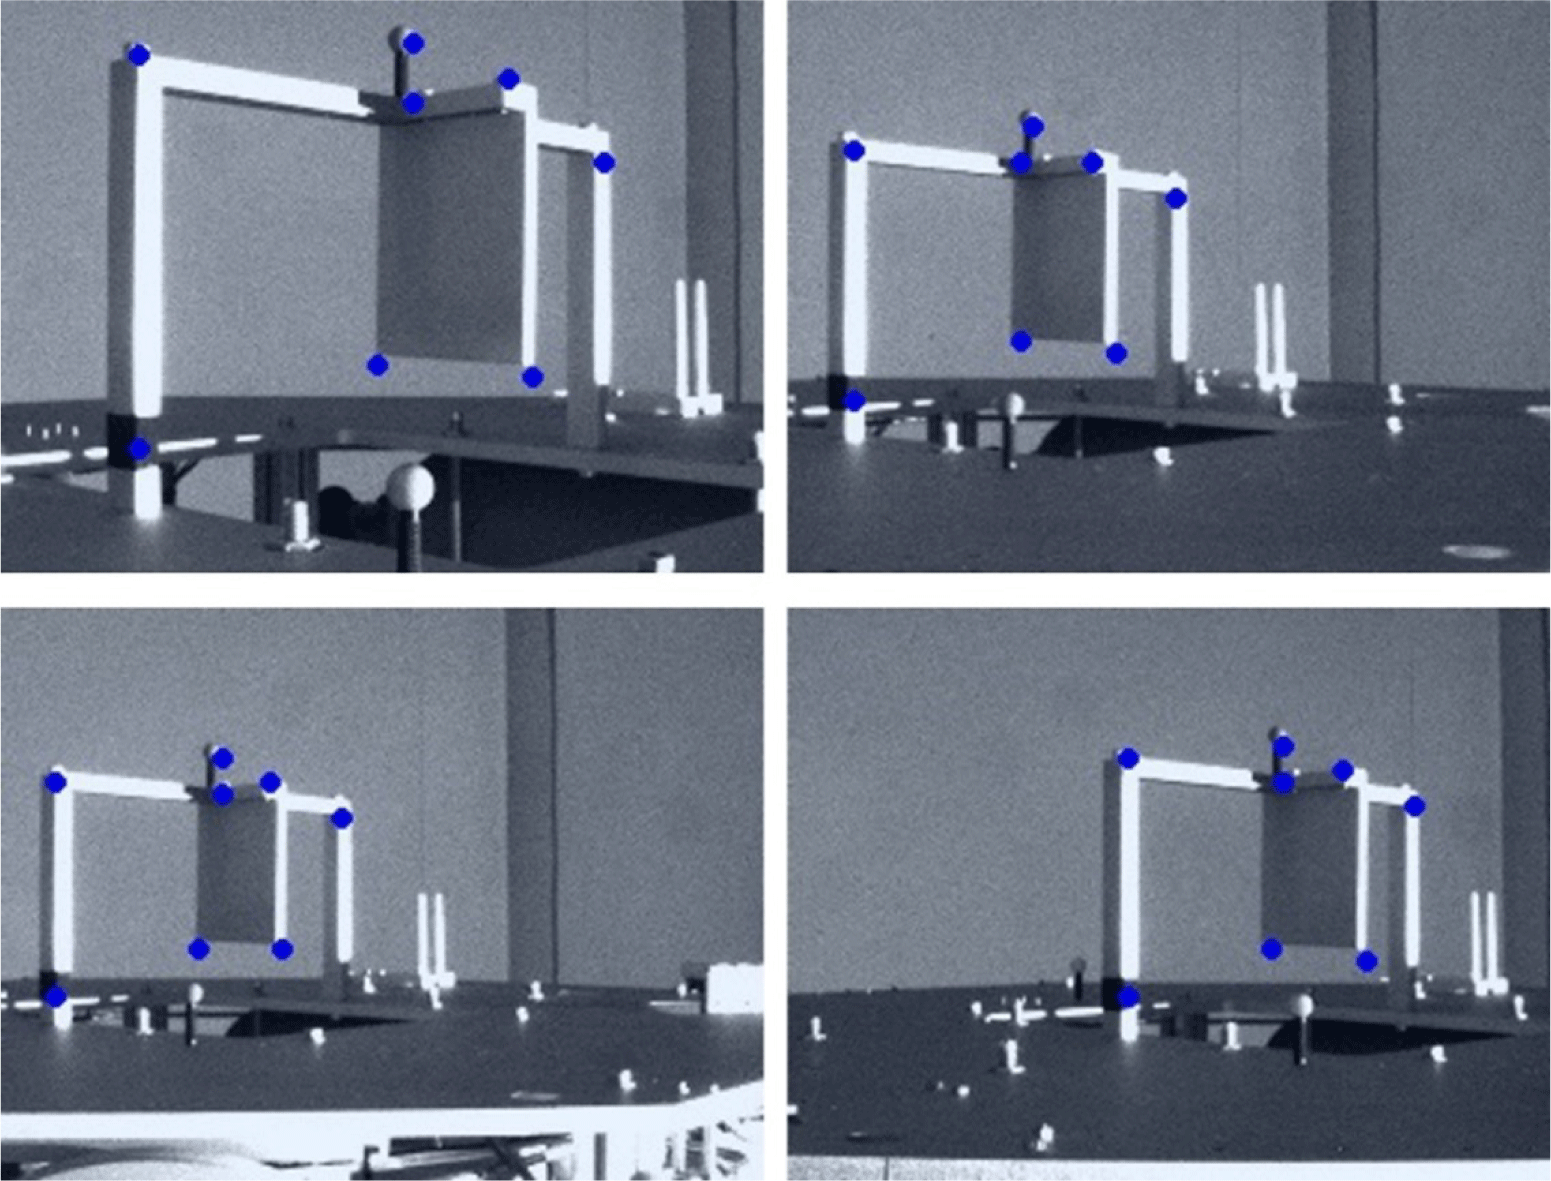
A landmark refers to key points that visually represent the structural characteristics of a target. We estimated the pose between the camera and target from the 2D arrangement of the landmarks. At the top of the simulator model, vertices representing geometric features were defined as landmarks. Using a simulation program, we created an environment similar to that in an actual laboratory and generated a realistic synthetic simulator. Eight points were selected as landmarks, as shown in Fig. 3. These landmarks simply represent the geometric characteristics (vertices) of ASTERIX observed from the camera height.
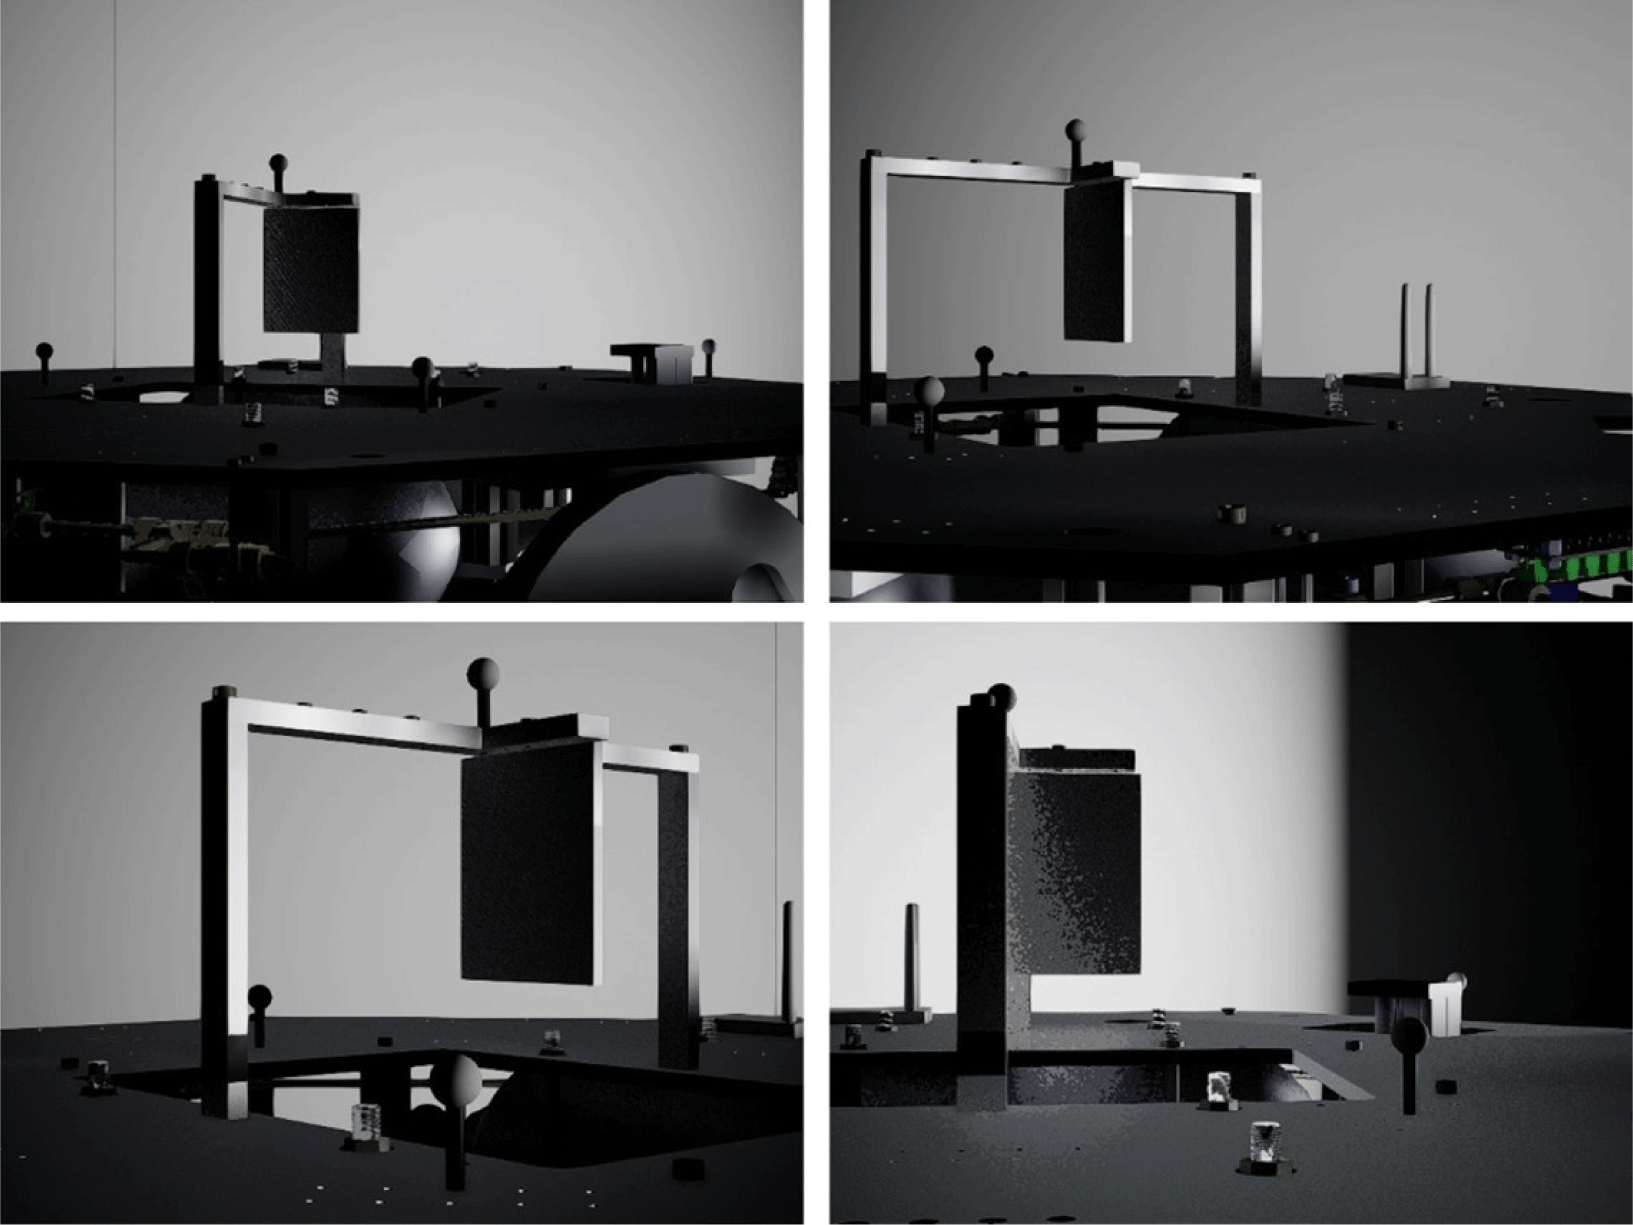
To generate 5,000 synthetic images, the camera orientation was randomized and randomly placed within the target viewing and operating range of [50 160] cm. This distance range was determined based on the limitations of movement in the laboratory. Fig. 4 shows the output image samples.
In contrast to synthetic images, the application of real images to a deep learning model is challenging because of black and white noise and large contrast of light. Therefore, before inserting the synthetic images into the deep learning model for training, we added black and white noise to the images using Matrix Laboratory (MATLAB) and modified their brightness.
Before training the deep learning model, we considered the 2D landmarks on the synthetic images. The coordinates of the landmark were calculated based on the camera perspective projection from the pose value for each generated image. The position of the 2D landmark in the image was calculated considering coordinate system transformation and camera perspective projection, as shown in Fig. 5. The origin was moved to the center of the camera. In addition, we define the rotational transformation of the camera coordinate system to the world coordinate system. The camera gaze direction was defined as the X-axis, the horizontal direction of the captured image was defined as the Y-axis, and the vertical downward direction was defined as the Z-axis. The coordinates of the landmark in the 2D image were then calculated using the focal length f of the camera.
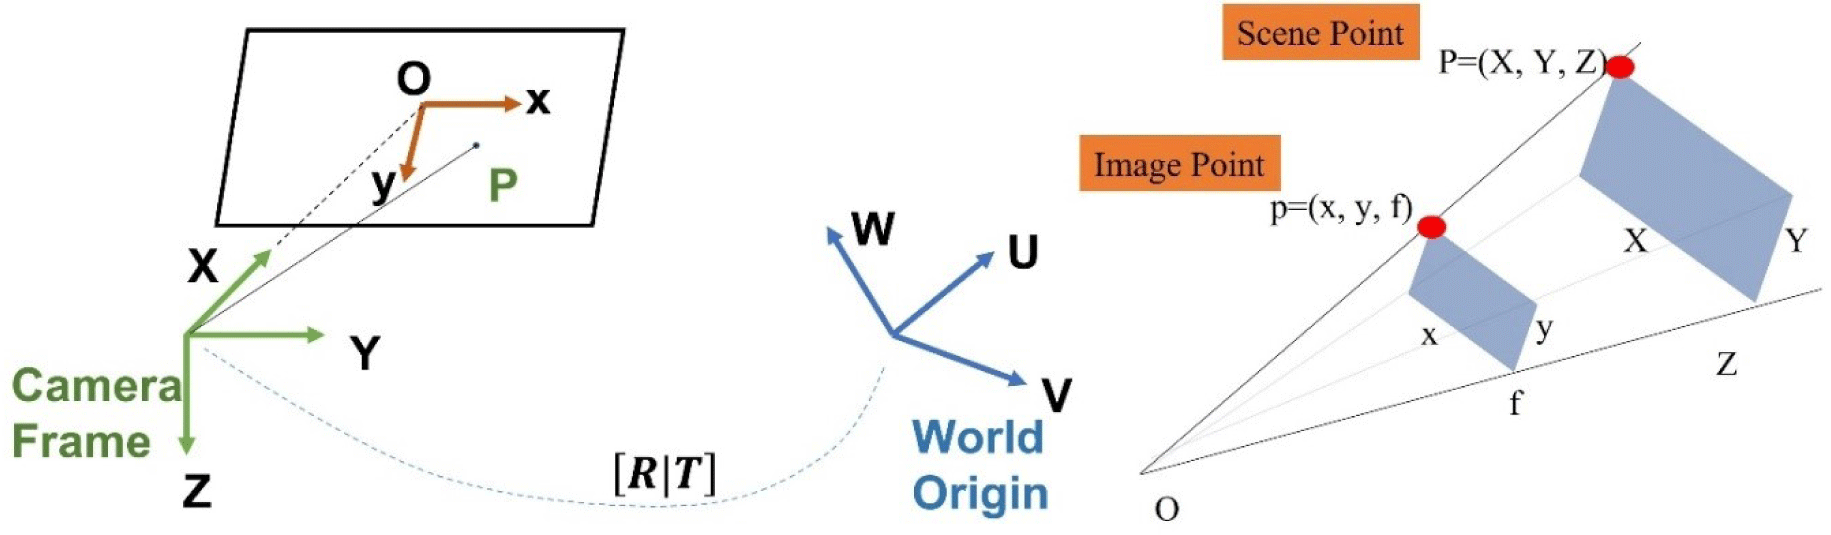
The coordinates of the landmarks are converted from the world system using the translation transformation matrix Ci(i = 1,2,3) and rotation matrix rij(i,j = 1,2,3) from world system. [U V W] represent the three-dimension position coordinates of the landmarks in the world coordinate system and [X Y Z] are the position of the three-dimensional landmarks in the camera coordinate system.
where fy,z is the focal length and is the distance from the lens to the charge-coupled device (CCD) wherein the image is formed; however, in this study, the distance from the point was converted into pixels. Further, the gaze direction in the camera coordinate system was the X-axis, and the Y- and Z-axes represent the horizontal and reverse vertical directions of the image, respectively. The y’ and z’ obtained through camera parameter matrix conversion are divided by x’.
In this study, 4,500 data points (i.e., 90% of the 5,000 data points) were used as training data, and 500 (i.e., 10%) were used as verification data to confirm normal training. Deep learning is a field of machine learning that simulates human thinking. It is an artificial neural network algorithm that comprises several stages of inner layers between the input and output data. In this study, we used a HRNet, which was optimized to find the coordinates of keypoints on the image. HRNet has two versions: W32 and W48. We used the W32 version to reduce the processing time because the results of the two models are similar, and W48 is a more complex model (Sun et al. 2019).
In Fig. 6, the training and validation data are synthetic images generated by the UE4. The test data were real images captured by a camera in the hardware test for algorithm evaluation. In our DL model, the image is the input value and landmark coordinate values are the output values. Fig. 6 shows the data flow and overall structure of HRNet. The third process is illustrated in Fig. 1. The high-resolution subsystem began with the first step. In addition, subnetworks that facilitate conversion from high to low resolution were gradually added to create more steps and connect multiple-resolution subnetworks in parallel (Sun et al. 2019). The algorithm predicted the pose from these landmark coordinates using the weighted nonlinear least-squares method.
The data used in training comprised images, landmark coordinates, and whether the coordinates were observed (visible). For the landmark coordinates, the X-axis was in the range of 0–720, and the Y-axis was in the range of 0–540. Visibility was 1 if the landmark was in the image and 0 if it was outside the image. The images were PNG files of a grayscale image. The input image size was 720 × 540 pixels, and the output size was 256 × 196 pixels. The batch size, which is the number of data points to be trained at once, was set to eight considering the performance of the computer. The model was trained 50 times and the training rate was set to 0.001. Adam was used as the optimizer (Kingma & Ba 2015).
The pose was calculated from the landmark coordinates by reflecting the observation accuracy of the estimated coordinate values. The landmarks in 2D had a fixed relative position and arrangement relationship with each number in 3D. Therefore, the pose can be estimated from the coordinates of the landmarks in 2D. We used the weighted nonlinear least-squares method to estimate the pose between the camera and the simulator based on the observed data. This nonlinear optimization problem can be solved using various tools, such as the Gauss–Newton method, Newton–Raphson method, and gradient descent. We used the Levenberg–Marquardt method, the most widely used method in this study.
denotes the relative position/rotation matrix of the (k + 1)-th observation value. The matrix is defined by summing the rotational matrix rij(i,j = 1,2,3) representing the relative attitude, and vector representing the relative position (Hyun et al. 2018). In the k th observation, is the coordinates of the ith landmark. Landmark coordinates , which are observation data, are defined as a set of .
The deep learning model HRNet also represents the confidence of the resulting coordinates, with a value ranging as 0–1 when outputting the result (Sun et al. 2019). In general, the weight is the reciprocal of the observation variance. In this study, we define these weights as the reliability of deep learning estimation.
3. RESULTS
Software simulations were conducted to verify the pose estimation algorithm based on deep learning and to determine the causes of errors. In the software simulations, 500 verification images generated by UE4 were used as test images. Therefore, the exact position and orientation information of the camera and simulator were known for each image, and the true values of the 2D landmark coordinates in the image were recorded. These true landmark coordinate values were later used as the actual values. The errors in the landmark coordinates can be obtained through comparisons of the estimated and actual values. The vector size of the difference (Ep) between the estimated coordinates value () and the actual coordinate value () is defined as a landmark error: . The average landmark estimation error of the 500 validation data points was 7.3918 pixels for an image size of 720 × 540 pixels.
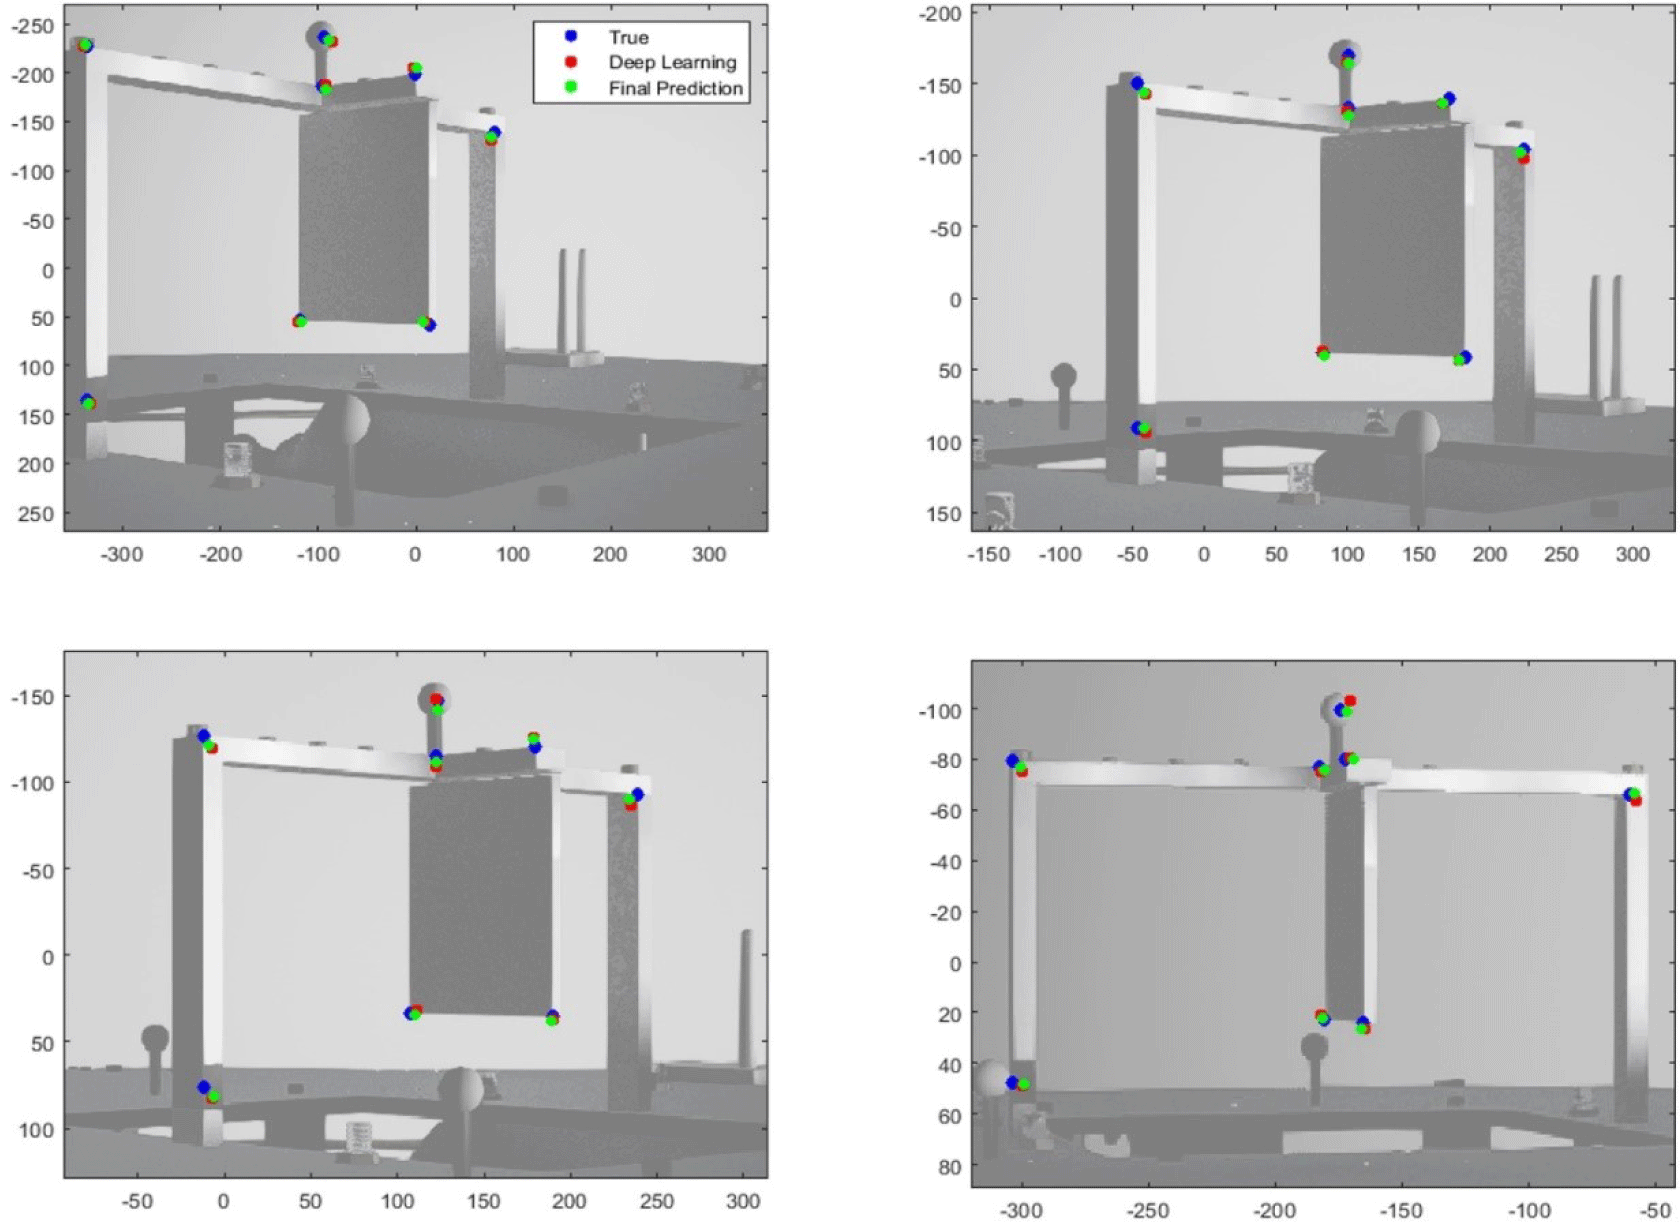
The pose was calculated using the weighted nonlinear least-squares method from the estimated landmark coordinates. Position and orientation errors were defined to calculate the accuracy of the results. The relative position error (ET) was calculated using the vector size of the difference between the actual and estimated positions: . The relative orientation error (ER) is defined as Hamiltonian product of the actual orientation quaternion (qtrue) and the estimated orientation quaternion (qest): (Kisantal et al. 2020). During the generation of synthetic data, the relative distance between the camera and the simulator was designated in the range of approximately 50–160 cm considering the actual laboratory environment. The average relative position error was 3.26 cm and the average orientation error was 14.14°. Fig. 7 shows the results of the software simulation using the verification image as sample data. The blue dots represent the actual landmarks, and the red dots represent the landmarks estimated by deep learning. In addition, the green dots represent the final landmarks predicted using the weighted nonlinear least-squares method.
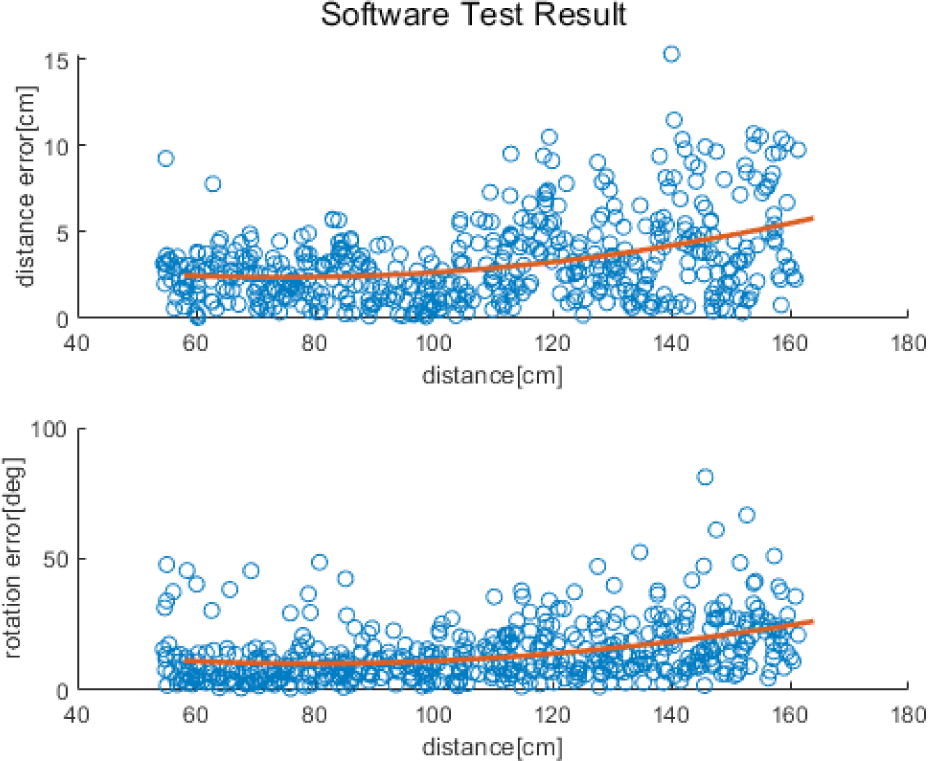
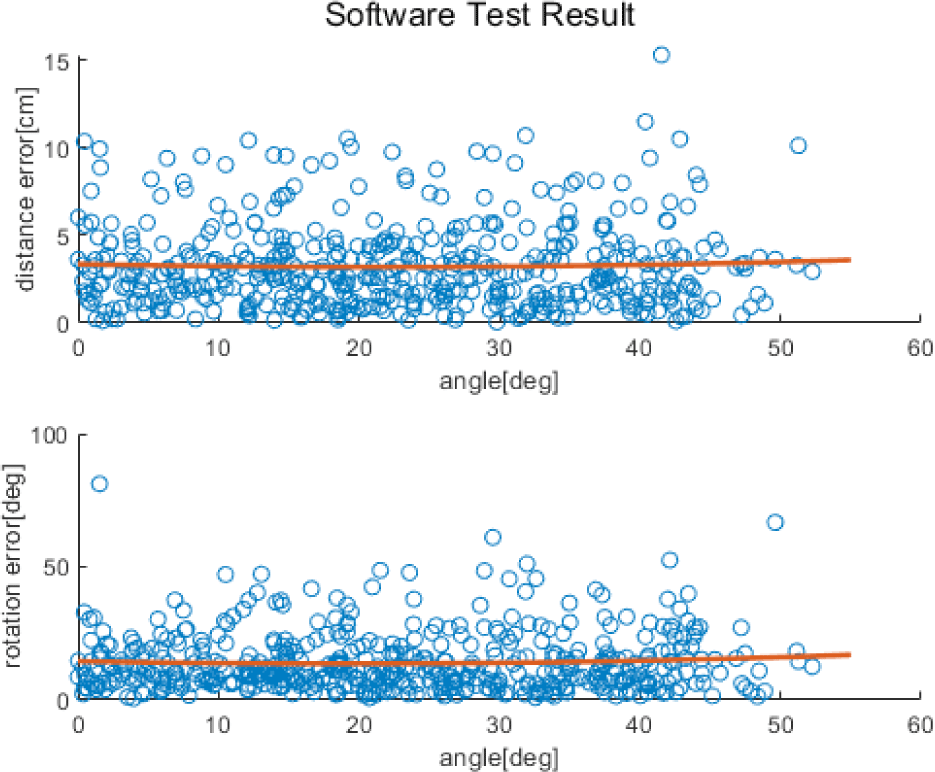
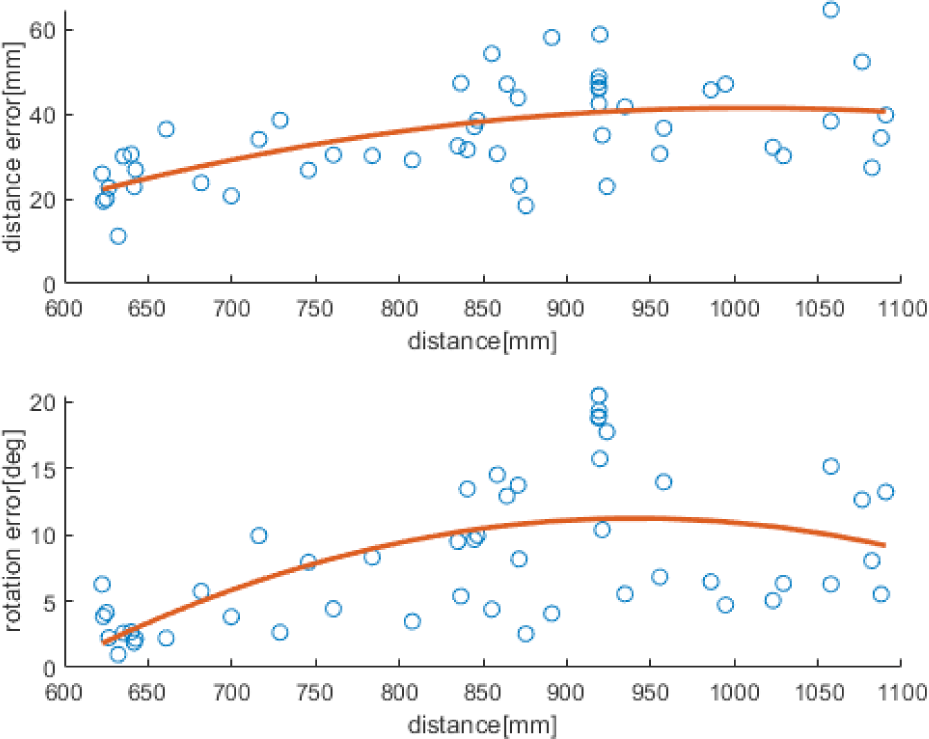
We analyzed the error trend of 500 verification data points according to the relative distance between the camera and the simulator. In Fig. 8, the X-axis represents the distance from the center of the simulator to the camera. In the upper graph, the Y axis represents the distance error, which is the difference between the estimated and actual positions. Whereas, the Y axis in the lower graph represents the orientation error. The red line is a second-order polynomial parabolic graph indicating the tendency of the overall error. Consequently, when the distance between the camera and the simulator increased, the pose error increased.
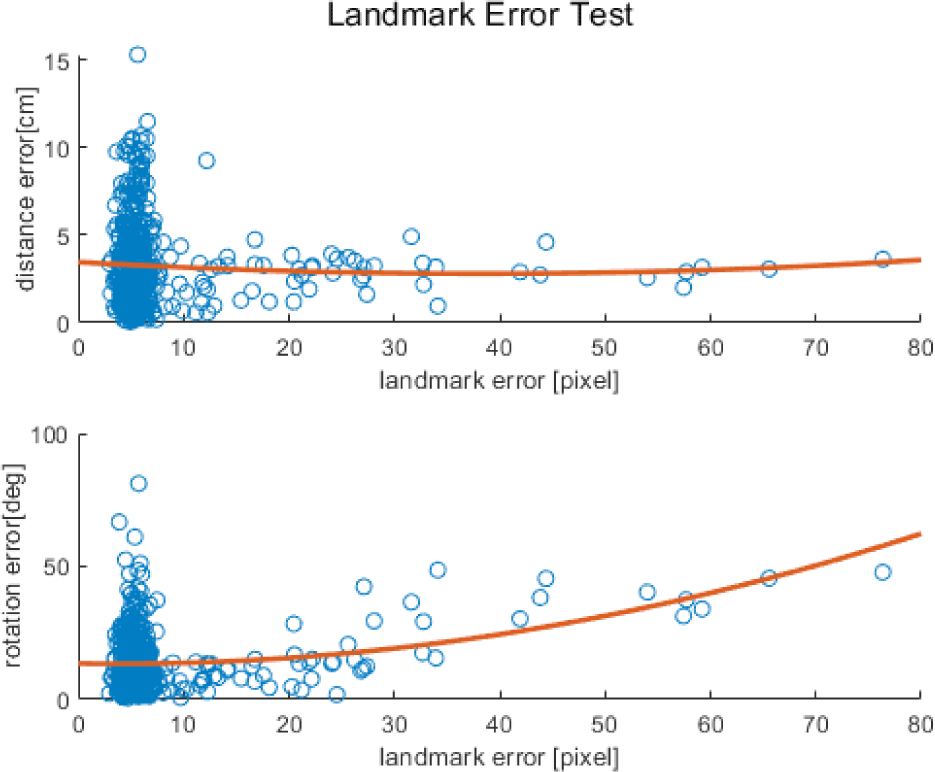
We also analyzed the error trend according to the relative rotation between the camera and simulator. In Fig. 9, the X-axis represents the relative rotation between the camera and the simulator. In the upper graph, the Y-axis represents the distance error and that in the lower graph represents the orientation error. The red parabolic line is a second-order polynomial parabolic graph exhibiting the tendency of the overall error. Overall, even when with increased in the relative rotation, the pose error did not change significantly. We also analyzed the variation of the pose error according to the landmark coordinate estimation error. The coordinate estimation error was expressed as pixels. In Fig. 10, the X-axis represents the average values of the eight landmark errors estimated by deep learning. The Y-axis of the upper and lower graphs represent the position and orientation errors, respectively. The red parabolic line is a second-order polynomial parabolic graph exhibiting the tendency of the overall error. Because the relative position estimation Was less affected by landmark errors, the position error yielded a constant value regardless of the landmark estimation error. The orientation error tended to increase with the landmark estimation error. The orientation was determined using a 2D landmark arrangement. Therefore, even in case of a slight shift in the 2D landmark’s coordinate location, the error increased.
We estimated the pose between the camera and simulator using hardware experiments. In the experiment, a camera-mounted simulator approached the observation target, and external personnel performed the movements of the simulator. The total experiment time was 50 s, and the landmarks were estimated by capturing pictures every second (51 photos in total). The pose between the camera and simulator was predicted from the estimated landmark coordinates and compared with the reference data obtained from motion capture. The results of the software simulation were compared with those of the hardware test. Subsequently, using a deep learning model trained with various noises, we analyzed how the pose estimation results varied depending on the noise in the learning image.
The simulator used linear air bearings to perform translational motion on a table with minimal friction. In addition, through adjustments of the balance of the attached mass units, the center of gravity and rotation were matched to ignore the gravitational torque. A three-degree friction-free rotation motion was performed using spherical air bearings. Consequently, the satellite simulator can simulate frictional 5-DOF motion (Eun et al. 2018).
We set the DL computer specifications such that the DL model could perform smoothly. Moon (2022) described the main hardware configuration (Moon 2022). The internal parameter matrix of the camera was measured using the GML C++ Camera Calibration Toolbox v0.72, developed by the National University of Moscow Graphics and Media Lab (Zhang 2000).
Transmission and reception are based on socket communication and network folder sharing. In this study, while executing a deep learning program on a deep learning computer, a command was sent to the simulator computer to record via the camera every second. Upon receiving this command, the simulator computer (OBLIX) sent a photography command to the camera and stores the image in a network-sharing folder with the deep learning computer, which estimates landmark coordinates by inputting the stored image into the model and predicts the pose using the weighted NLS method. The calculated pose data are transmitted and stored on a simulator computer through socket communication. Fig. 11 illustrates this process.
We used motion capture data as the reference data (actual data). The motion capture is called Primex-13. It was manufactured at OptiTrack in San Francisco, CA, USA. It tracks passive and active with positional error less than ± 0.20 mm and rotational errors less than 0.5°. Eight sensing cameras were installed on the ceiling around the laboratory testbed and location-detection sensors were attached to the simulator. Any motion captured the observed locations of the sensors in real time. Consequently, the motion capture program converts the location of the sensors into a pose between the camera and the fixed simulator (ASTERIX).
The simulator with the camera was arbitrarily moved, whereas the other was photographed. Consequently, the pose between the camera and simulator was calculated and recorded in real time. Fig. 12 shows the landmarks estimated using deep learning (blue dots). Total of 51 images were captured.
The predicted poses were compared with the actual values, and the results are listed (Table 1). For 51 test data points, the average value of position errors excluding the results of the motion capture using deep learning was [–11.92 mm 1.94 mm 1.22 mm] for the X-, Y-, and Z-axis directions, respectively. The variance of the position error (absolute value) was [16.85 mm 7.17 mm 9.75 mm]. The X-axis is estimated to be biased and approximately 11.92 mm smaller on average than the true value. Whereas, Y- and Z-axis errors were estimated to be 1.94a 1.22 mm larger, respectively. Therefore, the Y- and Z-axis errors perpendicular to the gaze direction were not largely biased toward one side. However, the X-axis, which is the gaze direction, was deflected less than the actual value. It was confirmed that the X-axis error in the gaze direction had the largest absolute value, whereas the Y- and Z-axis error values were relatively small. The orientation errors on the X-, Y-axis-, and Z-axes were 0.6526°, 2.9342°, and 6.3758°, respectively. In addition, the average vector size of the position error was 23.84 mm and the posture error was 7.47°.
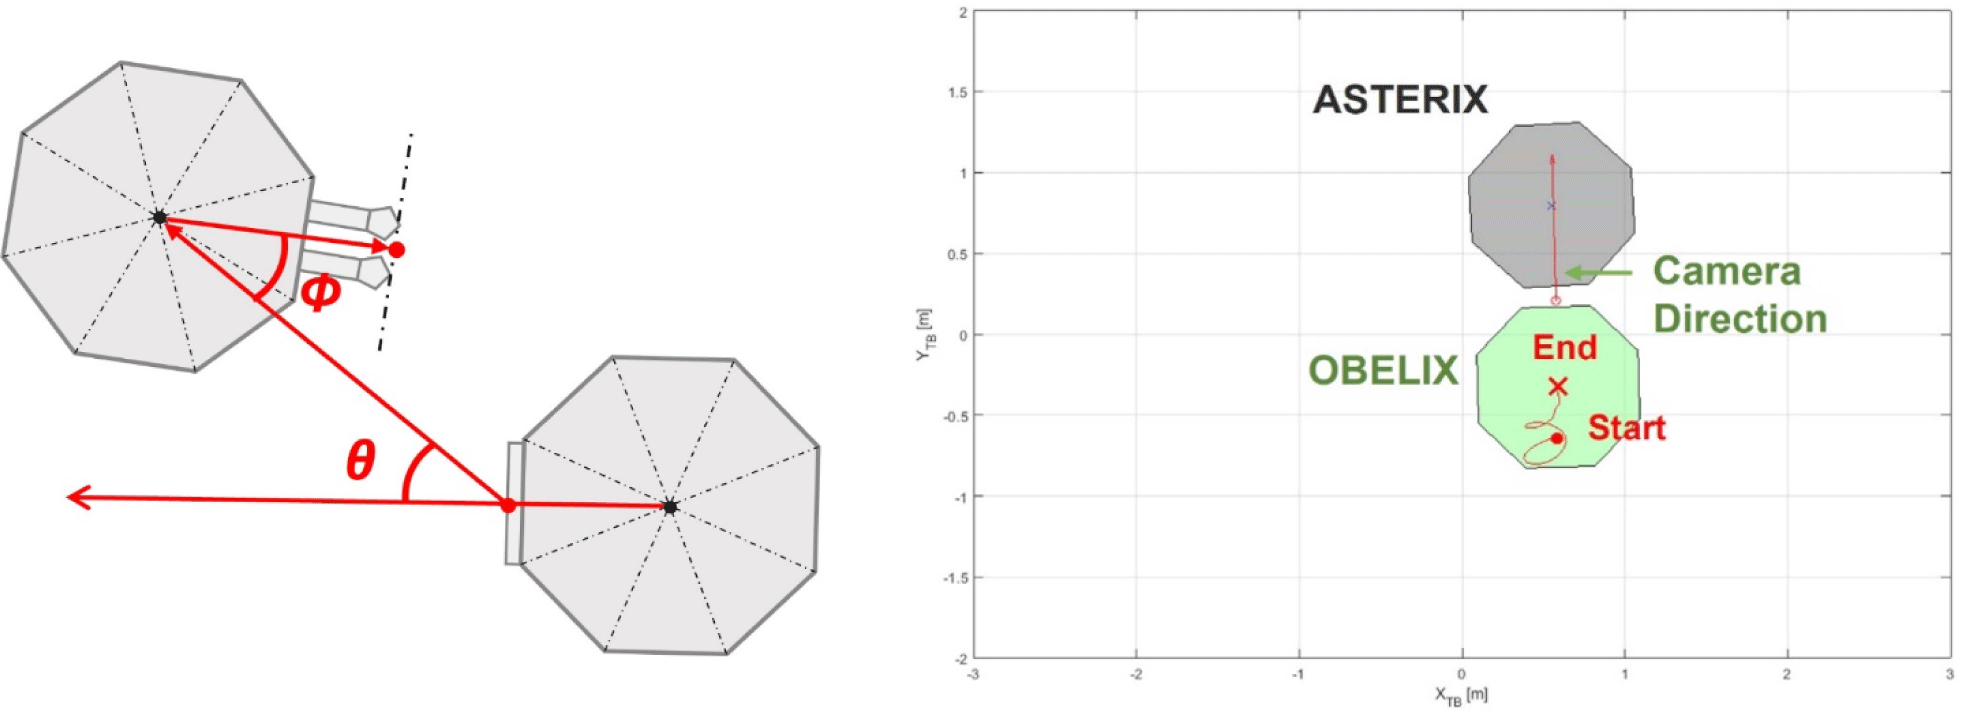
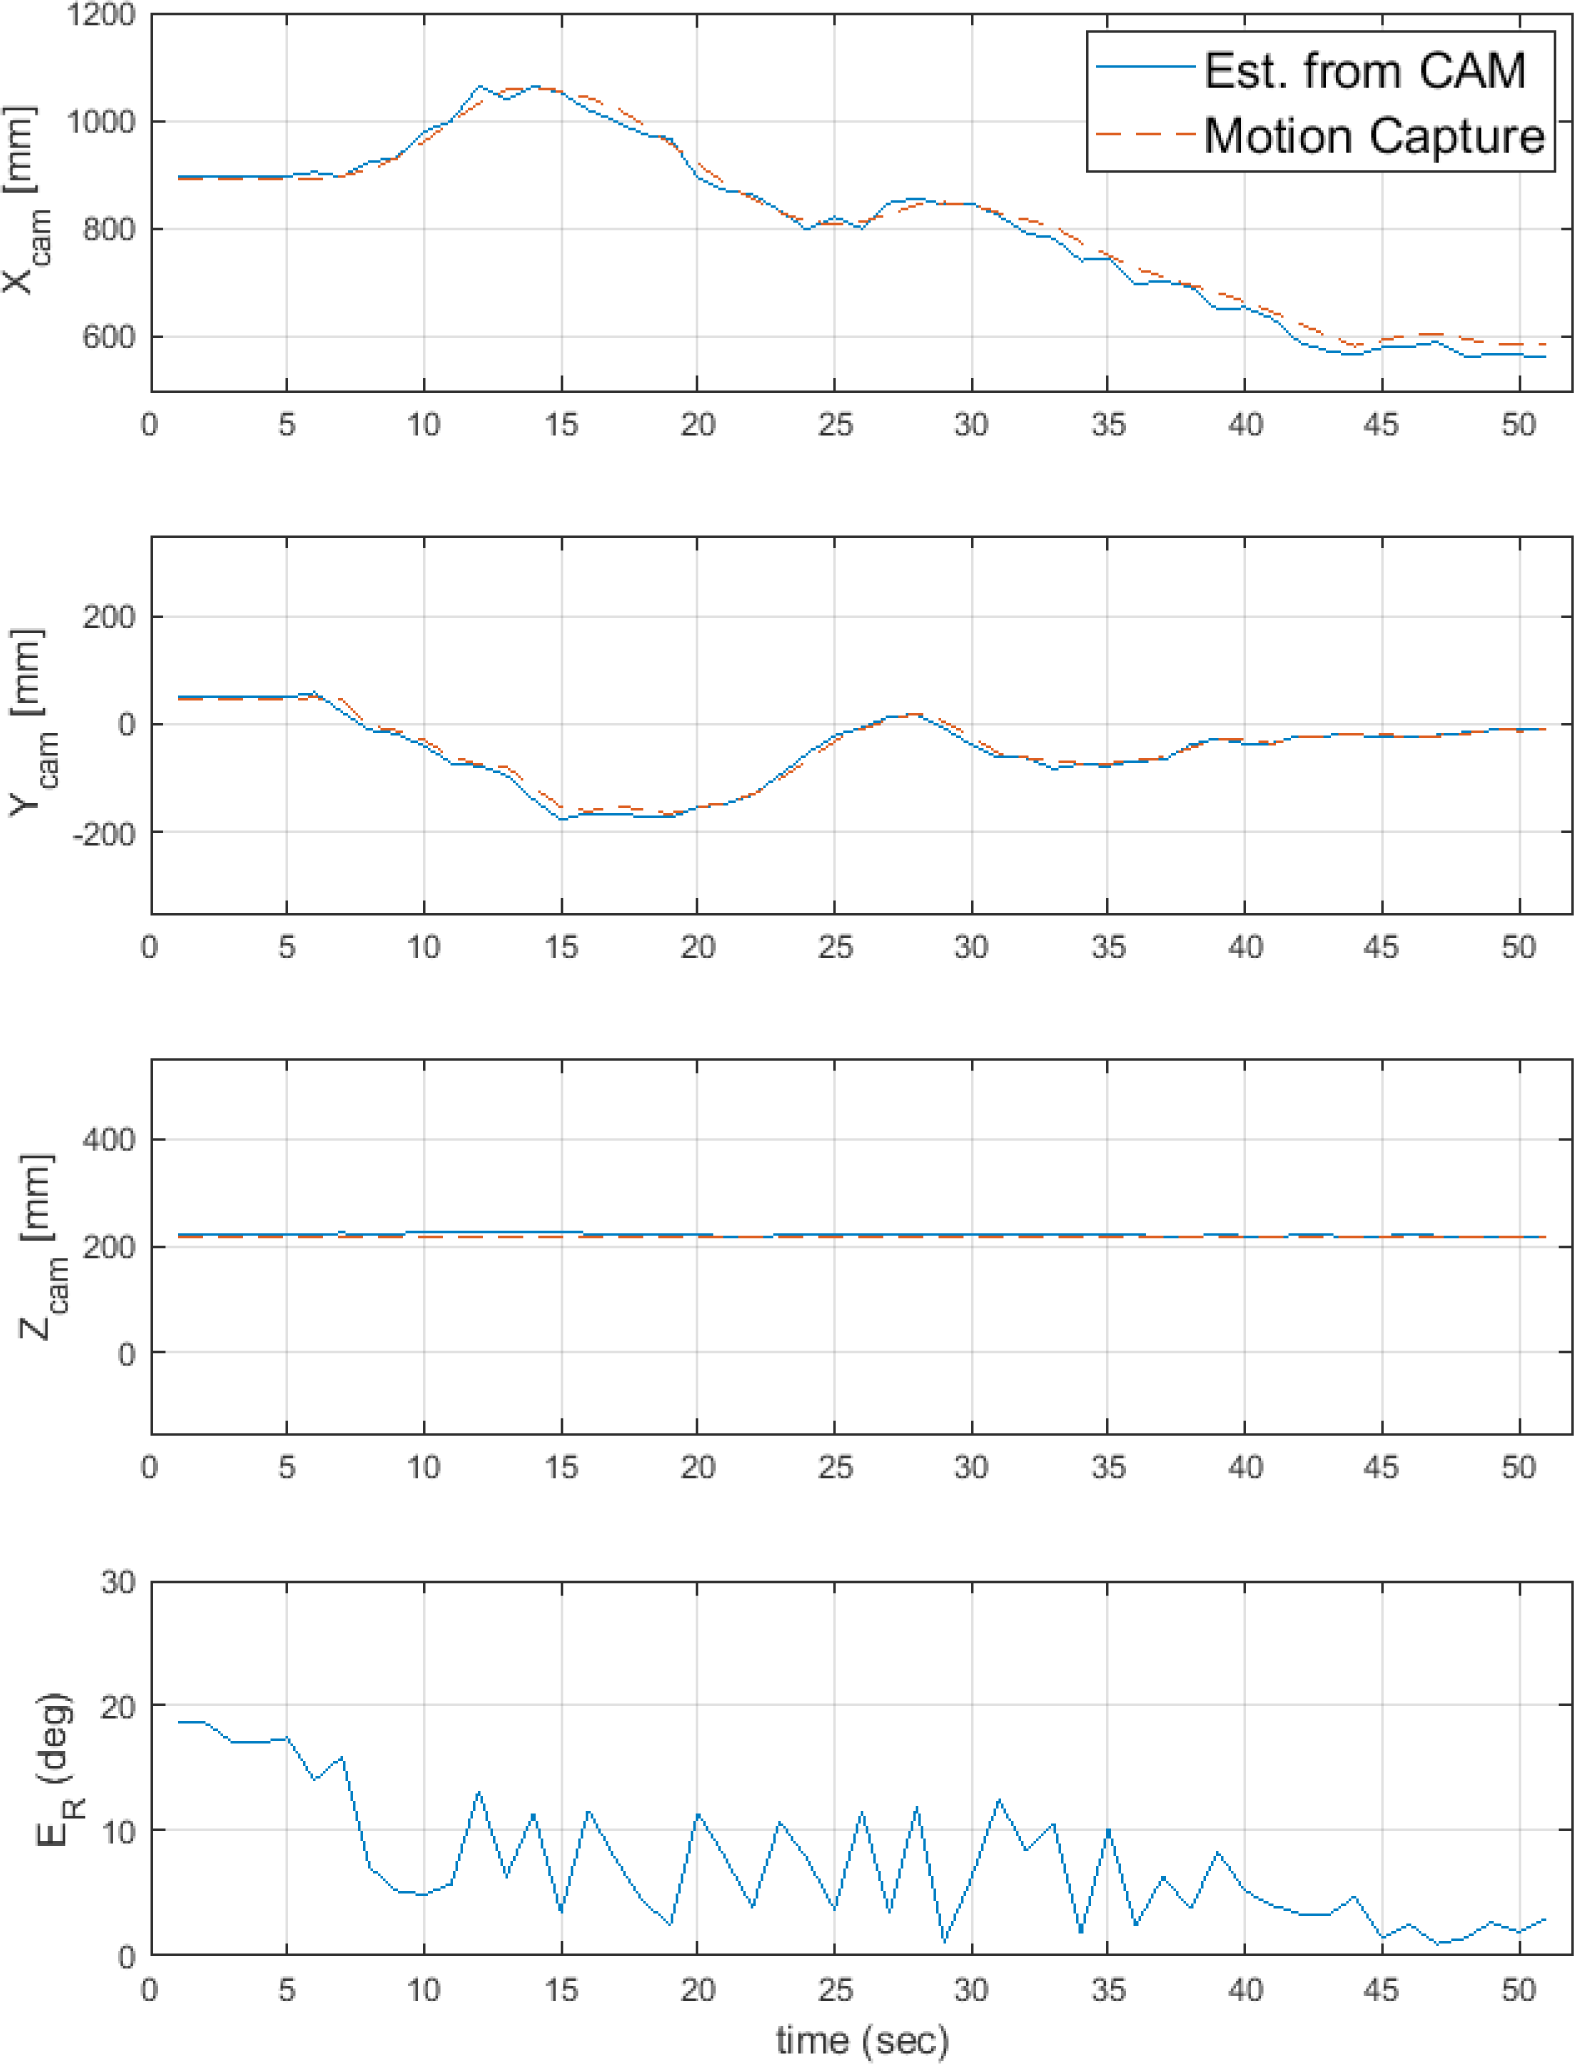
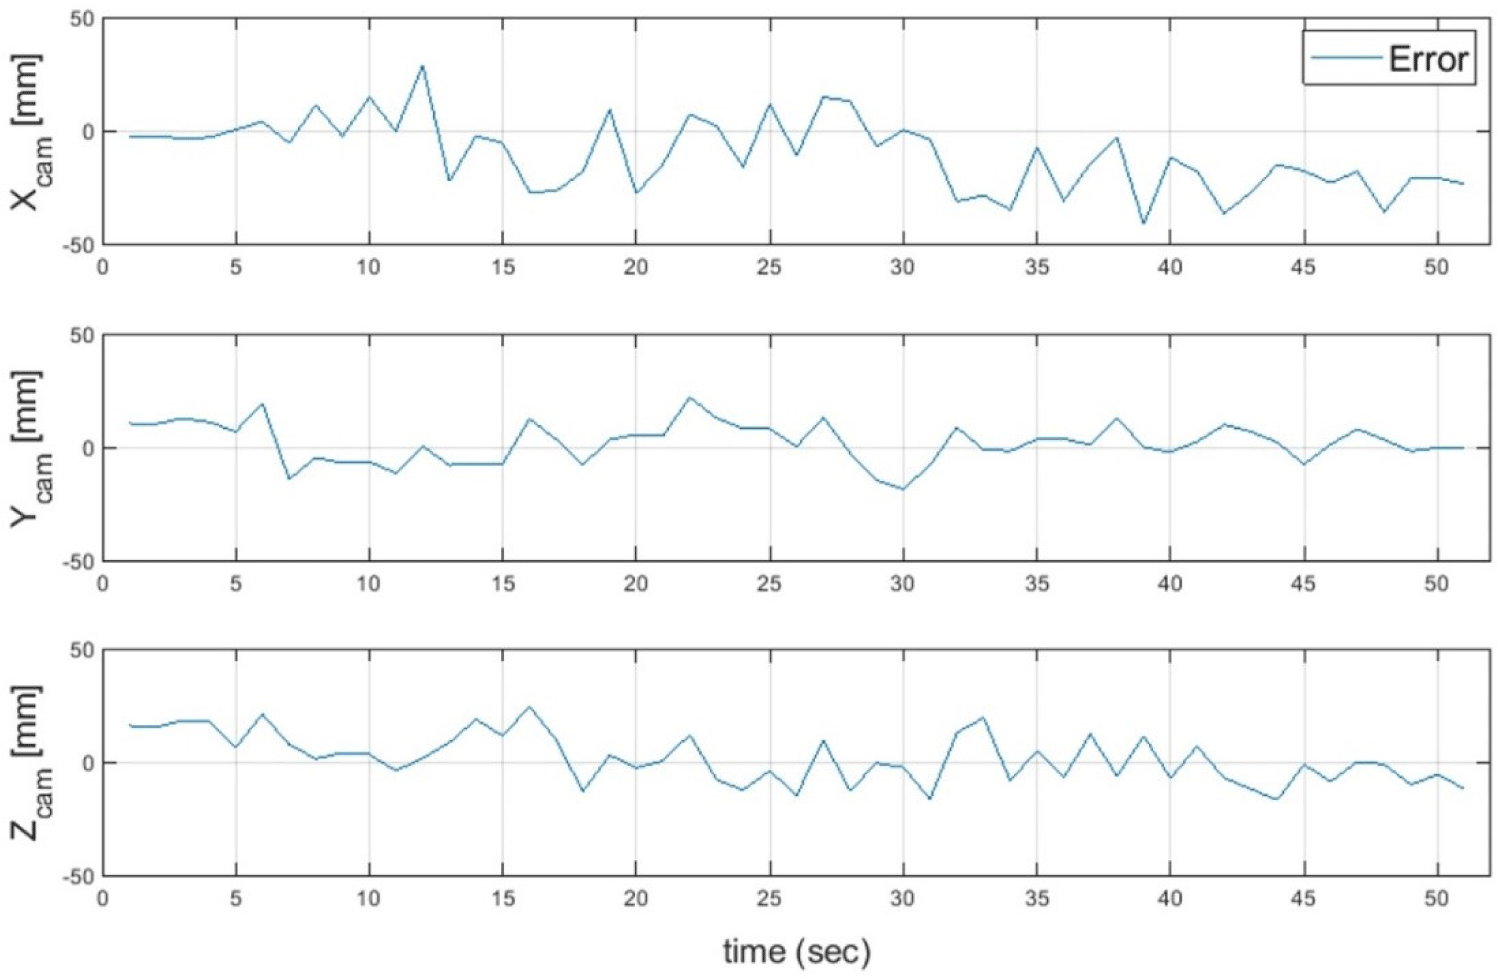
When analyzing the structure of the two simulators and docking ports, as shown in Fig. 13, the horizontal distance () among the requirements for docking is 605.0 mm and the orientation accuracy requirement (θ) is 2.1° from the camera. In addition, the rotational accuracy requirement of the target simulator (∅) was 5.4°. The absolute orientation error in the hardware experiment when approaching within 605.0 mm was 2.44°. The orientation error results slightly exceeded the docking requirements. The image on the right side of Fig. 13 shows the movement path of the simulator during the hardware experiments. ASTERIX was photographed with landmarks. The OBELIX was moved using an external force. The red point is the starting point of the movement, and the X mark indicates the end point of the movement. Fig. 14 shows the position and orientation errors according to the relative distance and draws a trend line. As the relative distance increased, both the position and orientation errors tended to increase. Fig. 15 compares the X-, Y-, and Z-axis position prediction results with the actual values and shows the orientation error. Fig. 16 shows the graph obtained by subtracting the actual value from the predicted value of the relative position vector. For the relative position prediction results, the overall tendency was consistent even when the distance changed. In the case of the X-axis, when it was far, the predicted value was somewhat larger or smaller than the actual value; however, when it was approximately 70 cm, the predicted value continued to be smaller than the actual value. In the case of the Y-axis, the error was somewhat large when the X- and Y-axis distances were long but did not converges close to the actual value when they were close. In the case of the Z-axis error, the error value increased when the distance was long and converged to the actual value when it is close.
In Fig. 15, the orientation error decreased as the distance decreased. When the distance was small, the resolution increases accordingly. In addition, the overall result tended to be unstable because it was sensitive to landmark coordinate errors in the image.
Table 2 summarizes the time spent on the calculation and communication processes of the hardware experiments. The average time required to estimate the landmarks of an image using deep learning was 0.2471 s. The average time required to transfer the estimated landmark to MATLAB, predict the pose, transfer the predicted result value to the simulator computer, and store it was 0.0184 s. The average total time spent on deep learning operation, data transmission, and pose prediction was 0.2656 s. The time required for deep learning operations accounted for 93% of the total processing time.
| Processing list | Time (seconds) |
|---|---|
| Landmark estimation using deep learning | 0.2471 |
| Data transmission/reception and pose prediction | 0.0184 |
| The total process | 0.2656 |
Table 3 presents the results of the comparison between the software simulation and hardware tests. To accurately compare the results, 51 synthetic images with the same relative distance as in the hardware experiment were created, and the image noise variance was 0.01. For the distance errors, the software simulation was 17.61 mm, and the hardware test was 23.84 mm. The orientation errors are 6.89° and 7.47°, respectively. For the software simulation, the distance error were 73.87% and 92.24% of the hardware test. The X-, Y-, and Z-axis position errors of software simulation was [13.35 mm 3.21 mm 8.83 mm] and the hardware experiment result was [16.85 mm 7.17 mm 9.75 mm]. The order of the size of the errors was the X, Z, and Y-axis. For the X-, Y--, and Z-axes, the orientation errors of the software simulation were [0.5513° 3.4875° 5.4101°] and those of the hardware experiment were [0.6526° 2.9342° 6.3758°]. The error in the z-axis direction was the largest, and the order of the error sizes was the same for Y and x-axes.
The position error in the x-axis direction is the largest because it is the camera’s gaze direction; therefore, it is estimated by the size of the target (distance between landmarks) and not by direct distance information. In addition, the orientation error in the Z-axis direction was large, because the simulator with the camera rotated along the Z-axis and moved horizontally (Y-axis). Therefore, it is necessary to estimate the values of the two variables simultaneously to estimate the orientation along the Z-axis. In addition, the arrangement of the landmark numbers in Fig. 3 indicates that, when rotated on the Z-axis, there appeared a situation wherein the landmarks 3, 4, 7, and 8 were arranged approximately as a straight line. Therefore, the 2D landmarks of the corresponding number overlap, and the orientation prediction error of the Z-axis increased according to the landmark coordinate estimation error.
Comparison of the software simulation and hardware test results, indicated the former as being more accurate. This is because the training and test images were synthetic images generated in the same virtual environment and had the same noise. The real image from the hardware test had a relatively large estimation error, because the generation environment and noise values were different. However, the size tendency of the errors by axis was consistent and the overall average error size was similar. Therefore, a deep learning model trained using synthetic images generated in a virtual environment can be applied to real images. In addition, when a virtual environment, such as a real environment, is implemented and software simulation results are obtained, the actual hardware experimental results can be predicted from the results.
As a result of comparing the software simulation and hardware experiments in this study, the size and tendency of the pose-estimation errors were almost similar. Therefore, we predict that the results of actual experiments in real space will be similar to those of the software experiments conducted in this study.
We used real images captured with a camera in a hardware experiment as test data. Therefore, estimating an accurate noise value was challenging because it varied depending on the camera settings and lighting environment. In addition, image analysis using deep learning is difficult owing to the increase in the noise in the image (Nazaré et al. 2018). Therefore, we analyzed the hardware experimental results by adding different levels of noise to the training images. We input noise by dividing it into five stages, and compared the pose errors in each case. Consequently, the effects of image noise used for deep learning training were summarized and analyzed.
Image noise refers to a phenomenon such as noise in the background within a signal obtained from an image captured by a camera. The noise values were expressed as mean and variance, and we set only the case where the average was 0. In this study, as gray images were used, zero implied that gray noise was added to the picture; however, the overall brightness did not change. Variance implies the magnitude of gray noise, thus when the variance was 0, there was no noise. As the noise increased, the magnitude of the noise increased. The noise of the training image was divided into five stages and applied to the hardware experiment.
We input gray noise into the image using a MATLAB function. The average gray noise was fixed at 0, and the variance values were set to 0, 0.001, 0.01, 0.1, and 1. It was confirmed that the higher the noise variance value, the lower the image quality. Five deep learning models were individually trained using these images. In addition, 150 real images generated by additional hardware experiments were input into the deep learning model to estimate the landmark. Consequently, the pose error between the camera and simulator was calculated using a weighted NLS method. Finally, the tendency of the error according to the gray noise variance of the training image was analyzed.
Table 4 lists the average position and attitude errors of the 150 real images according to the noise of the training images. In the absence of noise (variance 0), and when the noise was large (variance 1), both the position and orientation errors were relatively large. The position error was the smallest when the noise variance was 0.001. In addition, the orientation error was smallest when the noise variance was 0.1. When the noise variance was 0.1 or less, the estimation errors were similar. Therefore, to apply the deep learning model to a real image, noise less than 0.1 must be added to the synthetic image for training.
| Noise variance | Position error (mm) | Orientation error (°) |
|---|---|---|
| 0 | 70.27 | 19.38 |
| 0.001 | 31.94 | 11.54 |
| 0.01 | 33.98 | 12.27 |
| 0.1 | 36.98 | 9.68 |
| 1 | 402.81 | 43.58 |
4. SPACE ENVIRONMENT SIMULATION
The final goal of this study was to automatically dock rendezvous and remove space debris using visual data. Thus, the pose of the target must be predicted accurately, even in the absence of a visual sensor or pattern on it. Therefore, deep learning, which does not require a specific sensor and can be used with various backgrounds, was employed for visual data analysis. Because obtaining many real images captured in space is difficult, Thus, we implemented a virtual environment that simulated a laboratory and flight test bed. We then trained a deep learning model using the generated synthetic images. In addition, it was verified that the deep learning model trained with only synthetic images could be applied to a real image through comparisons of the results of the software simulation and hardware test.
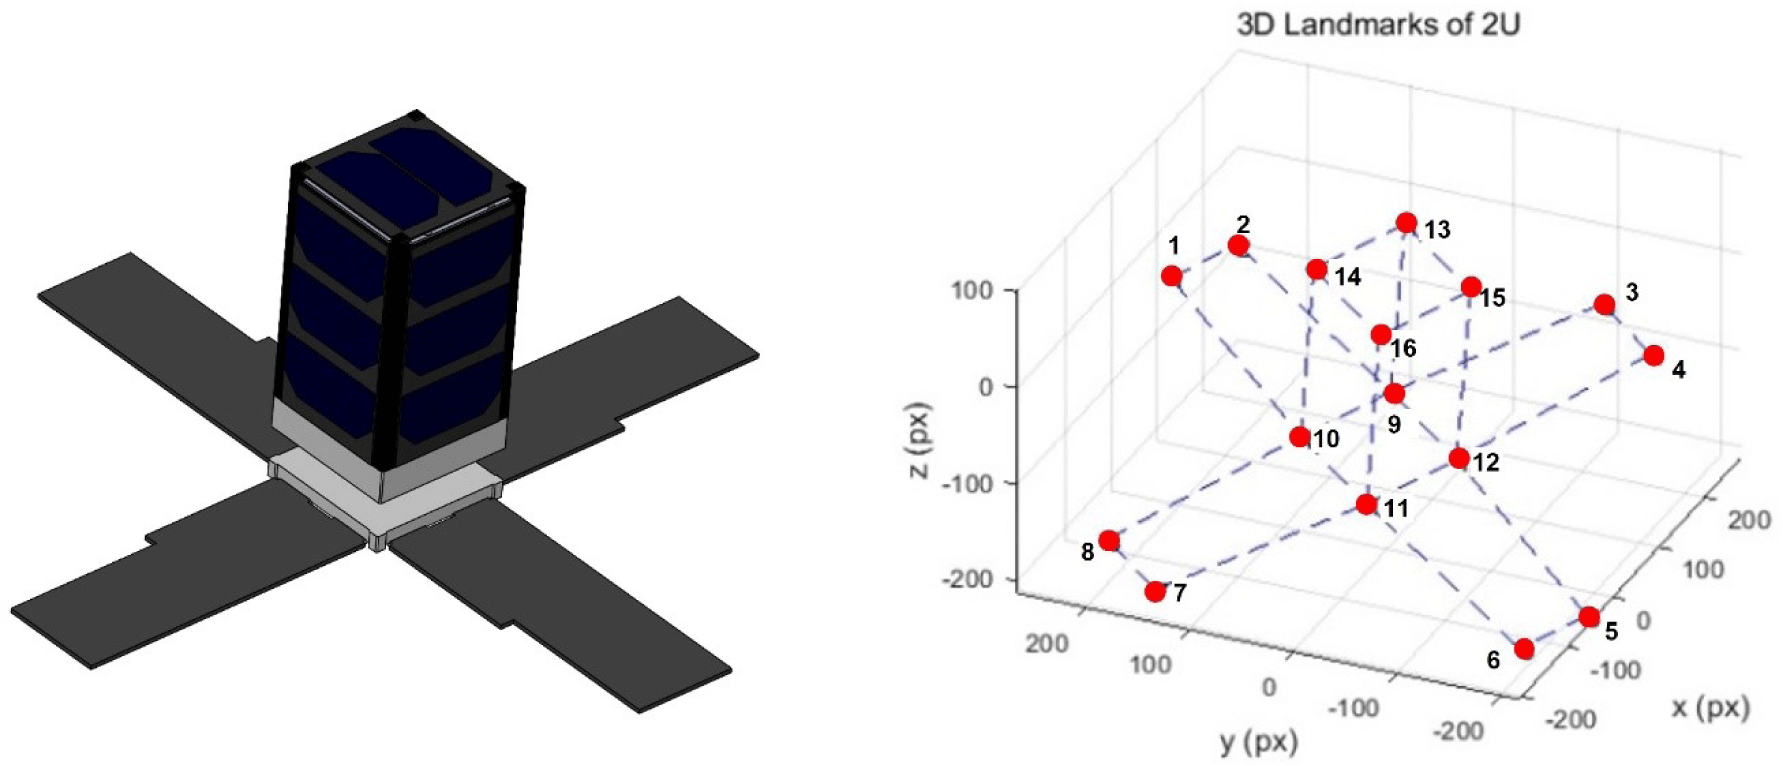
The satellite model used was Pumbaa, a 2U-sized satellite from the CANYVAL-C mission (Kim et al. 2019). As shown in the left image in Fig. 17, the 3D coordinates of the 16 vertices representing the geometric characteristics of the spacecraft were recorded by setting the geometric center of the spacecraft as the origin. In addition, numbers 1–16 were assigned to each landmark. Landmarks 1–8 in Fig. 17 represent the vertices of the spacecraft solar panel, and landmarks 9–16 correspond to the vertices of the satellite’s rectangular parallelepiped body. In addition, the landmarks and shapes of the satellite were displayed using MATLAB, as shown in the right image of Fig. 17.
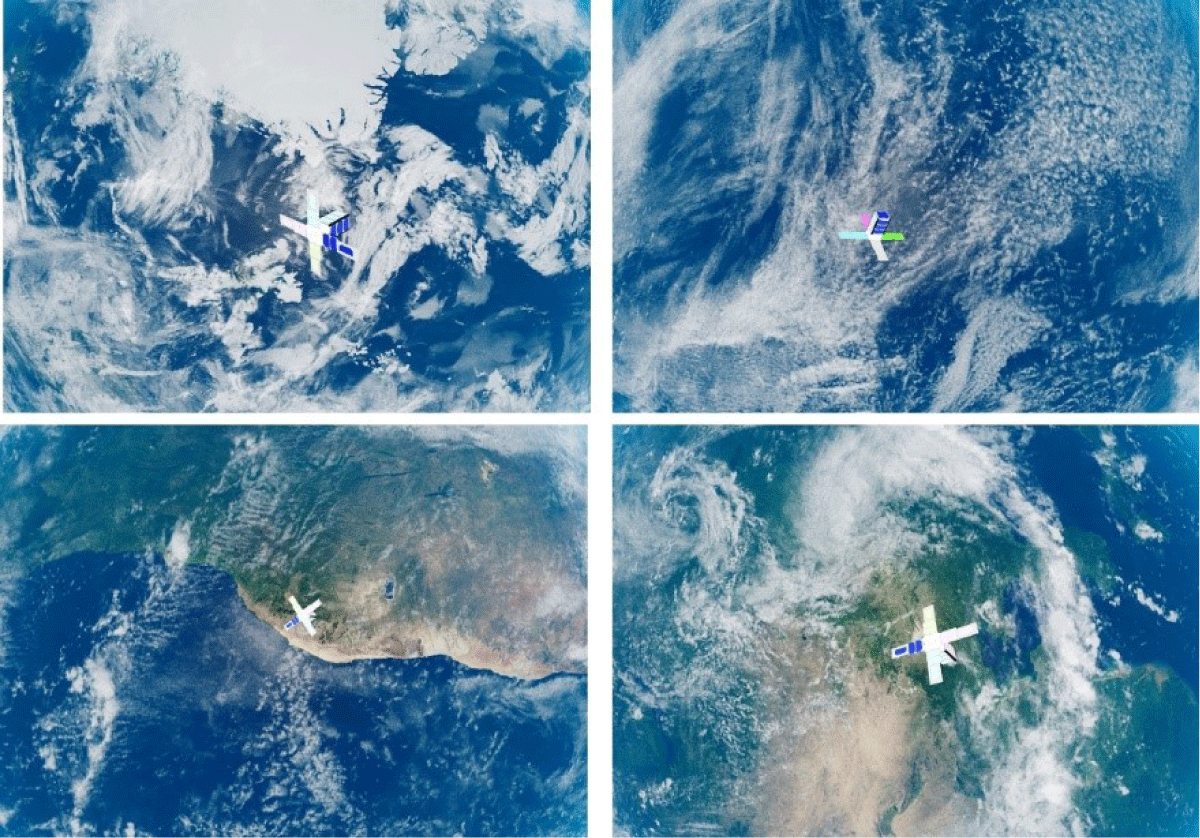
The spacecraft’s 3D CAD model was inserted into UE4. Because the existing model had the same color on the four sides of the solar panel and body, we eliminated symmetry by painting the sides of the solar panel and body in different colors. We assumed that a camera was attached to another spacecraft and considered this as an observation spacecraft, or simply a camera. We also constructed the Earth model and lighting environment to generate images of the spacecraft orbiting the Earth’s low orbit (Unreal Engine, 2020). It was assumed that the spacecraft orbited at an altitude of 780 km. The lighting conditions were set to 20 lx in the simulation, assuming that the actual solar light on Earth was 120,000 lx and that the shutter speed of the camera was 1/6,000 s. In addition, the light reflected from the Earth was set to 6 lx, considering the Earth’s albedo.
Herein, 4,000 images were created by setting each image to have random positions and rotations within the range, and the location and rotation of each image were recorded. The position and gaze direction of the camera were fixed along the direction of the Earth’s center. The relative distance between the camera and the satellite was 1–10 m along the direction of the camera’s gaze, and 0.3–3 m along the vertical direction of the camera’s gaze. This ensured that the entire image of the satellite could be observed in the background of the Earth. In addition, the satellite’s rotation was set to have a random value within ± 80° based on the absolute coordinate axis for each axis, and the its rotation quaternion was recorded for each image. The size of the image captured by the camera was set to 1,280 × 960 pixels, the viewing angle was 90°, and the focal length was set to 640 mm. Fig. 18. shows the image sample generated in this manner. Earth, which was the background, was made to show random sides for each image.
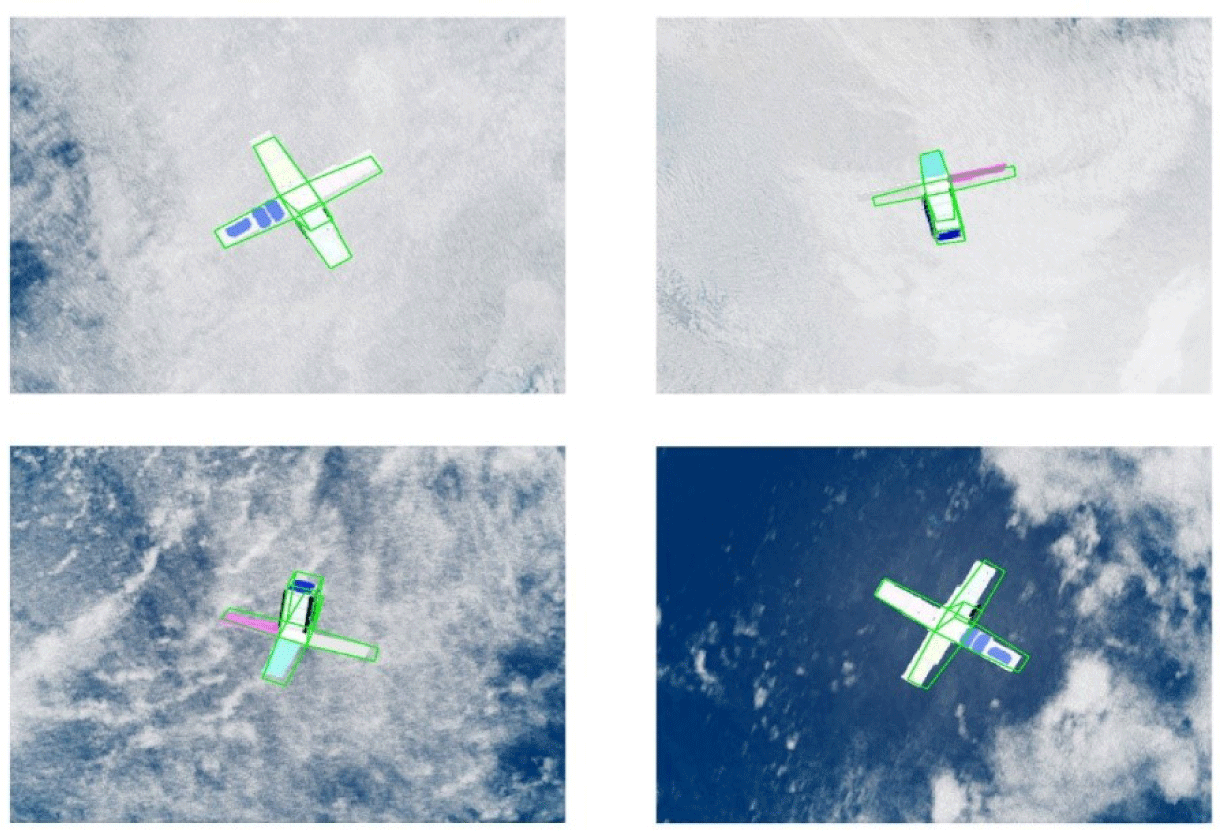
HRNet was used as the deep learning model. The size of the image was reduced to 256 × 192, and the model parameters were set to be the same, except for the color image. Of the total 4,000 data points, 3,600 (90%) were used as data for training the deep learning model. The remaining 400 (10%) were used as test data to estimate the 2D landmark coordinates and predict the pose of the target satellite. The pose was calculated from the landmark coordinates using the nonlinear least-squares method. The position error Was also calculated as a ratio (ET), which is the difference between the actual distance and the prediction divided by the actual distance: . By calculating the poses of 400 verification data points, the distance error (ET) was 0.044 m, position ratio () was obtained as 0.86%, and orientation error (ER) was 11.11°. Fig. 19 shows the final estimated landmark coordinates on the cropped spacecraft images (green lines).
For the 400 verification data points, we drew a graph to analyze the pose error according to the relative distance between the observation and target spacecraft. The average and standard deviations of the pose errors were calculated based on the relative distance. The mean and standard deviation were calculated using 100 data each in 1 m units for 3–10 m. For the data used in the result analysis, the relative distance was fixed at 1 m, and the orientation was randomly set. A total of 100 new test data points were generated at 1 m intervals, landmarks were estimated using the trained deep learning model, and the pose was predicted. Fig. 20 shows the mean and standard deviation (3σ) for each relative distance. The graph on the left shows the relationship between the relative distance and the distance error. The error increased rapidly from a relative distance of 6 m. The graph on the right shows the relationship between the relative distance and the orientation error. The orientation error rapidly increases from a relative distance of 5 m.
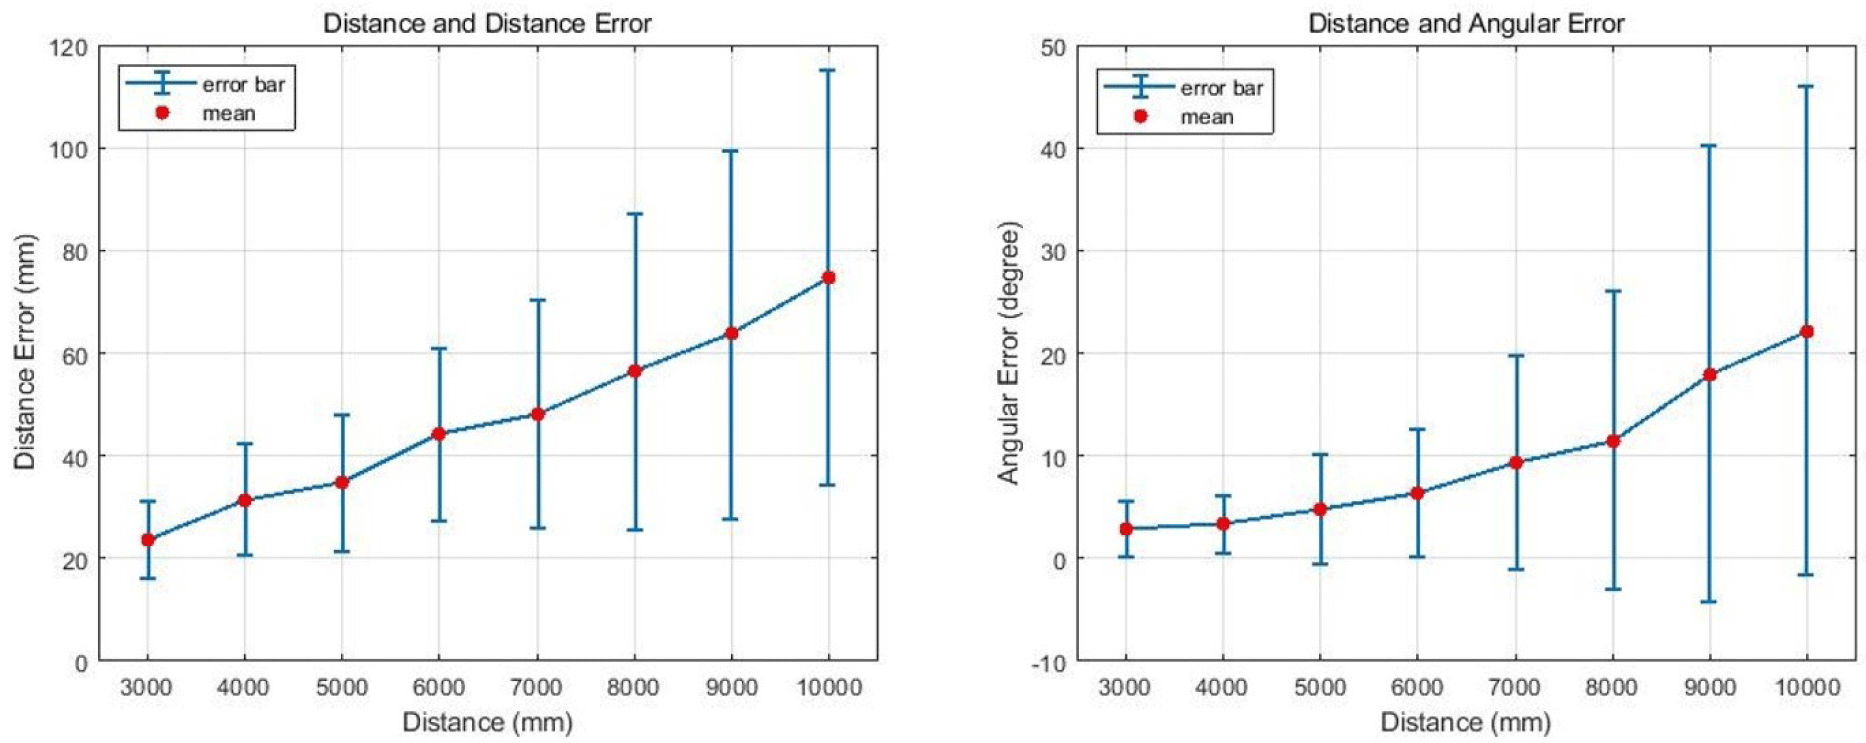
When comparing the software simulations and hardware experiments conducted in this study, the errors were similar. Therefore, the error tendency can be predicted based on the relative distance when using a 2U-sized spacecraft. In addition, we propose that the distance limit condition for obtaining stable results within relative distance error of 70 mm and 20° posture error is approximately 4 m.
Table 5 presents a comparison of the results of our study with other spacecraft pose estimation results. Proença & Gao (2019) used deep learning model ResNet50 and simulated UE4 to generate synthetic images of 7.48 m-size spacecraft called Soyuz. The total number of images for training was 4,500. When the color image resolution was 320 × 240, the distance error was 1.6 m and the orientation error was 24.9°. Sharma & D’Amico (2019) introduced spacecraft pose network (SPN) to estimate the pose and SPEED. They used a 1.30 m-size Tango as spacecraft model and trained the SPN with 12,000 gray images. For the resized 224 × 224 pixels, the distance error was [0.055 0.046 0.78] m and the orientation error was 8.4254°. Considering the amount of training data and relative distance, our study produced good results for both distance and orientation errors. This is because the HRNet is an optimized model for identifying key points (Sun et al. 2019). In addition, Proença & Gao (2019) directly estimated the pose through deep learning. Sharma & D’Amico (2019) detected a 2D bounding box in an image around a target and estimated the relative distance from the diagonal length ratio. Therefore, estimating the coordinates of the 2D landmark using the least squares method is more accurate than the other methods.
| Proença & Gao (2019) | Sharma & D’Amico (2019) | Ours | |
|---|---|---|---|
| Satellite model | Soyuz | Tango | Pumbaa |
| Deep learning model | ResNet-50 | SPN | HRNet |
| Input image size | 320 × 240 | 224 × 224 | 256 × 192 |
| Color/Gray | Color | Gray | Color |
| Number of training images | 4,500 | 12,000 | 3,600 |
| Satellite size | 7.48 m | 1.30 m | 0.30 m |
| Distance range | 10–40 m | 3–50 m | 1–10 m |
| Distance error | 1.6 m | [0.055 0.046 0.78] m | 0.044 m |
| Orientation error | 24.9° | 8.4254° | 11.1° |
5. CONCLUSIONS
This study developed an algorithm for estimating the relative position/rotation (pose) between a spacecraft and a camera from images. For actual space utilization, virtual images were created to build an estimation system, which was verified through hardware experiments. Image analysis using deep learning is applicable even when a specific sensor or pattern is not attached and the background is complex. To compare the software simulation and hardware experimental results, a virtual environment simulating a laboratory was implemented and artificial images of the observed objects with various relative positions and postures were generated. The relative pose of the object was predicted based on the nonlinear least-squares method using the estimated landmark coordinates. Further, hardware experiments were performed, and the algorithm was applied to actual images for comparison with software simulations under the same relative distance conditions. This study verified that a real-time relative pose estimation system could be constructed and applied to actual images using a deep learning model trained with virtual images. It was shown that the results of the hardware experiment could be predicted from the software simulation owing to the estimation error results of the software simulation and the hardware experiment being similar. Software simulations of spacecraft images orbiting the Earth were also conducted to predict actual estimation errors and propose a distance range to which algorithms could be applied. This work can contribute to pose identification during automatic rendezvous and docking experiments using a testbed.