1. INTRODUCTION
Solar magnetic fields are formed from a combination of the internal convection of plasma and differential rotation. The plasma-filled Sun has different rotational speeds depending on the latitude. This differential rotation pulls and pushes the internal plasma, forming a magnetic field. This magnetic field becomes twisted and complicated, which drives the various magnetic phenomena on the solar surface and atmosphere.
The solar activity indicates variations or phenomena related to the solar magnetic field. The strength of the magnetic field varies periodically or transiently. This variation in the solar magnetic field leads to various solar activities, including sunspots, solar flares, prominences, coronal mass ejections, solar winds, and the eruption of solar energetic particles.
The sunspot number (SSN), an index representing solar activity, increases and decreases every 11 years, called the solar cycle (sunspot cycle and solar activity cycle). The 11-yr cycle of the SSN was first recognized by Schwabe (1843). Rudolf Wolf analyzed the past sunspot data to study the solar cyclic variations and prepared a formula to count the SSN systematically. Following Wolf’s tradition, 1755–1766 was defined as the first solar cycle. During the 11-yr cycle, the solar maximum and minimum are when the SSN is at its maximum and minimum, respectively. The solar activity is strong and weak at the solar maximum (sunspot maximum) and minimum (sunspot minimum), respectively. Each solar cycle contains the time from the solar minimum to the following minimum.
The amounts of radio, extreme ultraviolet, and X-ray radiation increase significantly at the solar maximum. Solar magnetic activity, represented by sunspots, is an important factor in space weather and determining the corona and solar wind characteristics.
The solar, interplanetary, and geomagnetic (SIG) parameters include the solar activity index, solar wind speed, density, interplanetary magnetic field (IMF), and geomagnetic storms. They are important in explaining the solar-terrestrial interaction (Oh & Kim 2013). They are also helpful for evaluating the status of solar activity and the changes in the space environment. In addition, they are essential for predicting space weather, analyzing the response of the terrestrial magnetosphere, and understanding the complicated solar-terrestrial interaction.
Oh & Kim (2013) analyzed the SIG parameters, including SSN, 10.7 cm solar radio flux, total solar irradiance (TSI), solar polar magnetic field (SPMF), and solar mean magnetic field (SMMF). They showed low values for the SIG parameters during Solar Cycles 23–24 and suggested that a reduced solar magnetic field caused these weakened SIG parameters. In addition, they reported that this period showed decreased solar activity compared to the previous solar cycles. They warned that this trend may indicate the onset of a grand minimum, such as the Maunder Minimum, which manifested as markedly low solar activity.
Adhikari et al. (2019) explained that solar activity shows different variations in each solar cycle, and the solar activity in Solar Cycle 24 was remarkably lower than in previous solar cycles. They suggested that the magnetic structure that erupted from a large sunspot group drove the geomagnetic storm, and the magnitude of solar activity determined the effectiveness of space weather near the Earth. In addition, they suggested that future solar activity maintain a lower level than the present.
Nandy (2021) reported the results of the prediction on Solar Cycle 25, which were performed by various research groups using various prediction methods, including the surface flux transport and machine learning model. The maximum SSN was predicted to be in the range of approximately 135–146, and the maximum solar activity was forecasted for the period of 2024–2025.
Xu et al. (2024) made a promising achievement in predicting the solar cycle using the hybrid model to combine the seasonal autoregressive integrated moving average (SARIMA) model and random forest. This hybrid model can provide a more precise prediction than the previous statistical model. It predicted that solar activity in Solar Cycle 25 would be stronger than in Solar Cycle 24 and reach the solar maximum in 2025. In September. 15, 2020, the National Aeronautics and Space Administration (NASA) declared the start of Solar Cycle 25 to be December 2019 (https://www.nasa.gov/news-release/solar-cycle-25-is-here-nasa-noaa-scientists-explain-what-that-means/).
The solar cycle significantly affects space weather on the Earth. Accordingly, monitoring satellites, air traffic, and electrical grids has become important. The solar magnetic field plays an important role in analyzing the effects on the Earth and other planets and contributes to solving various problems related to the space environment. In particular, monitoring and predicting the solar magnetic activity continuously is essential to protect satellites, communication systems, and electrical grids. Since solar magnetic activity directly affects daily life, understanding and managing these phenomena have become essential in the space age. As further research on solar magnetic fields progresses, it is expected that the accuracy of solar activity predictions and the safety from catastrophic changes in the space environment will be enhanced.
Therefore, this study analyzed the solar cyclic variation of SIG parameters over 51 years from 1974 to 2024 and evaluated the prediction on Solar Cycle 25 using the statistical forecasting model. This study also included three main research topics.
-
To evaluate the trends and relationship between the SIG parameters by analyzing the variations in the SIG parameters over 51 years. To understand the trend of variation for SIG parameters according to solar cycles.
-
To compare the solar cyclic variations of the SIG parameters at the solar maxima and minima.
-
To predict the variation of solar activity in Solar Cycle 25 based on the variation of SIG parameters in Solar Cycles 21–24.
2. DATA AND METHOD
This study analyzed the various SIG parameters from 1974 to 2024 and the interrelationships between each SIG parameter. Table 1 describes the data used. The table consists of the data used, the start year of the measurements (indicated below the data), and the provider. Most of the SIG parameters include data up to December 2024. This study used the ten SIG parameters analyzed by Oh & Kim (2013), as shown in Table 1. The solar flare index (SFI) was also included in this study. The SFI is an indicator of solar flare activity and is used to evaluate the incidence and intensity of flares, which are powerful radiative explosions of the Sun. Kleczek (1952) first introduced an amount calculated by “the intensity measure of a flare × the duration of a flare in minutes” to quantify the average daily flare activity over one day. He hypothesized that this relationship provides the approximate total energy that a flare emits. Although it is impossible to measure the total energy of a flare, the flare index can be defined using the white light flare associated with Hα.
| Data (start year) | Reference |
|---|---|
| SSN (1974) | Monthly and yearly: Solar Influences Data Analysis Center (https://www.sidc.be/SILSO/datafiles) |
| SPMF (1976) | Stanford Solar Observatory (http://wso.stanford.edu) |
| SMMF (1975) | |
| X-ray flare (1975) | M-class: NOAA National Centers for Environmental Information (NCEI) (https://www.ngdc.noaa.gov/stp/solar/solarflares.html)http://ftp.swpc.noaa.gov/pub/warehouse/ |
| SFI (1976) | Monthly & Yearly: NOAA NCEI (https://www.ngdc.noaa.gov/stp/solar/solarflares.html) |
| TSI (1976) | Daily composite TSI: Physikalishch-Meteorologisches Observatorium Davos World Radiation Center(htttp://ftp.pmodwrc.ch/pub/data/irradiance/virgo/TSI/TSI_composite/) |
| F10.7 (1974) | Daily OMNIWEB data: Goddard Space Flight Center (https://omniweb.gsfc.nasa.gov/form/dx1.html) |
| IMF (1974) | |
| Dynamic pressure (1974) | |
| Ap index (1974) | |
| GCR intensity (1974) | Daily: McMurdo, Jang Bogo, and Oulu neutron monitors(http://neutronm.bartol.udel.edu/, https://www.nmdb.eu/nest/, https://cosmicrays.oulu.fi/) |
The National Geophysical Data Center (NGDC) defined the SFI as “the importance factor of a flare (i) × the duration of a flare (in minutes)”. The importance factor of a flare consists of the area of the flare (S, 1, 2, 3, and 4) and the brightness of the flare (Faint, Normal, and Bright; Özgüç et al. 2003). This number can be understood as a relative value indicating how frequent and powerful the flare activity was. The SFI data are provided by the data center operated by the National Oceanic and Atmospheric Administration (NOAA).
The galactic cosmic ray (GCR) intensity refers to the flux of high-energy charged particles flowing from outside the Galaxy. GCR particles are composed mainly of particles arising from high-energy celestial events within the galaxy, such as supernova explosions, which flow into the Earth and the solar system across outer space. GCR particles usually comprise protons (~85%) and helium nuclei (~14%), including heavy element nuclei and electrons. The intensity of GCR particles can be measured by observing secondary particles (e.g., neutrons and muons) generated by their interaction with the Earth’s atmosphere, which were detected on the ground. In particular, the changes in GCR intensity reflecting the solar activity can be analyzed using a ground-based neutron monitor. The GCR data of global neutron monitors can be obtained from the data network in NMDB (https://www.nmdb.eu/nest/). This study used the daily averaged data provided by the McMurdo and Jang Bogo neutron monitors. The Jang Bogo neutron monitor took over the observations of the McMurdo neutron monitor in December 2015 (Jung et al. 2016; Jeong & Oh 2022). In addition, GCR data of the Oulu neutron monitor were analyzed as comparative data.
The low-resolution OMNI data set is primarily a 1963-to-current compilation of hourly-averaged, near-Earth solar wind magnetic field and plasma parameter data from several spacecraft in geocentric or L1 orbits. The data have been cross-compared extensively and cross-normalized for some spacecraft and parameters. The daily data of the IMF strength, dynamic pressure, and Ap index are obtained by OMNIWEB (https://omniweb.gsfc.nasa.gov/html/ow_data.html).
The dataset includes SSN (1974), SPMF (1976), absolute SMMF (1975), frequency of X-ray flare (1975), SFI (1975), TSI (1976), 10.7 cm radio flux (F10.7, 1974), IMF (1974), solar wind dynamic pressure (Pdyn, 1974), Ap index (1974), and GCR intensity (1974), as shown in Table 1. The solar cyclic variations and the correlations among these parameters were evaluated by processing the data into monthly, yearly, and three-year moving averages (3-yr ave.). The analysis focused on quantifying the variation rate in SIG parameters at solar maxima and minima, providing a quantitative assessment of the solar cycle trends across different cycles.
The solar activity of Solar Cycle 25 was predicted using the SARIMA model provided by Python as a statistical forecasting model. SARIMA combines an autoregressive integrated moving average (ARIMA) model and seasonal components. ARIMA is useful for predicting time series data. SARIMA is a suitable model for predicting periodic data. The SARIMA model analyzes time series data to identify the trends and seasonality. The autoregression (AR), moving average (MA), non-seasonal part of the data (p, d, and q), and seasonal part (P, D, Q, and m) order were set using autocorrelation function (ACF) and partial autocorrelation (PACF) analysis. The formula of the SARIMA model is as follows (Box et al., 2015).
where p, d, and q represent the self-regression order, difference order, and MA order, respectively. P, D, and Q are the seasonal self-regression order, seasonal difference order, and seasonal MA order, respectively. m represents the seasonal cycle. The prediction was performed using the SARIMA model, and the performance was evaluated by comparing it with actual data.
3. RESULTS
Fig. 1 presents the solar cyclic variation of ten SIG parameters from 1974 to 2024 arranged in the order of (a) SSN, (b) SPMF magnitude, (c) frequency of M-class solar flare, (d) TSI, (e) 10.7 cm radio flux, (f) absolute SMMF, (g) IMF magnitude, (h) dynamic pressure of solar wind, (i) GCR intensity at McMurdo and Jang Bogo neutron monitors, and (j) Ap index. The monthly mean is plotted with a black solid line, and the yearly mean is drawn with a blue bold line. The red bold line indicates the 3-yr running average of the yearly mean. In Fig. 1(b), the red and blue lines indicate the north and south poles, respectively. All SIG parameters showed a good correlation with solar cyclic variation with the SSN, as reported by Oh & Kim (2013). All SIG parameters remained significantly low from Solar Cycles 22–24 and then recovered slightly at an increasing phase of Solar Cycle 25. The SPMF in Fig. 1(b) shows the lowest value at the transition period from Solar Cycles 23 to 24 and then recovered slightly at the solar minimum from Solar Cycles 24 to 25. On the other hand, the GCR intensity has higher values in the solar minima 23/24 and 24/25 than in the past minima, as shown in Fig. 1(i).
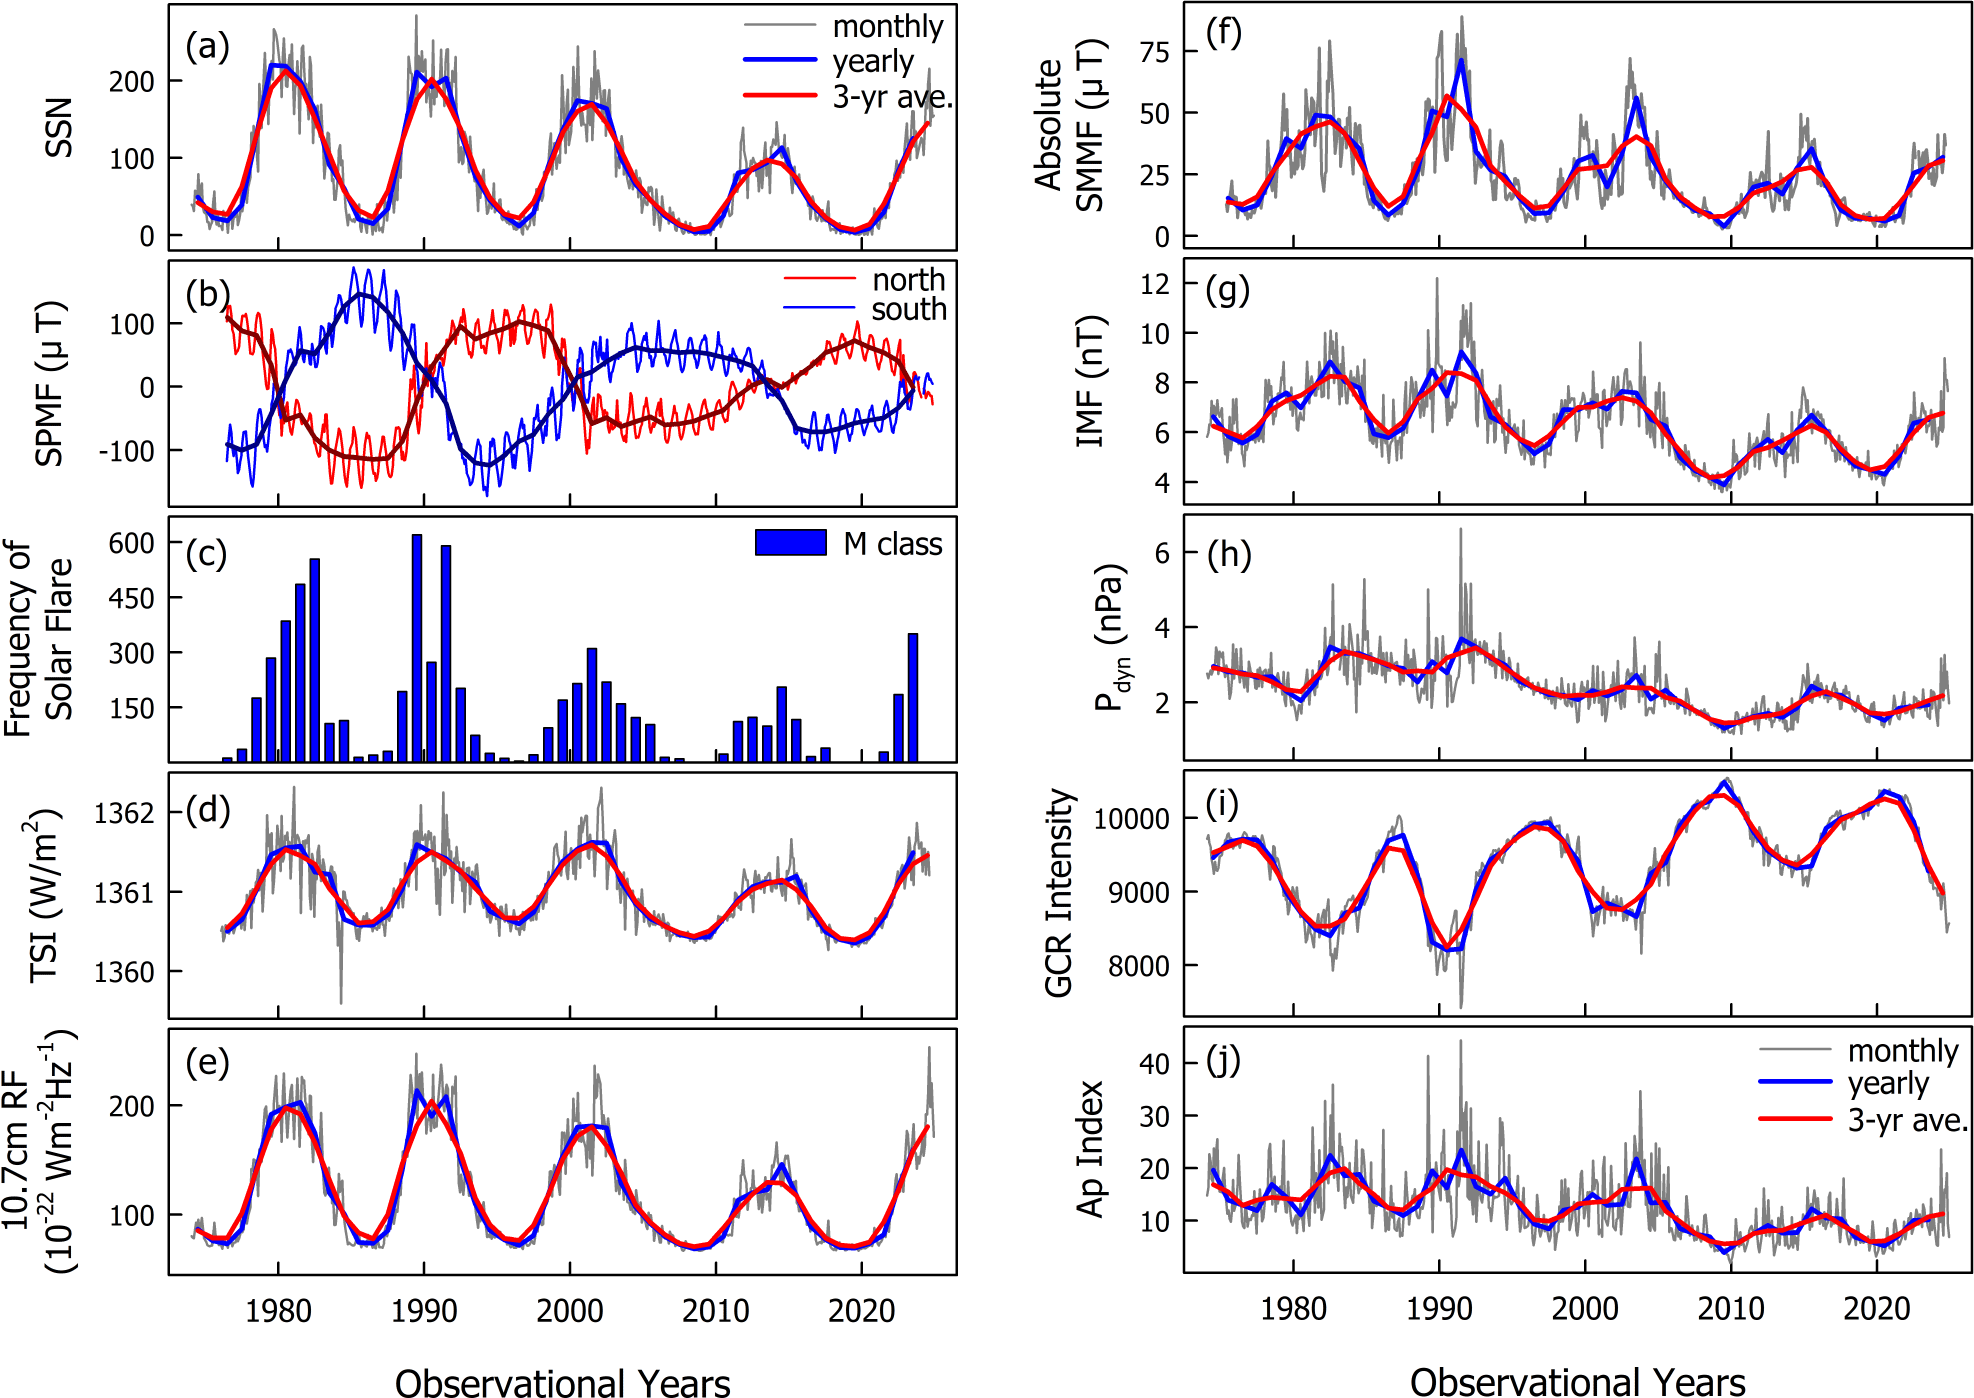
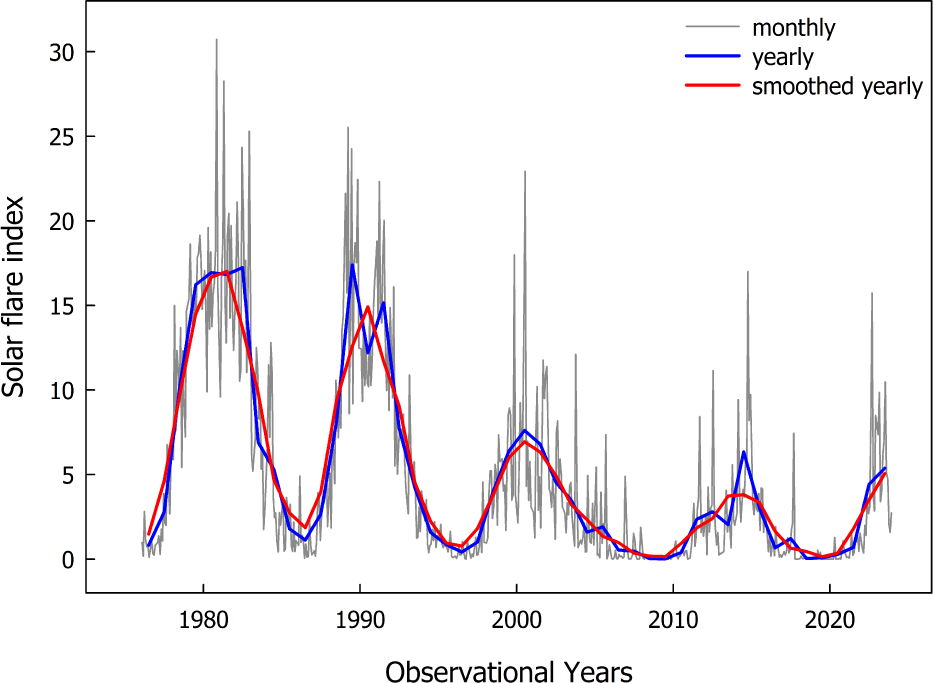
Fig. 2 presents the solar cyclic variation of SFI. The display in Fig. 2 is the same as in Fig. 1. The data also showed a good correlation of the solar cyclic variations with the SSN, the same as the other SIG parameters in Fig. 1. The SFI showed a remarkably low level from Solar Cycles 22–24, and then recovers slightly at Solar Cycle 25.
Adhikari et al. (2019) reported that the SSN, 10.7 cm radio flux, and Lyman α emission showed a lower peak at Solar Cycle 24 than in the previous solar cycles. This observation coincides with the results of the present study.
The variation rate of the SIG parameters at the solar maxima and minima plays an important role in understanding the periodic changes in solar activity. This explains how the SIG parameters change when the solar activity reaches the maximum and minimum. Table 2 lists the start time, end time, and duration of Solar Cycles 21–25 using the three-month running averages.
Table 3 lists the variation rate (%) of ten SIG parameters for Solar Cycles 22–25 at the solar maxima using the yearly averages of the SIG parameters. It compares the SIG parameters between the 22 and 24 solar cycles at the times of solar maxima and * indicates the comparison among solar minima. The solar activity tended to decrease from Solar Cycles 22–24 (Fig. 1), and some SIG parameters showed a significant reduction. A comparison of the solar maxima showed that most of the SIG parameters have the largest decrease in variation rate at Solar Cycle 24 compared to Solar Cycle 22. The GCR intensity showed the largest increase in the variation rate of the McMurdo (Jang Bogo) and Oulu neutron monitors at Solar Cycle 24 compared to Solar Cycle 22. Instead, some SIG parameters (absolute SMMF, SFI, Pdyn, and Ap index) show the largest decrease in the variation rate at Solar Cycle 25 compared to Solar Cycle 22. For the solar minima, the greatest variation rate changes showed a decrease in SPMF and an increase in GCR intensity during Solar Cycle 24 relative to Solar Cycle 22.
In particular, the southern SPMF showed a larger decrease than the northern SPMF. Hence, the solar magnetic activity weakens more rapidly in the Southern Hemisphere, leading to asymmetric changes between the magnetic fields of the Northern and Southern Hemispheres.
Cross-correlation analysis is a method for analyzing the correlation between two or more time series data. Yan et al. (2012) confirmed a strong correlation between the SSN and SFI by studying their periodic interaction through cross-correlation analysis involving SSN, SFI, and solar radio flux. In addition, Mishra & Mishra (2018) reported that the effect of solar activity on GCR intensity appears with a time lag of several months. Cross-correlation analysis evaluated how early or late one-time series data responds to another. Cross-correlation analysis aims to understand the relationship between two data and the change in correlation over time delay.
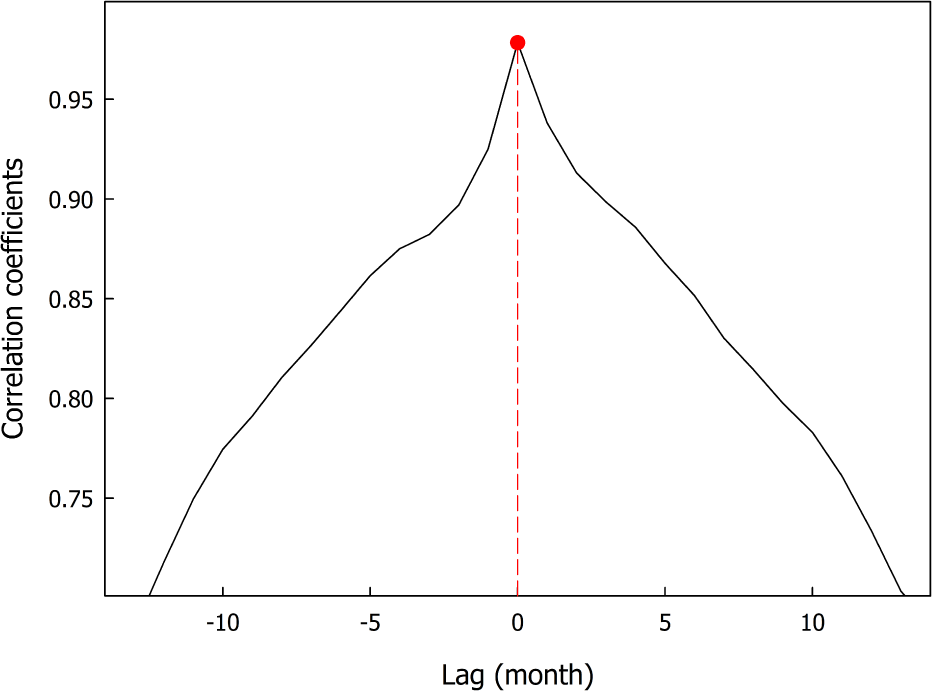
Fig. 3 presents the cross-correlation between SSN and 10.7 cm radio flux with respect to the time lag. The X-axis represents the time lag in months, while the Y-axis indicates the correlation coefficient. When the time lag was zero, the correlation coefficient reached its highest value of 0.9783, showing a strong simultaneous relationship between the two parameters. A positive time lag means that the SSN changes first, followed by variations in the 10.7 cm radio flux. Conversely, a negative time lag suggests that the 10.7 cm radio flux changes first, with the SSN responding later. The correlation coefficient falls below 0.75 as the time lag moves away from zero in both positive and negative directions, showing a continuous decrease. This suggests that the relationship between these two parameters weakens progressively as the time lag increases in either direction.
The relationship between the SSN and TSI plays an important role in understanding the interaction between solar activity and radiation emission. Fig. 4 shows the cross-correlation between the SSN and TSI with respect to the time lag, using the same display format as Fig. 3. When the time lag was +1 month, the correlation coefficient reached a peak of approximately 0.8445, suggesting that the TSI responds with a delay of approximately one month following an increase in SSN. Hence, an increase in sunspot activity may lead to a subsequent rise in solar radiation after a short delay. As the time lag increased to +10 months, the correlation coefficient decreased to approximately 0.725, suggesting that the relationship between the two variables weakens over time. The maximum correlation coefficient at a one-month delay is consistent with Privalsky (2021). Privalsky (2021) reported that it is unsuitable for reconstructing the past TSI to apply simple linear regression with the SSN. Hempelmann & Weber (2012) found that the correlation between the SSN and TSI is strongly non-linear. They interpreted this non-linear relationship as the net balance between brightening by faculae dominating at low activity and darkening by sunspots dominating at high activity. Xu et al. (2017) also examined the phase relationships between the SSN and TSI composite data. They reported that the SSN and TSI are positively correlated with time lags of approximately 29 days, which is approximately a solar rotation period. They also confirmed the nonlinearity between SSN and TSI. The non-linear relationship can be explained by the different behaviors and the effects of sunspots, faculae, and the magnetic network. Therefore, the change in the TSI showed a time lag with the change in the SSN.
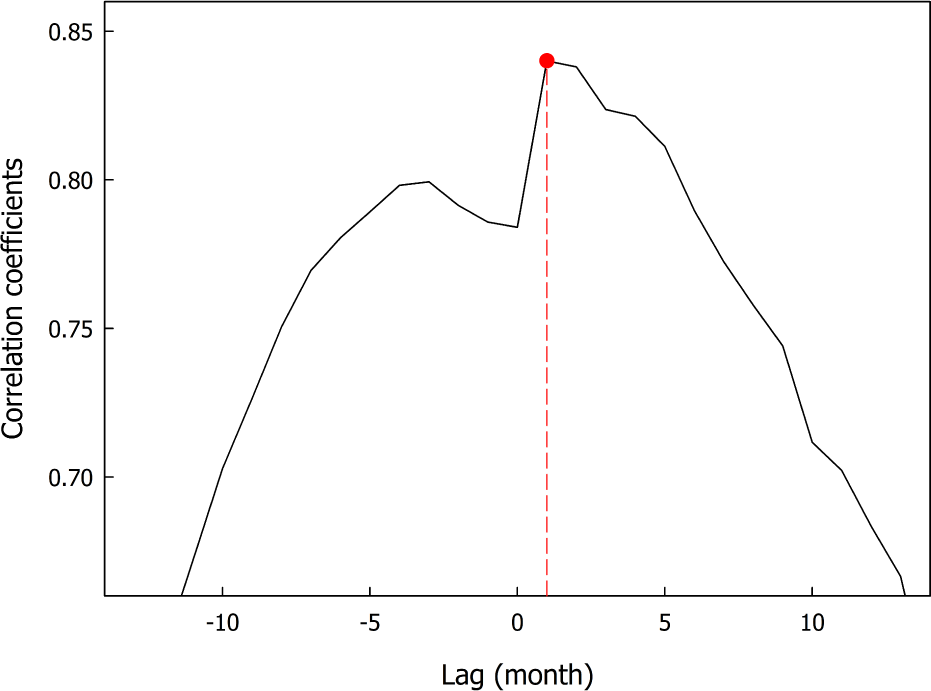
Table 4 lists the maximum cross-correlation coefficients between SSN and other SIG parameters and their respective time lags. The highest correlation coefficients with the SSN are shown for the absolute SMMF after six months, SFI with no delay, and IMF after a delay of four months. The solar wind dynamic pressure and Ap index also showed the strongest correlation coefficients after 12 and 11 months, respectively. The GCR intensity showed the highest negative correlation coefficient after eight months.
NOAA and NASA released the predictions for Solar Cycle 25 from a jointly organized international panel. The panel expects the peak of Solar Cycle 25 to reach July 2025 (± 8 months), and its yearly SSN is predicted to be 115. Compared to Solar Cycle 24, Solar Cycle 25 is expected to proceed with a similar intensity, and the weakening of solar activity is expected to continue in the report of NOAA Space Weather Prediction Center (SWPC; 2020). On the other hand, the monthly SSN for August 2024 was reported to be approximately 216 (the yearly value for 2024 was 155). Hence, the solar activity in Solar Cycle 25 is very active. NOAA/SWPC announced in 2023 that the SSN remained steadily high during 2023, suggesting stronger solar activity than the previous cycle.
A recent study predicted Solar Cycle 25 based on the variation of the solar magnetic field, especially the variations of the SPMF. Solar Cycle 25 was reported to be a relatively strong solar cycle based on the prediction by analyzing the SPMF and geomagnetic index (Penza et al. 2023). In addition, McIntosh et al. (2020) forecasted that Solar Cycle 25 could reach a peak SSN between 210 and 260, suggesting that it may be classified as a particularly strong cycle.
Benson et al. (2020) predicted the SSN by analyzing the SSN data from 1749 to 2019 using a long short-term memory (LSTM) and a WaveNet-based machine learning model. Rodríguez et al. (2022) reported that integrating Fourier transform with machine learning algorithms improves the prediction accuracy compared to conventional forecasting models. These findings highlight the growing importance of Solar Cycle 25 predictions and the application of machine learning techniques in solar cycle analysis.
The SARIMA model explicitly examines the periodicity and periodic variability and allows complex periodic patterns, such as sunspot cycles, to be modeled and predicted. Pandey et al. (2019) used the SARIMA model to predict seasonal and long-term precipitation trends to improve forecast accuracy. Their study revealed the effectiveness of hybrid modeling approaches integrating the SARIMA model for enhanced predictive performance.
The SARIMA model can increase the prediction accuracy by reflecting periodicity. Of course, it is a model suitable for analyzing solar cycles despite the complicated modeling process and the fact that past data may not be sufficiently reflected. In the monthly data, the seasonal cycle (m) of 132 was used to reflect 11 years as the average length of the solar cycle, and the orders were set as follows:
Fig. 5 shows the predicted SSN for Solar Sycle 25 by the SARIMA model using the monthly SSN for 51 years from 1974 to 2024. The blue and orange lines represent the actual and predicted SSN values, respectively, while the shaded region represents the 95% confidence interval of the forecast. The solar activity over the next 36 months (approximately three years) is expected to decrease gradually. In particular, the SSN is expected to decrease continuously after the solar maximum period, reaching a minimum value of 9.42 in October 2028. It is highly likely to enter the solar minimum period around 2030.
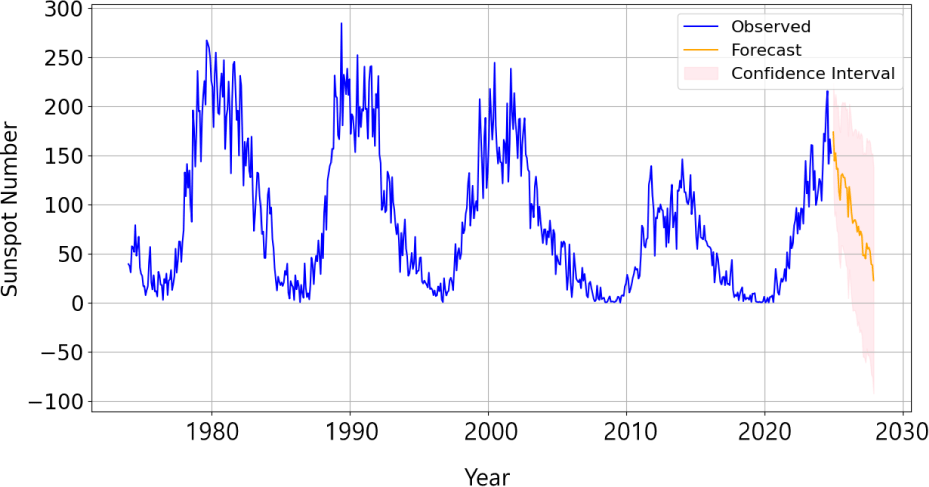
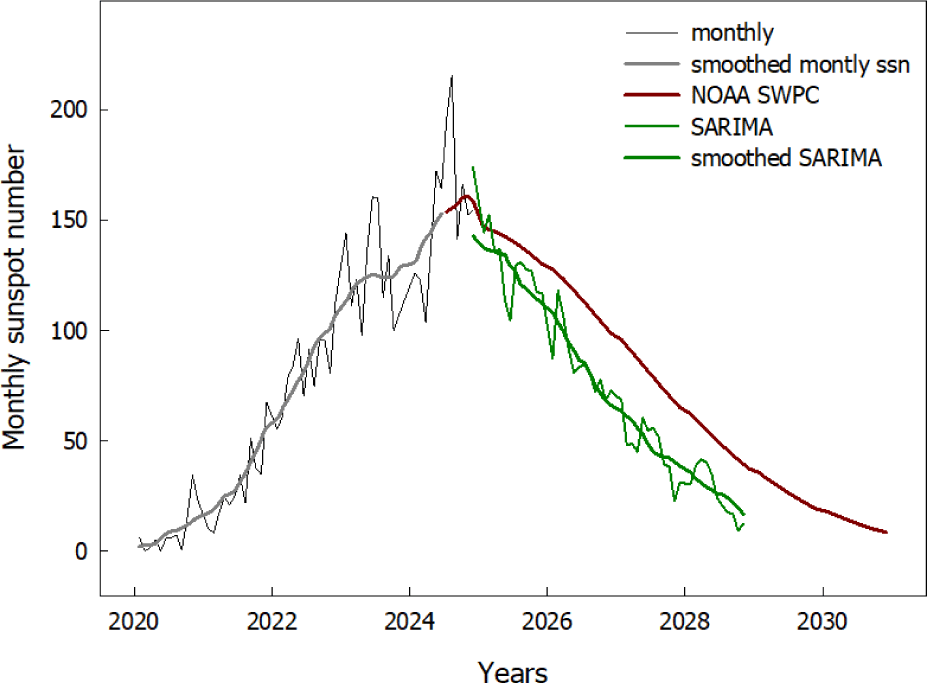
Fig. 6 compares the differences in the SSN prediction between the NOAA SWPC (https://testbed.spaceweather.gov/products/solar-cycle-progression-updated-prediction-experimental) and the SARIMA model during the declining phase of Solar Cycle 25. Notably, the predictions of SARIMA model are consistently lower than those of the NOAA SWPC. This discrepancy might be attributed to the reliance of SARIMA model on linear assumptions, which could limit its ability to capture the complex dynamics of solar activity. This suggests that enhancing the model’s ability to account for non-linear behaviors may improve the prediction accuracy.
4. SUMMARY AND DISCUSSION
This study analyzed the solar cyclic variation of SIG parameters for 51 years from 1974 to 2024. Based on this, the Solar Cycle 25 was predicted using a statistical forecasting model. The results are summarized as follows.
First, as shown in previous studies, all SIG parameters were closely related to the fluctuations in the solar cycle associated with the SSN. The SIG parameters were correlated according to the solar cycle. Most SIG parameters strongly correlated with the SSN when the solar activity was most active. The SSN is a representative indicator of the solar activity. As the SSN increased, most SIG parameters, such as 10.7 cm radio flux, IMF, SFI, TSI, and solar wind dynamic pressure, increased, but the GCR intensity was inversely proportional to the solar activity.
Second, most SIG parameters showed a general weakening trend toward Solar Cycles 22–24. This suggests that the solar activity waned over time. The SPMF showed a large change in the north and south poles in the Solar Cycle 24. In particular, the southern SPMF weakened more rapidly than the northern SPMF. The SPMF in the northern and southern hemispheres are changing asymmetrically. The GCR intensity tended to increase gradually from Solar Cycles 22 to 24, meaning that the Earth is exposed to more cosmic rays because of the weakening of the solar magnetic field. The parameters of the IMF, TSI, absolute SMMF, 10.7 cm radio flux, SFI, solar wind dynamic pressure, and Ap index tended to be weakened with SSN over time. The difference in the Ap index between Solar Cycles 22 and 24 was quite large, which was attributed to the effect of weakening solar activity on the Earth's magnetic field.
Third, cross-correlation analysis of the SIG parameters showed that the SSN and 10.7 cm radio flux had a maximum correlation coefficient of 0.9678 without delay and a strong correlation. The relationship between the SSN and TSI has a maximum correlation coefficient of approximately 0.8445 after a one-month delay. Hence, the TSI tended to react with an approximately one-month delay after SSN increases. The absolute SMMF, IMF, and GCR intensity show the maximum correlation coefficient after a 4–8 months delay. Most SIG parameters exhibited strong correlations with the SSN, but some displayed delayed responses, such as the TSI and GCR intensity.
Fourth, as a result of predicting the SSN for three years after 2024 by the SARIMA model, the solar activity in the future Solar Cycle 25 is expected to decrease. The minimum SSN was predicted to be 9.42 in October 2028, and it will likely enter a solar minimum period around 2030.
This study attempted to provide important information for understanding the impact of solar activity on the Earth’s magnetic field and space environment. The changes in solar activity and space weather can significantly affect the infrastructure on the Earth, particularly satellite communication, electrical grids, aviation, and GPS systems. The SARIMA model successfully captured the periodic trends in solar activity, but relying on linear assumptions limits its ability to model more complex solar dynamics. Future research should explore advanced machine learning models, such as deep learning and hybrid approaches, to improve long-term solar cycle predictions.


