1. INTRODUCTION
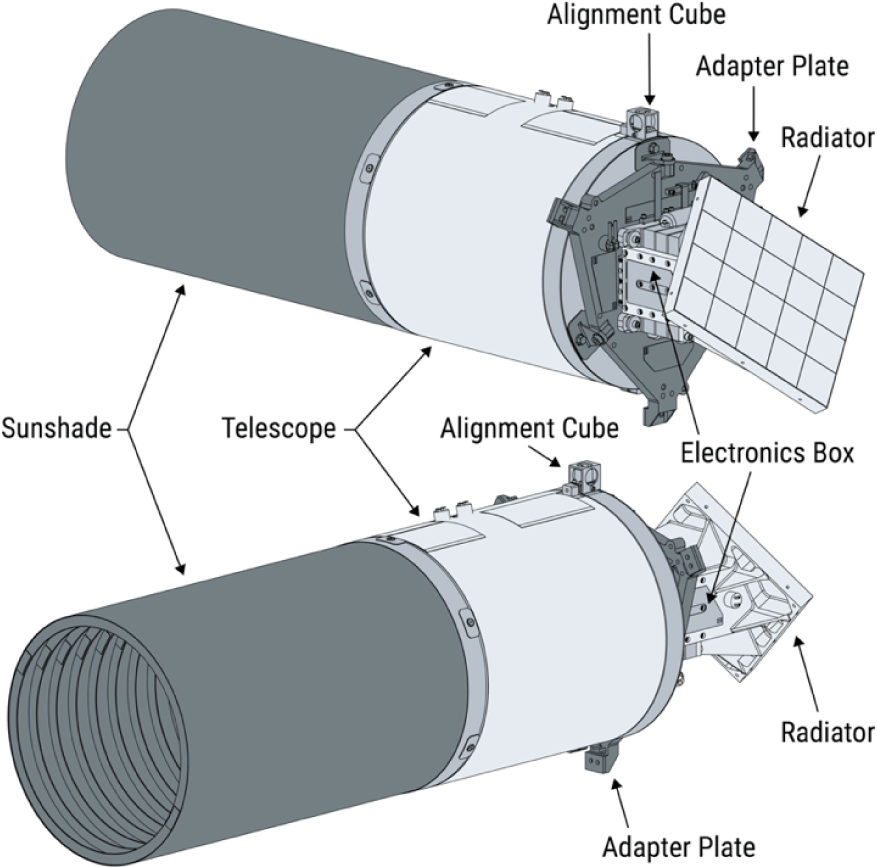
The Republic of Korea launched the Korea Pathfinder Lunar Orbiter (KPLO), also referred to as Danuri, on 5 August 2022 (Kim 2021). The spacecraft carries five science payloads and one technology demonstration. Korean universities and research institutes developed five of the science instruments, and the sixth instrument was a contribution selected through a solicitation led by the NASA Advanced Exploration Systems Division (AES) within the Human Exploration and Operations Mission Directorate (HEOMD) (NASA 2016a, b). NASA selected ShadowCam (Fig. 1; Robinson et al. 2023), developed at Malin Space Science Systems (MSSS) and operated out of Arizona State University. The NASA selection metric was based on increasing our understanding of volatiles in the lunar polar regions by addressing Strategic Knowledge Gaps (SKGs) outlined in a series of studies conducted by the Lunar and Exploration Analysis Group (LEAG 2016; Robinson et al. 2023).
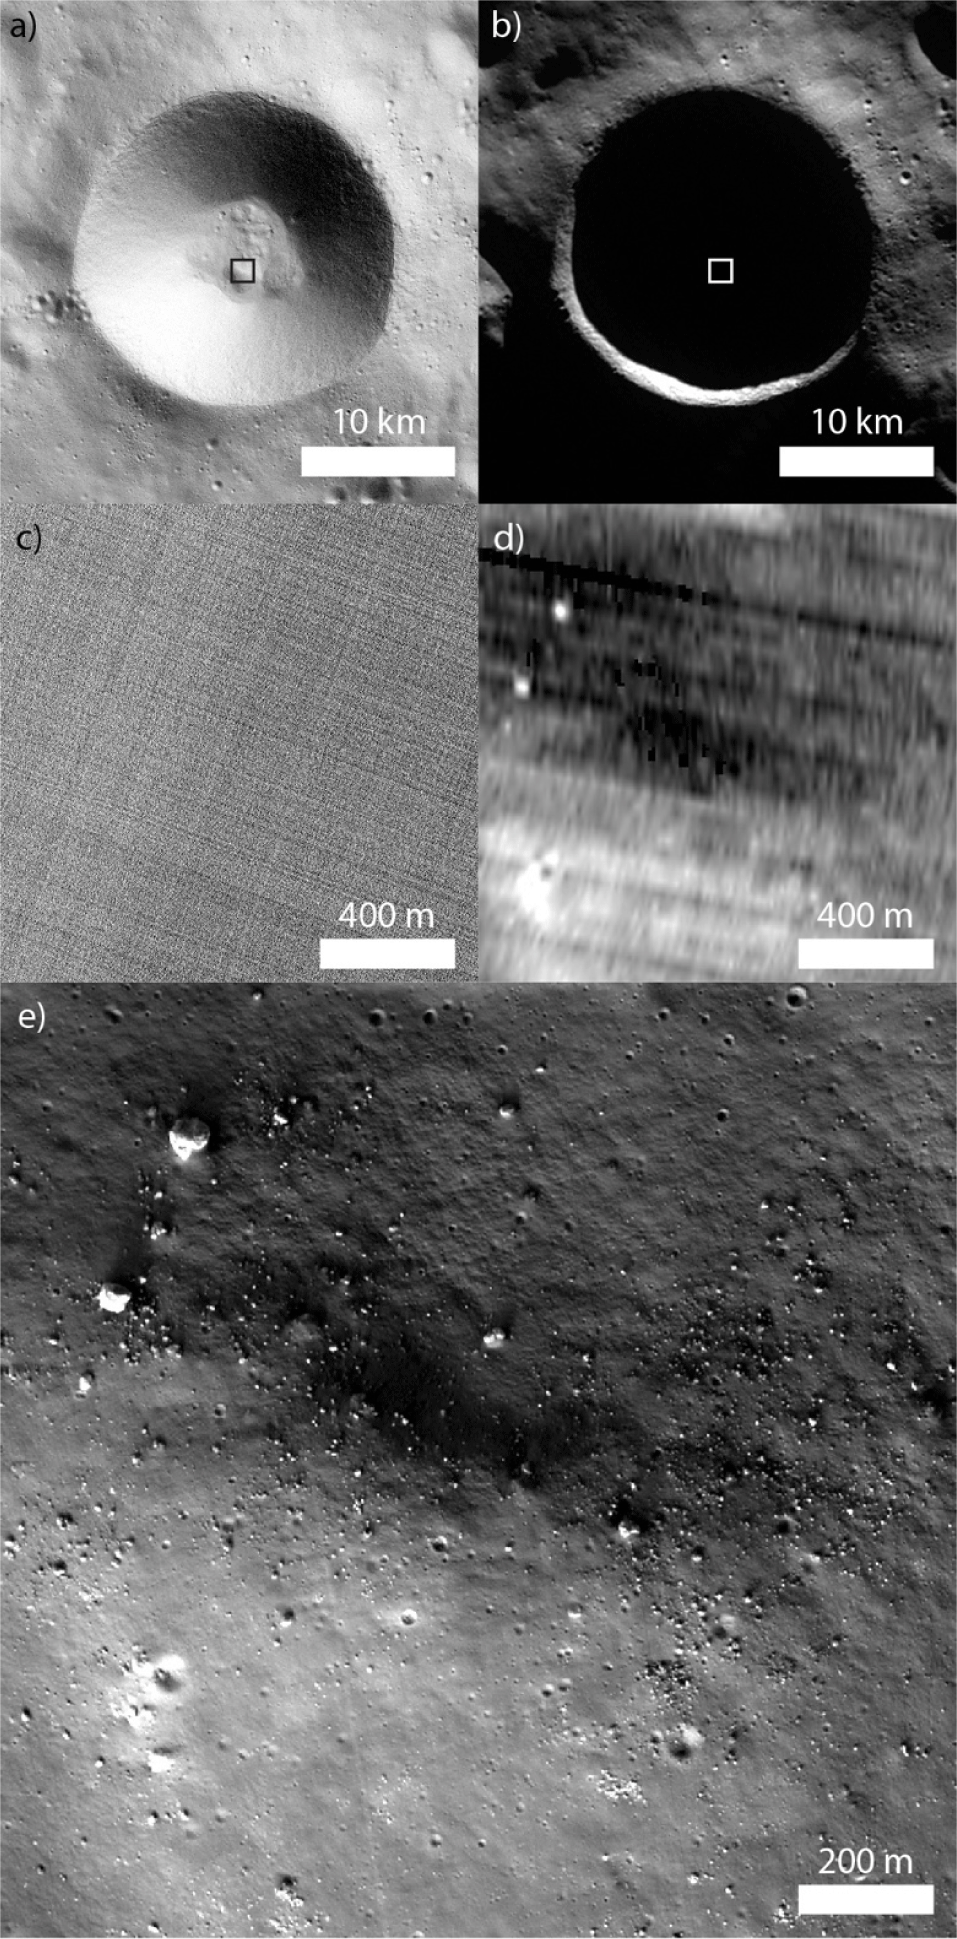
Permanently shadowed regions (PSRs) never receive direct illumination from the Sun. However, they receive light reflected from nearby topographic prominences (Thompson et al. 2019; Mahanti et al. 2022; O’Brien & Byrne 2022). The albedo of the Moon is relatively low (7% to 24%; Vaniman et al. 1991), meaning only a tiny fraction of the sunlight that interacts with the surface is reflected (Hapke 2012). Of this reflected light, portions are projected into PSRs and reflected once more to the observing spacecraft. This double bounce results in a surface radiance about two orders of magnitude lower than nearby directly illuminated terrain within large PSRs (> 10 km2). For current and previous lunar orbiting cameras with fixed apertures, imaging of such low-radiance targets can only be obtained by binning neighboring detector elements and/or increasing the exposure time well beyond the motion smear limit. However, both techniques reduce the spatial resolution of the resulting images, and, in many cases, the images still lack the desired signal-to-noise ratio for scientific analysis (Brown et al. 2022). Fig. 2(d) is an example of both these problems for a Lunar Reconnaissance Orbiter Camera (LROC) narrow-angle camera (NAC) image of a shadowed area. This image was acquired with a long exposure time and, therefore, has sparse down-track sampling (40 m), and its detector elements are binned by 2× (1 m) in the cross-track direction. The NAC image lacks both the spatial resolution and the signal-to-noise ratio of the ShadowCam image of the same area. In addition, the added baffles in ShadowCam offer superior stray light suppression compared to the NAC (Humm et al. 2023), which enables ShadowCam to observe the dim interiors of PSR surrounded by illuminated terrain.
The ShadowCam instrument design has a high heritage from the LROC NACs (Robinson et al. 2010), which have acquired nearly 2.3 million images of illuminated surfaces since entering orbit around the Moon in June 2009. The optical assembly consists of hyperbolic primary and secondary mirrors (Richey-Chretien) with a field of view of approximately 3° and an f-stop of 3.6. The sunshade contains a series of 15 inner baffles to reduce the scattered light within the instrument and limit stray light from nearby sun-illuminated surfaces (Fig. 1; Humm et al. 2023). A TDI sensor from Hamamatsu Photonics replaced the original line array sensor in the LROC NAC instrument to increase the number of photons captured in an observation from the reflected light within the PSR without impacting the spatial resolution of the final image. In addition, the electronics enable readout from both sides of the detector, allowing the capture of images in both flight direction orientations. The basic geometric properties of the detector and optics are presented in Table 1.
Through a series of pre-flight and in-flight experiments, we have characterized the geometry of the ShadowCam instrument, enabling precise mapping of individual surface features required to meet the scientific objectives (Robinson et al. 2023). Unlike typical imaging of directly illuminated terrain with a single set of photometric angles (incidence, emission, phase), the diffuse, scattered light source inside PSRs creates a complex lighting geometry with multiple photometric angles contributing to the illumination within the PSR (Mahanti et al. 2022). Therefore, numerous co-registered observations are needed to interpret the geology of a single point on the surface.
In the following sections, we will detail the calibration methods used to characterize the geometry of the ShadowCam instrument. Sections 2 and 3 details the sensor and image geometry. Relative to the LROC calibrations, more careful consideration is needed regarding the sensor and image geometry with the TDI sensor from Hamamatsu Photonics (Hamamatsu, Japan) since the detector comprises multiple channels with prescan and overscan pixels interleaved into the raw image. Section 4 uses the same rotary stage at MSSS to characterize the LROC instrument suite (Robinson et al. 2010; Speyerer et al. 2016) to measure the distance the scene (bar pattern) shifts with each degree of rotation to characterize the optical distortion. Section 5 introduces techniques the ShadowCam team uses to optimize each observation by selecting the best line time. Finally, Section 6 focuses on in-flight calibration methods. Since the ShadowCam instrument is a single camera as opposed to the twin NACs, and therefore, limited consideration is needed regarding the precision of the orientation, and more emphasis is placed on the accuracy of the orientation.
2. SENSOR GEOMETRY
ShadowCam uses a TDI charged-coupled device (CCD) provided by Hamamatsu Photonics (Model S10202-08-01) to collect photons reflected out of permanent and temporarily shadowed regions. The LROC NAC instrument (Robinson et al. 2010) consists of a single 5,001 × 1 detector array that collects single-line integrations. Longer exposure times are only possible by increasing the line time and making the line sampling in the image sparser. ShadowCam, on the other hand, uses a 4,096 × 128 TDI CCD which sums the signals in different detector rows in such a way that it benefits from a much longer effective exposure time without any change in the line time or sampling. Both instruments use the motion of the spacecraft to build an image (Fig. 3(a)), but ShadowCam must match its line time to the to the spacecraft ground speed to obtain the full spatial resolution benefit of short line time with much longer effective exposure time. The detector in ShadowCam has 4,096 detector elements in the cross-track direction and 128 image lines, also called TDI stages (Fig. 3(b)). The 4,096 detector rows are split across eight 512-row channels (Fig. 3(b) and 3(c)), of which ShadowCam uses the center six due to constraints of the optics (i.e., the size of the image projected through the optics onto the detector; outermost detector elements are occluded). Therefore, a ShadowCam image is constructed from the center six channels including 3,072 active elements (Fig. 3(b)).
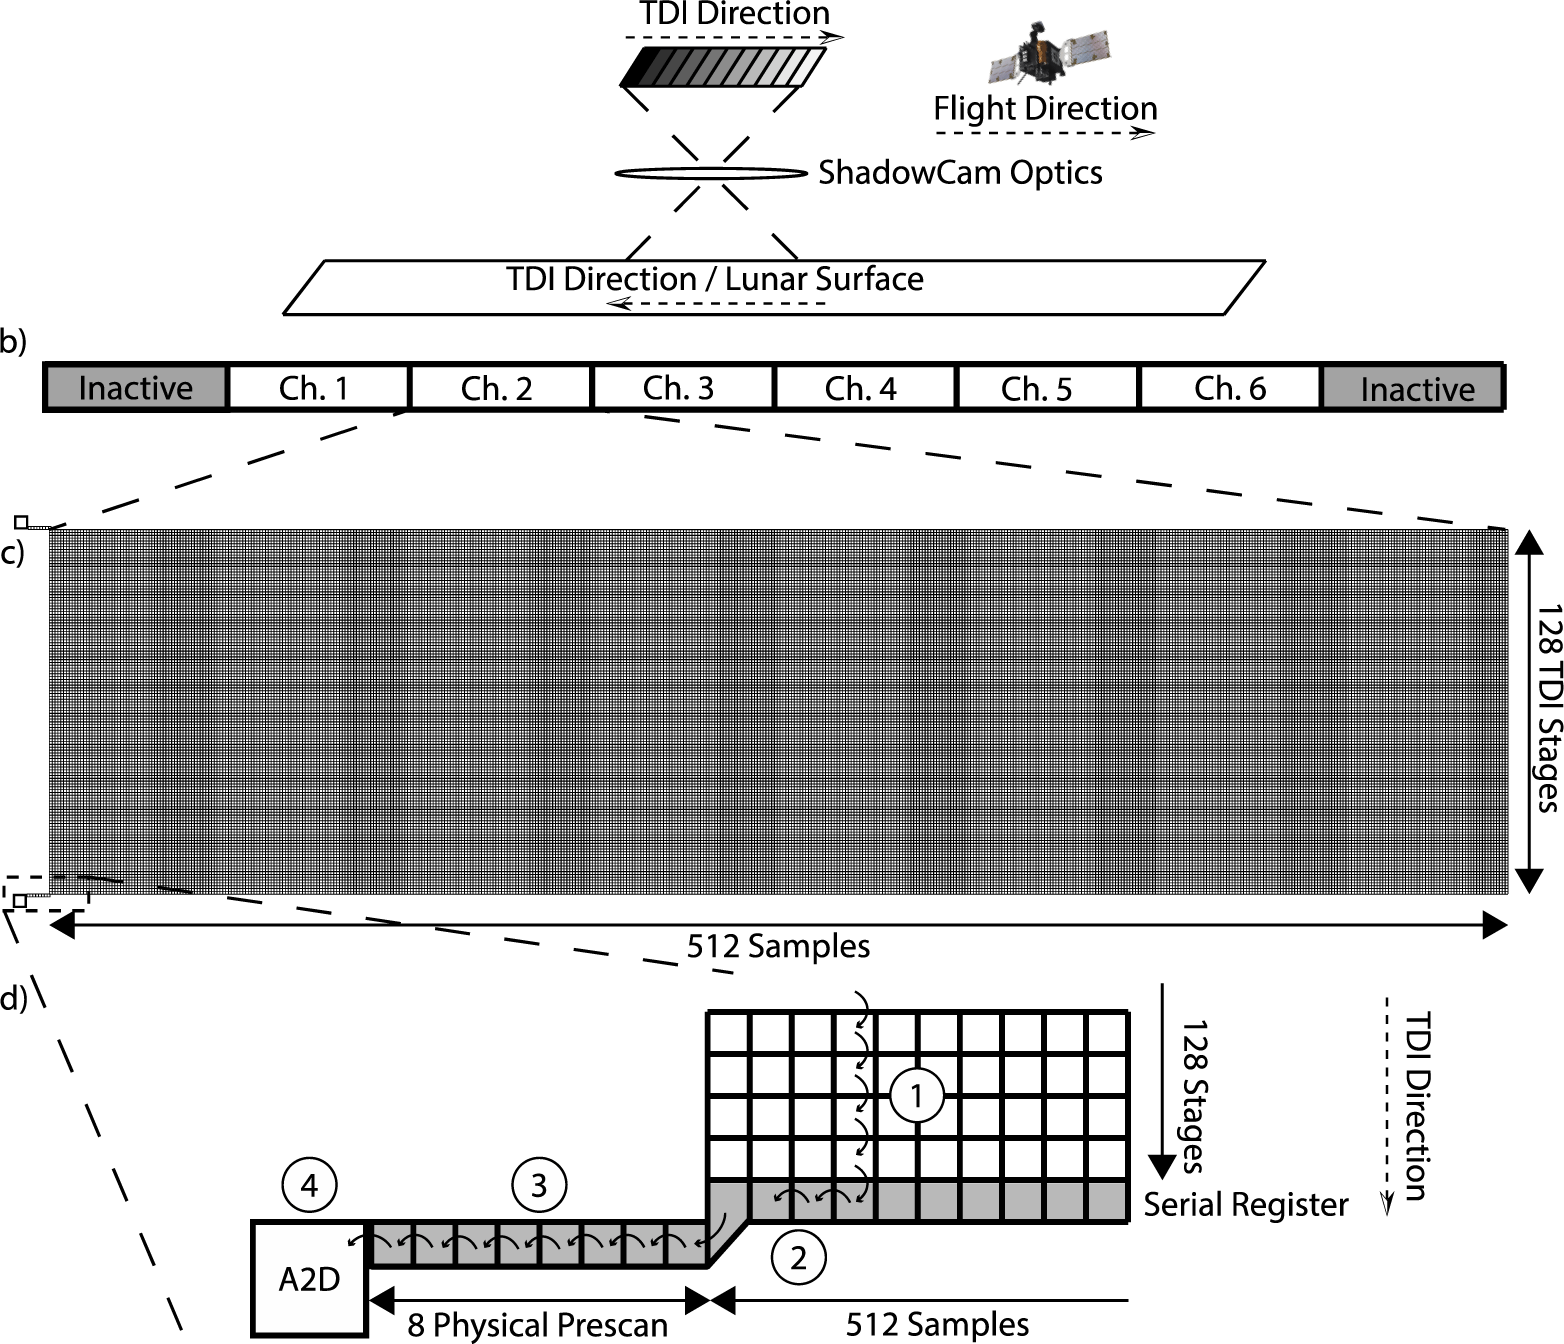
As an object enters the camera field of view, it is imaged by the first stage of the TDI detector (Fig. 3(a)); as the instrument scans the surface, the charge from the first stage of the TDI is transferred to the subsequent stage, and additional photons from the object are captured and added to the signal in the CCD (Fig. 3(a)). This charge cascading down the stages enables a short line time with a much longer effective exposure time. The line time of the TDI detector must be matched to the ground velocity so that the added signal in each line is of the same feature. This process is repeated for all the following stages on the detector until the charge reaches the serial register at the end of the 128 stages (Fig. 3(d)). The serial buffer then transfers the charge to the analog-to-digital (AD) converter, which converts the analog signal (electrons) to a digital number (DN) (Fig. 3(d)). Before reaching the AD converter, the signal from the serial register travels through eight physical pixels that move the charge away from the imaging portion of the sensor. These pixels are located just beyond the trailing edge of the detector, not between the channels, so the light-sensitive rows of the eight channels are adjacent to one another without any gaps in spatial coverage (Fig. 3(d)).
The detector elements on the LROC NAC detector are square and measure 7 µm on a side (Robinson et al. 2010). Meanwhile, the detector elements on the ShadowCam detector are square and measure 12 µm on a side (~3 × larger area). Assuming a similar quantum efficiency (~80% at 600 nm), the additional 127 stages in the TDI array and longer exposure time due to the detector element size and ground speed would lead to the ShadowCam instrument sensing features that are over > 600 times dimmer than possible with the LROC NAC camera. However, this sensitivity is too great even in the darkest permanently shadowed regions on the Moon. A sensitivity this high would cause the detector to reach its full-well capacity and cause high instrument saturation in shadowed regions. Therefore, when the focal plane was assembled, a mask with a slit was placed above the detector. The mask was opaque, and the slit exposed 32 TDI stages of the detector, which enables a sensitivity that is ~200 times greater than the LROC NAC. The slit is required to reduce the number of photons captured by the detector, thus preventing saturation in shadowed regions.
Reducing the number of TDI stages used during an observation also reduces instrument stability and jitter requirements. Capturing an image with the highest degree of sharpness requires the TDI line rate (sometimes called the clocking rate) to match the projected ground speed and for the surface feature to remain in the same column of the detector while the camera scans the surface. More details about the line time are discussed in Section 5. However, the second effect relates directly to spacecraft stability. An alternative to installing a slit would be to add a narrow-band filter only to allow incoming light rays of a specific wavelength to pass to the detector or add a neutral density filter over the entire array. Both would reduce the amount of incoming light to the detector, reducing the number of electrons being passed and potentially saturating regions of the image in shadow. Despite a similar reduction in sensitivity, these alternative approaches would require the surface feature to remain in the same column through all 128 TDI stages to maintain maximum sharpness. With the slit, this requirement reduces to a much smaller subset of TDI stages. In addition to any motion smear caused by the TDI line rate not matching the projected ground speed (Li et al. 2021), spacecraft jitter also impacts image sharpness. Jitter results from micro-vibrations caused by motion onboard the spacecraft at frequencies above the attitude-control bandwidth (8 Hz). To limit jitter during ShadowCam observations, the high-gain antenna and solar array are stopped prior to the observation with an additional settling time. The antenna remains stationary throughout the observation to help meet the line-of-sight jitter requirement for ShadowCam of less than 8.5 µrad.
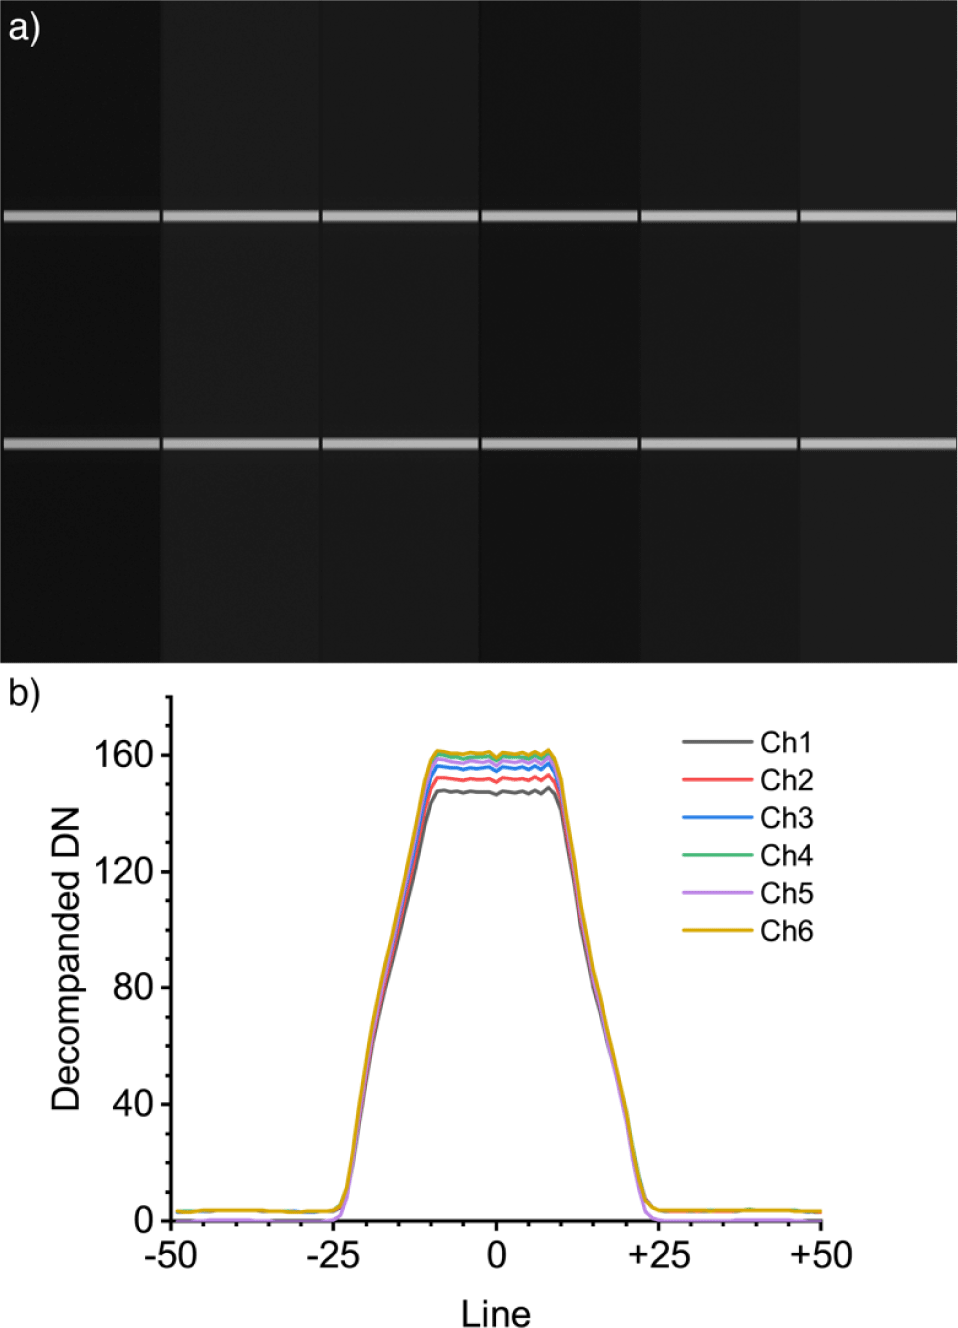
The slit above the focal plane defocuses the light to affect more than 32 stages (Fig. 4). To quantify the effect, we collected a series of observations in the lab using a Paul C Buff (Nashville, TN, USA). Einstein E640 flash unit that illuminated a spectralon panel. The instrument pointed off-axis and acquired an observation while the flash was fired several times. In each instance, the duration of the flash was less than the line time of the TDI, allowing the imaging of the slit characteristics. Fig. 4 shows one of the resulting lab images with profiles taken across each active channel. Each profile is identical, indicating that the width of the slit remains constant across the image. In addition, it shows that 48 TDI stages are sensitive to incoming light due to defocusing, but the full-width half-max remains near the desired 32 TDI stages.
Due to thermal and power considerations, KPLO performs a 180° yaw maneuver twice yearly when the spacecraft crosses 0° solar beta angle (similar to the LRO spacecraft when crossing over 0° beta). When this occurs, the TDI direction must reverse to sync the ground velocity and movement of electrons across the detector. In sync with the yaw maneuver, the detector is programmed to switch between A and B side modes. Changing the mode reverses the electron flow direction through the TDI stages; there is a duplicate set of AD converters and eight physical prescan pixels on the other side of the detector, allowing the signal to be read (Fig. 3(c)). While this reversal does alter the radiometric results, it does not alter the geometric characteristics of the instrument.
3. IMAGE GEOMETRY
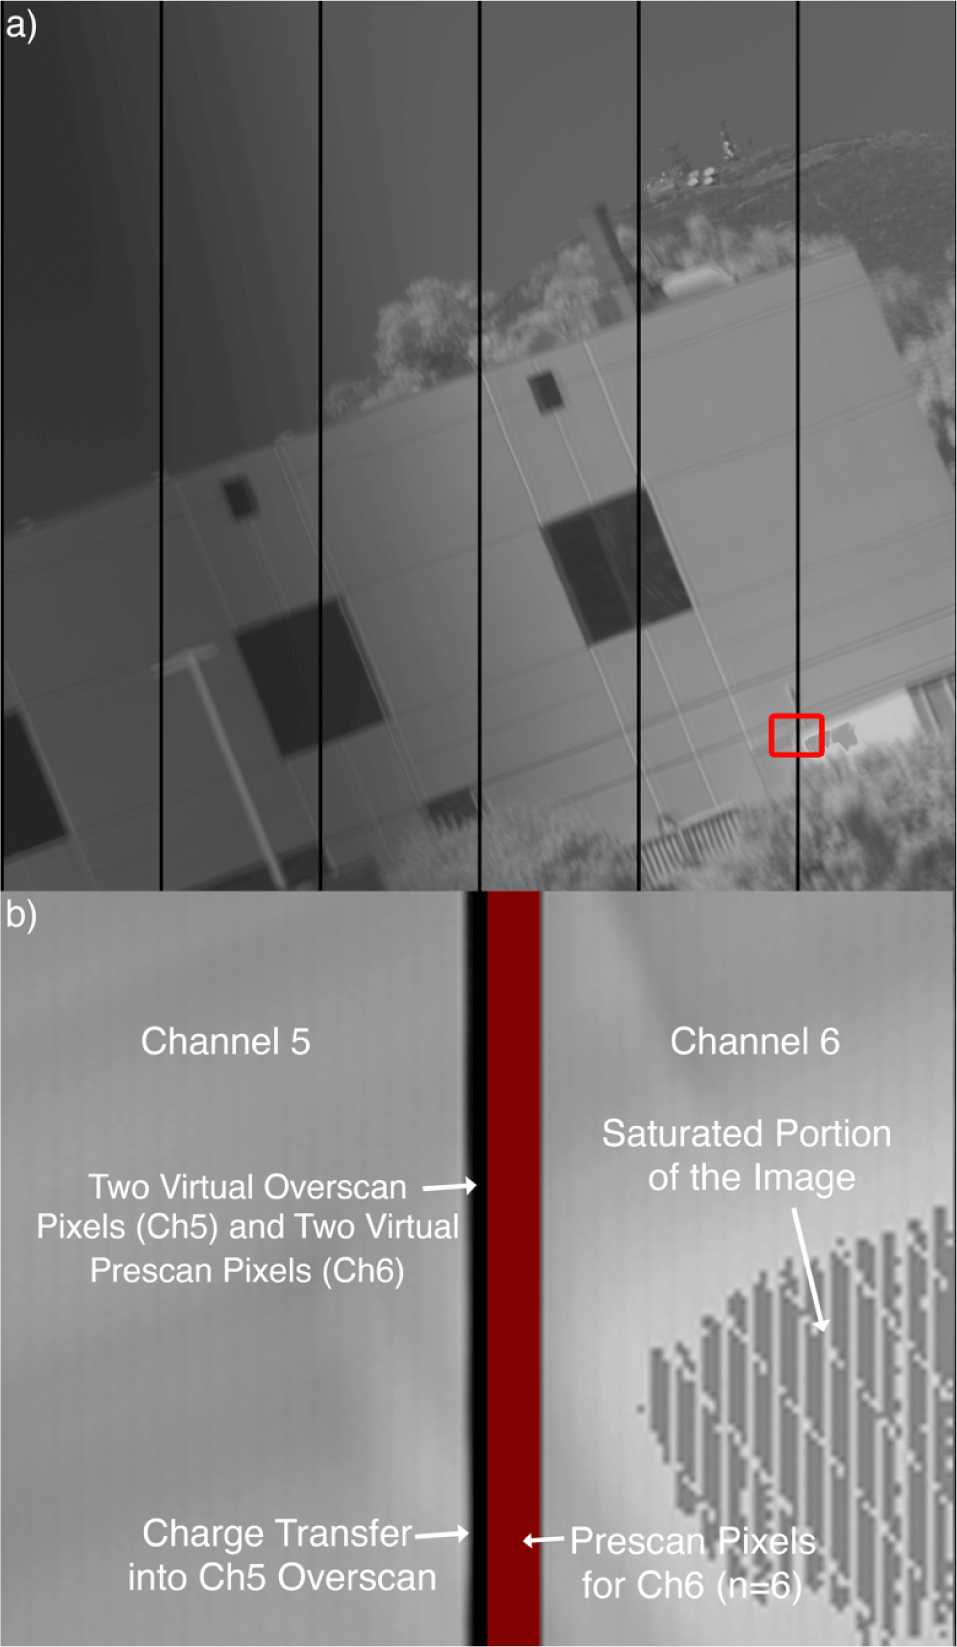
A raw ShadowCam image contains 3,144 pixels or 524 pixels per channel. Of the 524 pixels, 512 are active and sensitive to incoming photons (and form the image). The remaining 12 pixels are used solely for calibration purposes. Each line in each channel has 10 prescan pixels and two overscan pixels. These pre- and overscan pixels are typically used to characterize the bias level of the observation. The bias should have DN > 0 to ensure a linear response to the incoming light after calibration. As stated, the sensor contains eight physical pixels between the first active pixel and the AD converter. Therefore, two of the prescan pixels in the raw images are virtual pixels. Virtual pixels are generated by sampling the AD converter without reading or moving the charge on the serial register. Likewise, the sensor contains no physical pixels beyond the active array, indicating that the two overscan pixels in the images are also virtual. This means the AD converter is read an additional two times after reading the last column of the channel. In the ideal case, all 12 pixels would sample the bias level of the observation. However, in our current radiometric calibration implementation (Humm et al. 2023), we only use the eight physical pre-scan pixels to characterize the bias level since some residual charge has been observed in the two overscan pixels when targeting bright scenes. Fig. 5 shows a layout of the ShadowCam images and the location of corresponding prescan and oversan pixels.
While the image width is the same for all observations, the length of the image can vary depending on the objectives of the acquisition (up to 84,992 lines). Additionally, in most cases, the first line of the raw image may not be the first line read by the electronics. Each observation has a commanded number of preroll lines that are acquired but thrown out and not saved in the raw image. The number of preroll lines generally ranges between 357 and 1,024, but in some cases, calibration images are acquired with as little as zero preroll lines. In this latter case, the signal in the detector before the observation may be stored in the first 128 lines of the raw image. When taking scientific measurements, these first 128 lines should be ignored when no preroll lines are captured. However, there is potential use for later in-flight calibration and monitoring camera health and performance from zero preroll line images.
4. OPTICAL DISTORTION
Understanding the sensor and image geometry makes it possible to explore the optical system geometric distortion, principal point, and focal length. Before the launch, we calibrated the camera at MSSS. Since the camera system is focused at infinity (the closest focus is about one kilometer), it is impossible to image a standard calibration target directly in the laboratory and still be in focus. Instead, the camera is positioned in front of a set of optics with the same prescription as the ShadowCam instrument (Fig. 6). This enables imaging of a target in focus from close range. For the geometric characterization, we used a tilted bar target. The illuminated bar target contains a set of equally sized opaque bars. Several filled-in bars offer unique signatures in the raw images to reference position along the set of uniform bars. Measuring the width of the individual bars (ranging between ~29 pixels near the center and ~31 pixels toward the edge of the image) provides a measure of distortion. However, this method assumes that all the bars are the same width and fails to provide a dense and robust set of measurements to quantify small-scale distortions.
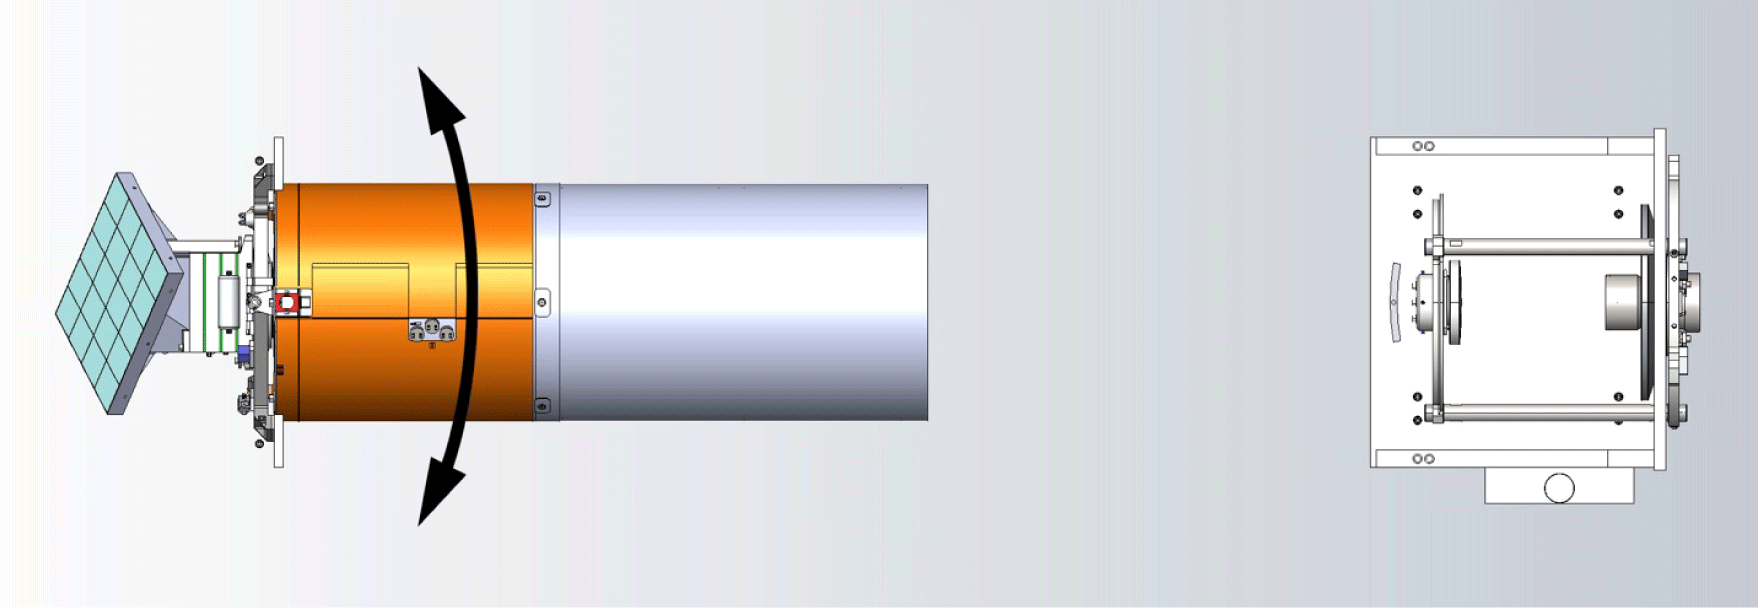
Alternatively, we mounted the camera on an Ultradex rotary stage, which permits precise azimuthal rotations quantized in 1-degree increments with an accuracy of 1/3,600 of a degree (Fig. 6). The field of view of ShadowCam is less than 3 degrees, so 1-degree sampling of the distortion function would be too sparse. To obtain a finer sampling, between sets of images with the pattern moved in 1-degree increments, the base of the stage was rotated slightly on the table in an uncontrolled manner, after which a new set of images was acquired with the pattern moved in 1-degree increments again (Fig. 7).

Tilting the bar pattern target resulted in the projected image being in focus near the center and out of focus approaching the edges. Nineteen sets of three to four images of the bar target were acquired (Appendix Table A1), with precise one-degree rotations performed between each observation (Fig. 7). We then measured the position of the bars moved after each one-degree rotation to derive the interior orientation parameters. Since the current flight instrument holds a residual charge in the serial register during readout (Humm et al. 2023), we only examined and monitored the shifting of the leading edge of the bright bar patterns (left side of the bright bar). We also limited ourselves to a few bars near the optimal focus point. We reconstructed the bar target images by removing the prescan and overscan pixels from each channel, reconstructing an image 3,072 pixels wide (512 × 6). A 9-pixel wide Gaussian filter (sigma = 1.76) was used to identify the bar edge at the sub-pixel level (Fig. 8; top row) from which we calculated the absolute value of the derivative along each line of the image (Fig. 8; middle and bottom row). With this filtering applied, the edge of the bar target was identified as a spike in the signal (Fig. 8; bottom row).
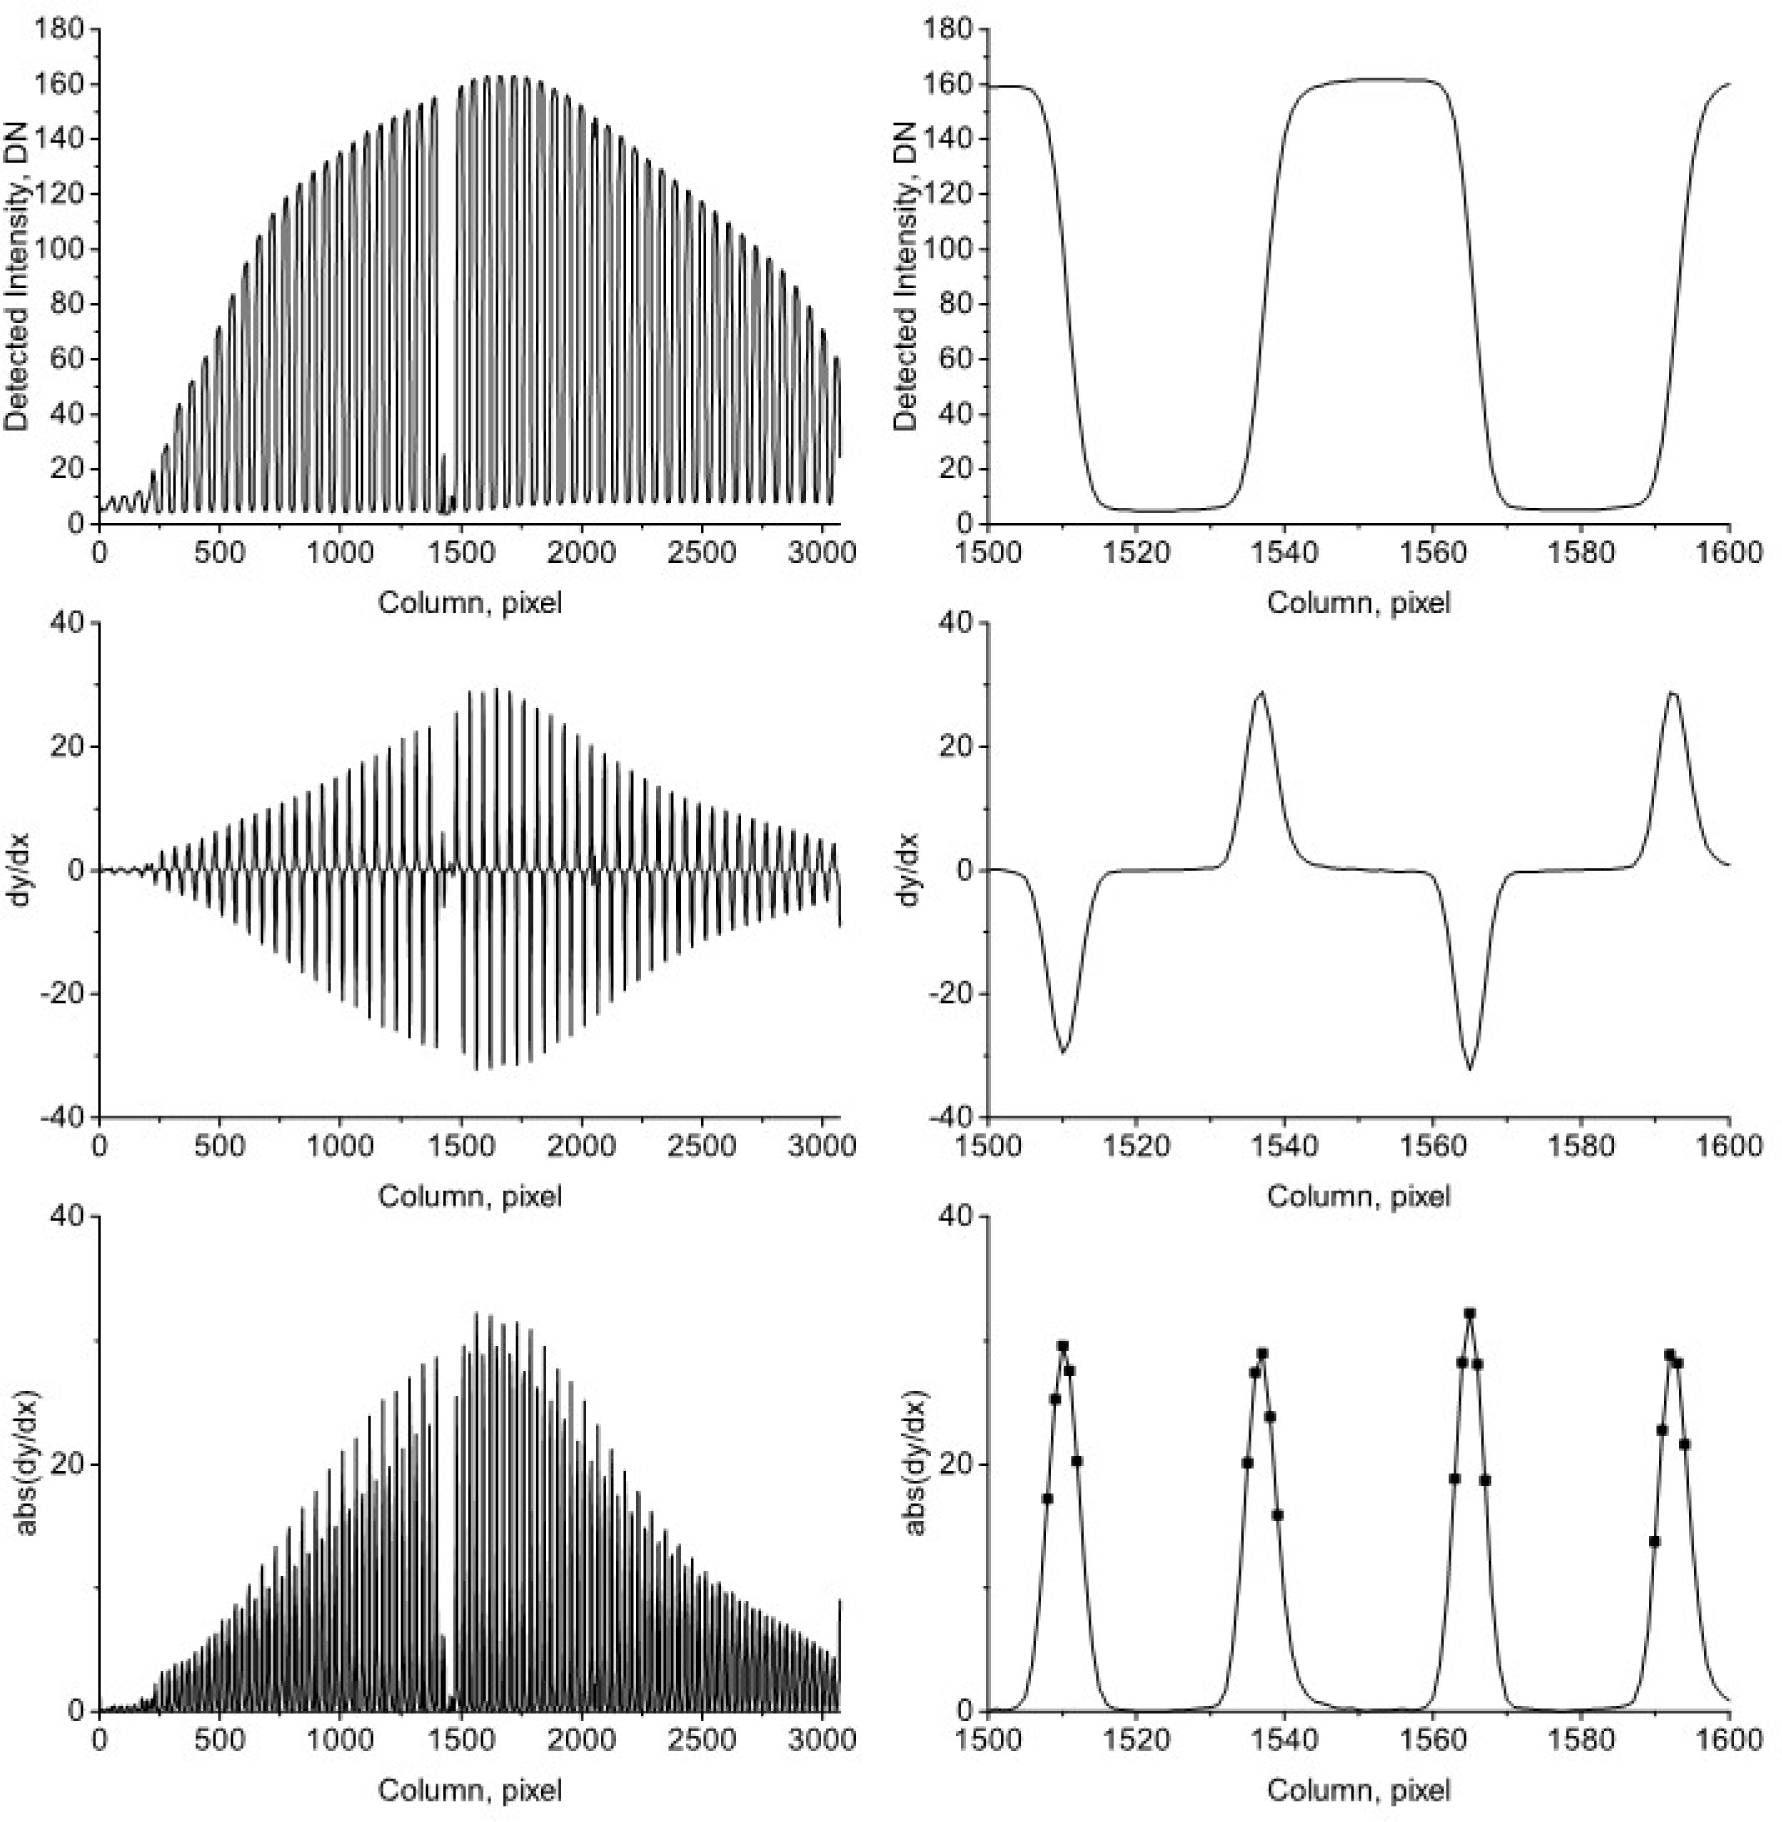
Once we identified the location of the peak associated with the bar’s edge, we selected the two neighboring pixels on each side of the peak and fitted a polynomial to the five points (Fig. 8). The maximum value of this polynomial was used to locate the edge of the bar pattern at the sub-pixel level. This process was repeated for each line of the image. After processing each image line, the mean sub-pixel value and standard error were stored for each bar edge.
We then measured the distance (in pixels) that each bar edge moved when we rotated the stage by one degree in the same collection of three to four images. The rotation direction for the comparison was chosen so the position of the bar edge would move to a higher sample number. This shift was 1,017 to 1,026 pixels, depending on position (distance from the principal point) before the rotation. We only used bar edges whose position was estimated within 0.5 pixels (edge uncertainty after filtering = 0.05 ± 0.08 pixels). We derived the interior orientation parameters (Appendix Table A2) from 242 measurements. Fig. 9 below documents how far the bars shifted with a one-degree rotation on the Ultradex rotary stage as a function of the distance from the left edge of the detector (sample). This line was then fit with a radial distortion model to estimate the interior orientation parameters (Table 2):
| Parameter | Value (95% CI) |
|---|---|
| Focal length, mm | 699.275 (699.265, 699.286) |
| Optical center, sample | 1,558 (1,545, 1,572) |
| Optical distortion coefficient | –1.741 × 10⁻⁵ (–1.797 × 10⁻⁵, –1.684 × 10⁻⁵) |
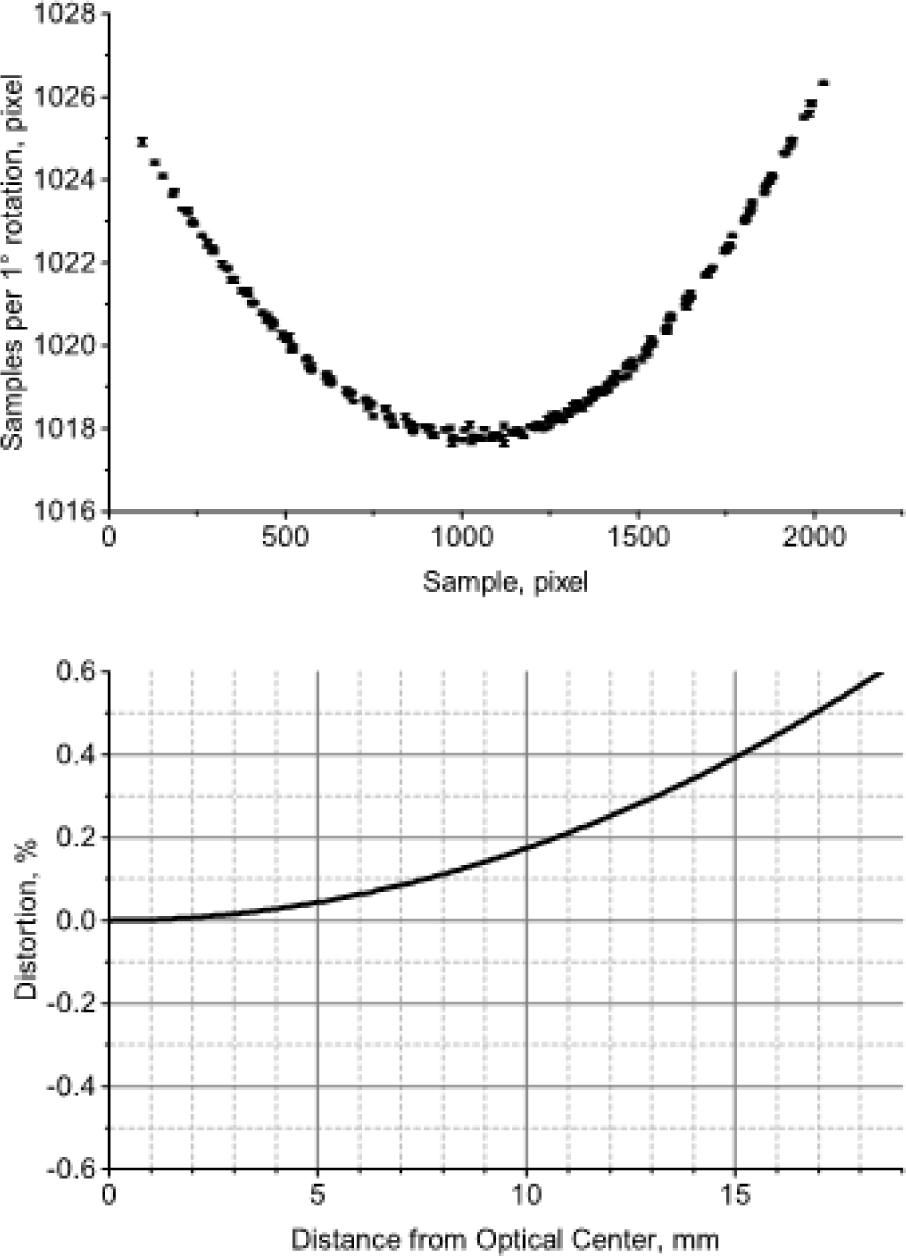
where xc, xd, and xu are the center pixel, distorted (observed), and undistorted (ideal) pixel locations, respectively. Additionally, k2 and r represent the radial distortion coefficient and the radial distance to the center pixel.
5. TIME DELAY INTEGRATION (TDI) IMAGE OPTIMIZATION
Since the electrical charge is passed from one TDI stage to the next until it hits the serial register, the camera can be treated as a single-line pushbroom camera in some respects. However, as previously stated, it is essential for a TDI instrument that the line time is commanded to match the projected ground speed, which affects image sharpness in the down-track direction. A single-line pushbroom camera has down-track smear proportional to the exposure time for each line. A TDI camera has an additional down-track smear proportional to the line time, the number of stages of TDI, and the percentage mismatch between the TDI line time and the ground speed. It is also essential that the TDI direction be matched to the spacecraft flight direction, which affects image sharpness in the cross-track direction. Instrument alignment on the spacecraft, attitude stability, and orbit prediction accuracy all affect the necessary synchronization to optimize imaging performance.
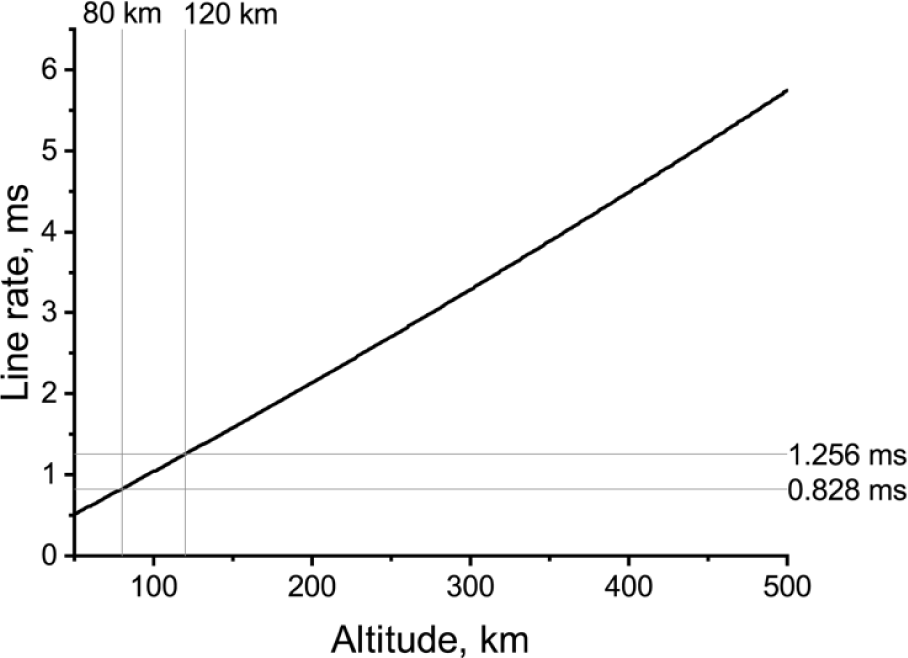
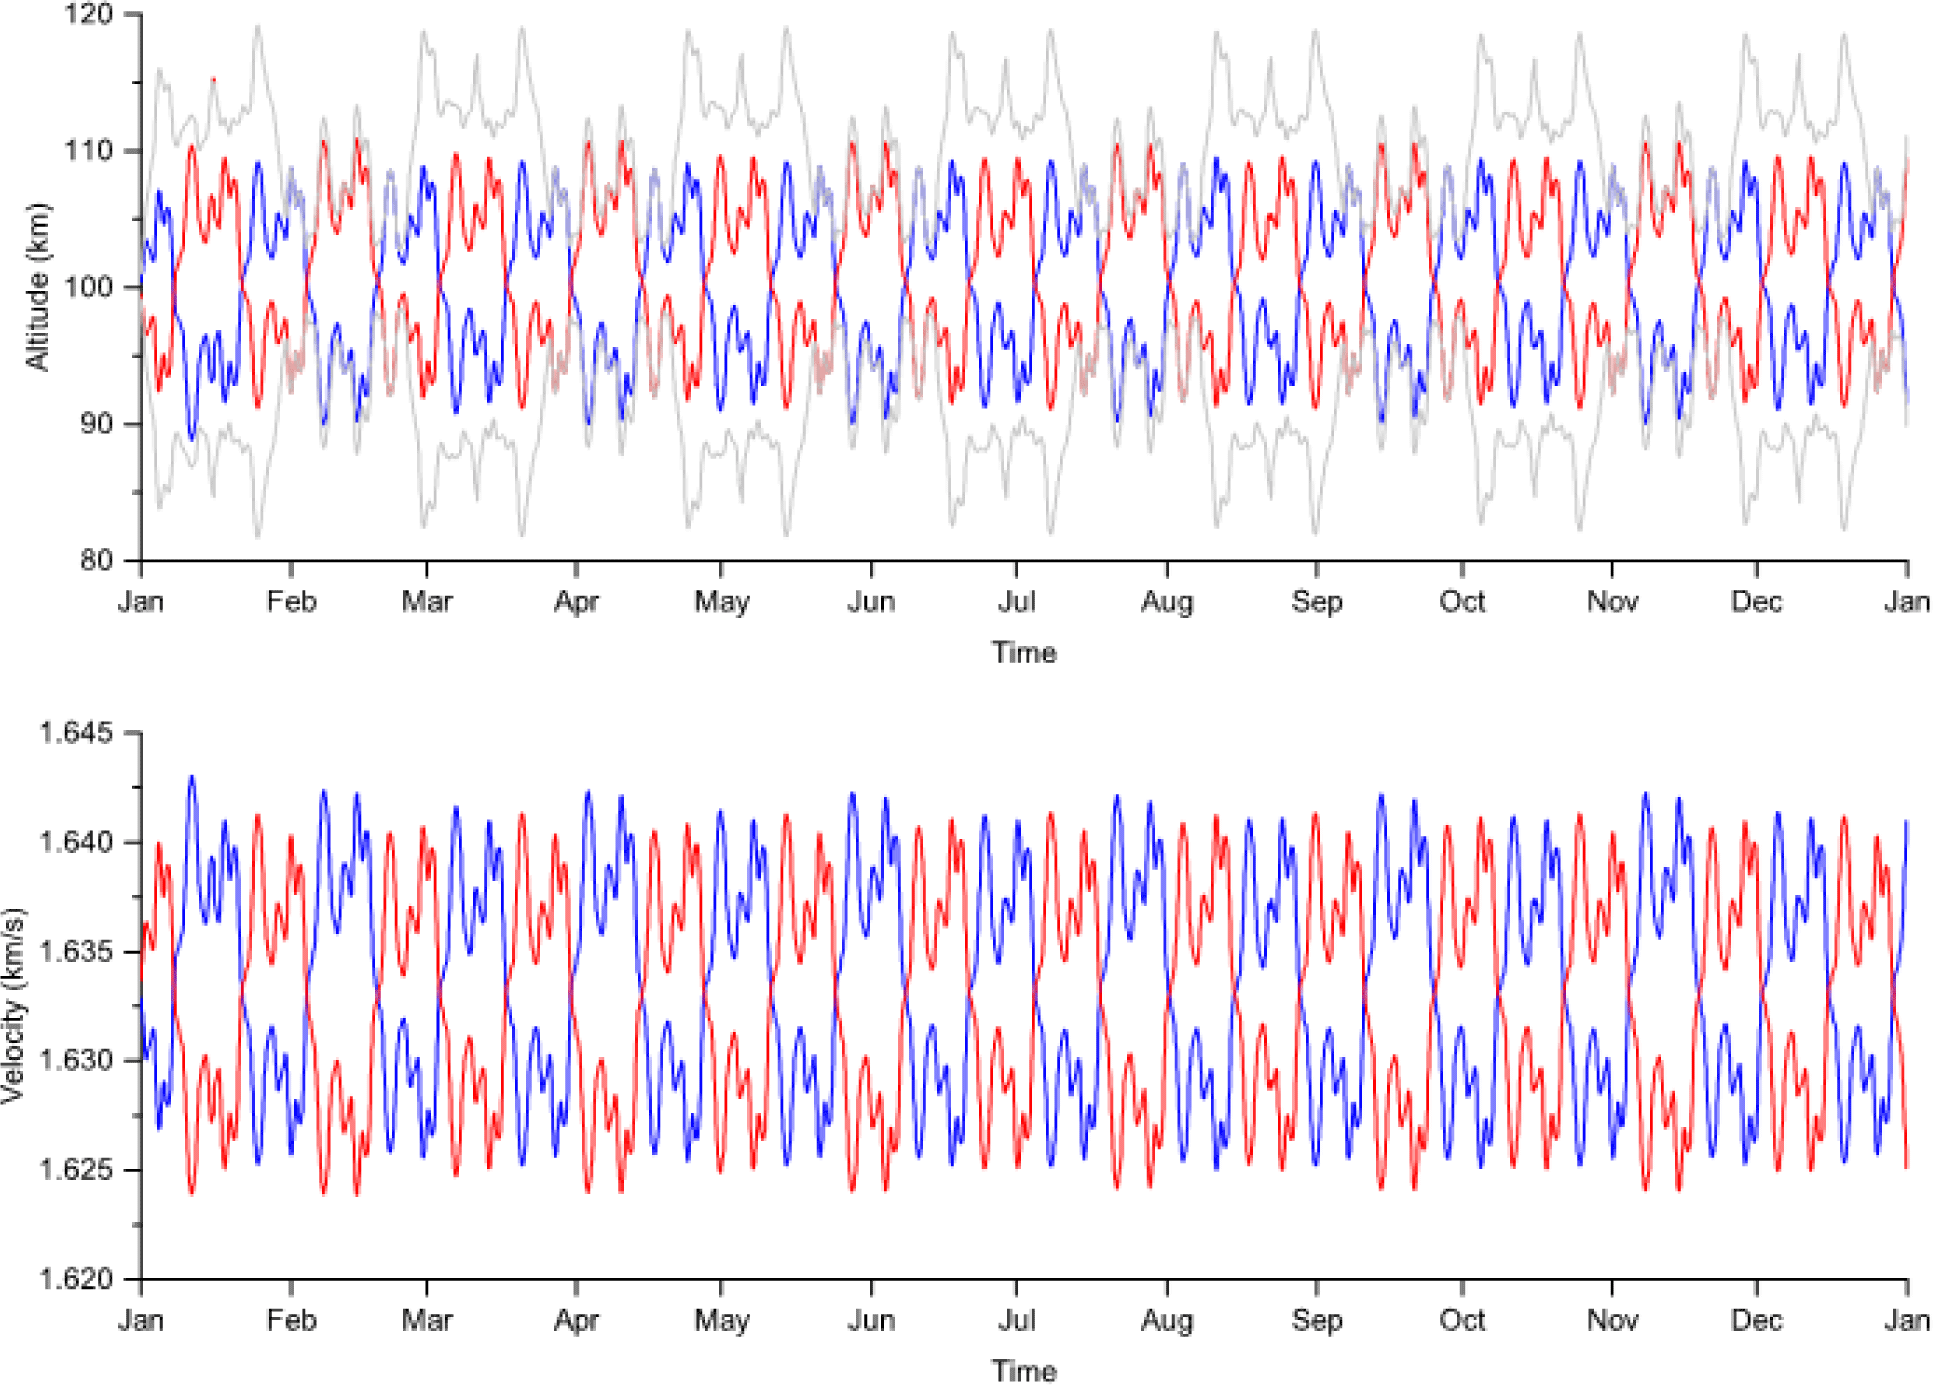
In an ideal case, the instrument would be set at a fixed standoff distance from the object, and the target would move at a fixed speed past the camera (similar to a camera over a conveyor belt). In reality, a camera orbiting the Moon has additional variables that must be considered in terms of targeting and projecting images onto a shape model. First, the camera is attached to a moving spacecraft in orbit. The spacecraft altitude dictates the standoff distance from the target and the speed at which the target moves under the sensor. For example, in a 100 × 100 km circular orbit, the standoff distance is 100 km, and the projected ground speed is 1,634 m/s. A pixel scale of 1.7 m results in a TDI line time of 1.04 ms for an exposure time including TDI of 33.30 ms. In an orbit that extends to 300 km, the standoff distance triples, which also increases the pixel scale of the image to 5.1 m; the ground track speed of the spacecraft decreases to 1,551 m/s. Under these conditions, a line time of 3.29 ms is required with an exposure time including TDI of 105.20 ms (Fig. 10). Due to the lumpy gravity field of the Moon (Zuber et al. 2013), a “circular” orbit is not possible, and variations in altitude in a single orbit are expected. During the nominal phase of the Danuri mission, the altitude typically ranges to 80 and 120 km over a two-month cycle (Fig. 11).
Additionally, the standoff distance varies as a function of position over the Moon due to lunar topography, which ranges from −9,117 m to 10,783 m relative to the mean radius (Smith et al. 2010). Therefore, during a single observation, ShadowCam images terrain with a significant variation in elevation and thus standoff distance. As a result, during targeting, each image is prescribed a line time that limits the amount of down-track image smear caused by out-of-sync projected ground speed and the line time of the instrument.
A smear magnitude map layer (based on the nominal line time) is integrated into the targeting software, providing a visual cue for targeters. While the targeting software provides an initial estimate of the optimal line time, the operations personnel can tune the line time to ensure the most scientifically significant region has the least smear. The initial line time estimate is based on the field of view of the observation, what regions of the image are currently in shadow during the particular orbit, and the range of elevation. In some cases, the observation might be optimal scientifically if a crater wall has optimal sharpness (smallest smear), while in other instances, the crater floor may merit optimal sharpness. In addition, since many ShadowCam observations contain multiple shaded areas, each at a unique elevation, some line times are altered to optimize particular permanently shadowed areas.
In some cases, this is due to extreme variations in topography. The magnitude of the smear may be too large for a given line time; in these cases where the smear exceeds a pixel in the down-track direction, the observation is split into two observations, and each one is assigned a different line time. When breaking the observations into sub-images, a short coverage gap is introduced between them to allow time to reset the camera parameters (~2 seconds or about 3 km on the surface). The smear map indicators (Fig. 12) are archived in the planetary data system (PDS) along with the raw engineering data records (EDRs) to enable the community to account for TDI line time smearing during image analysis.
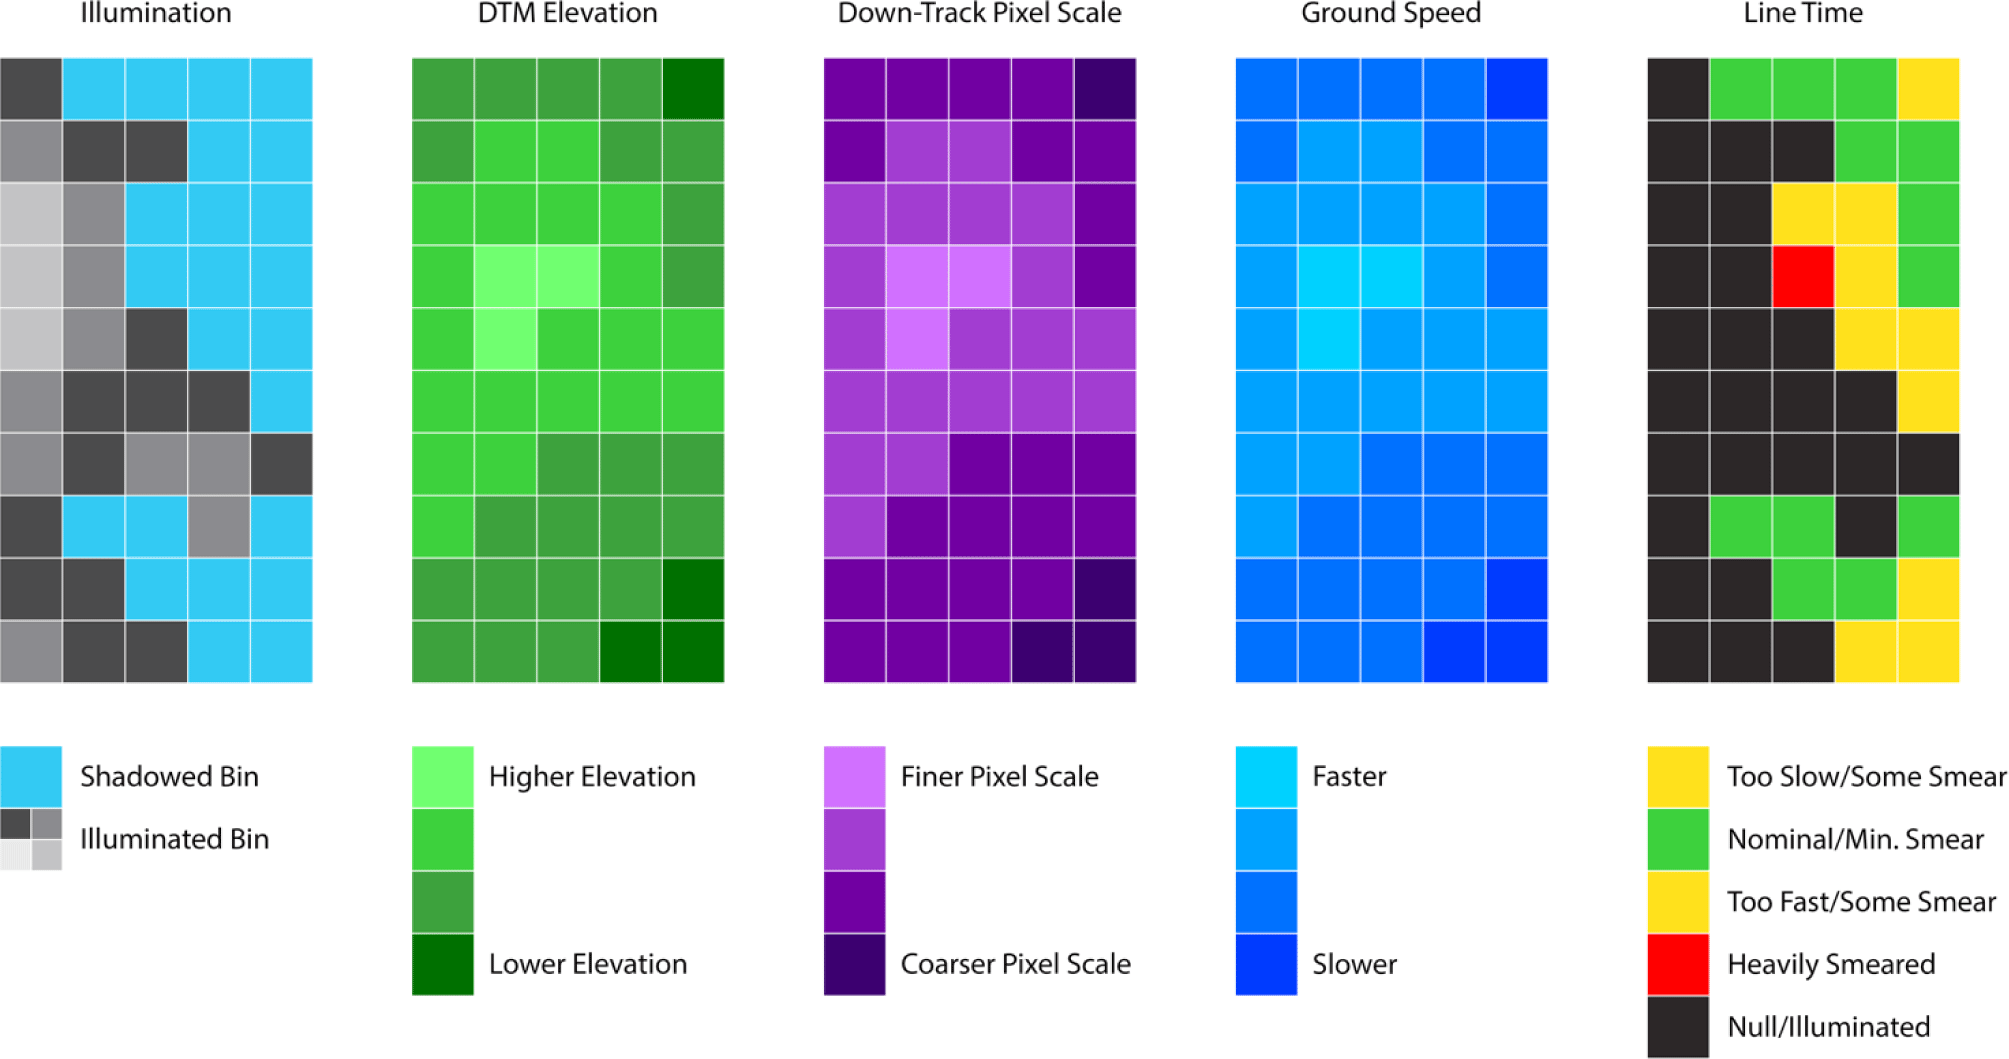
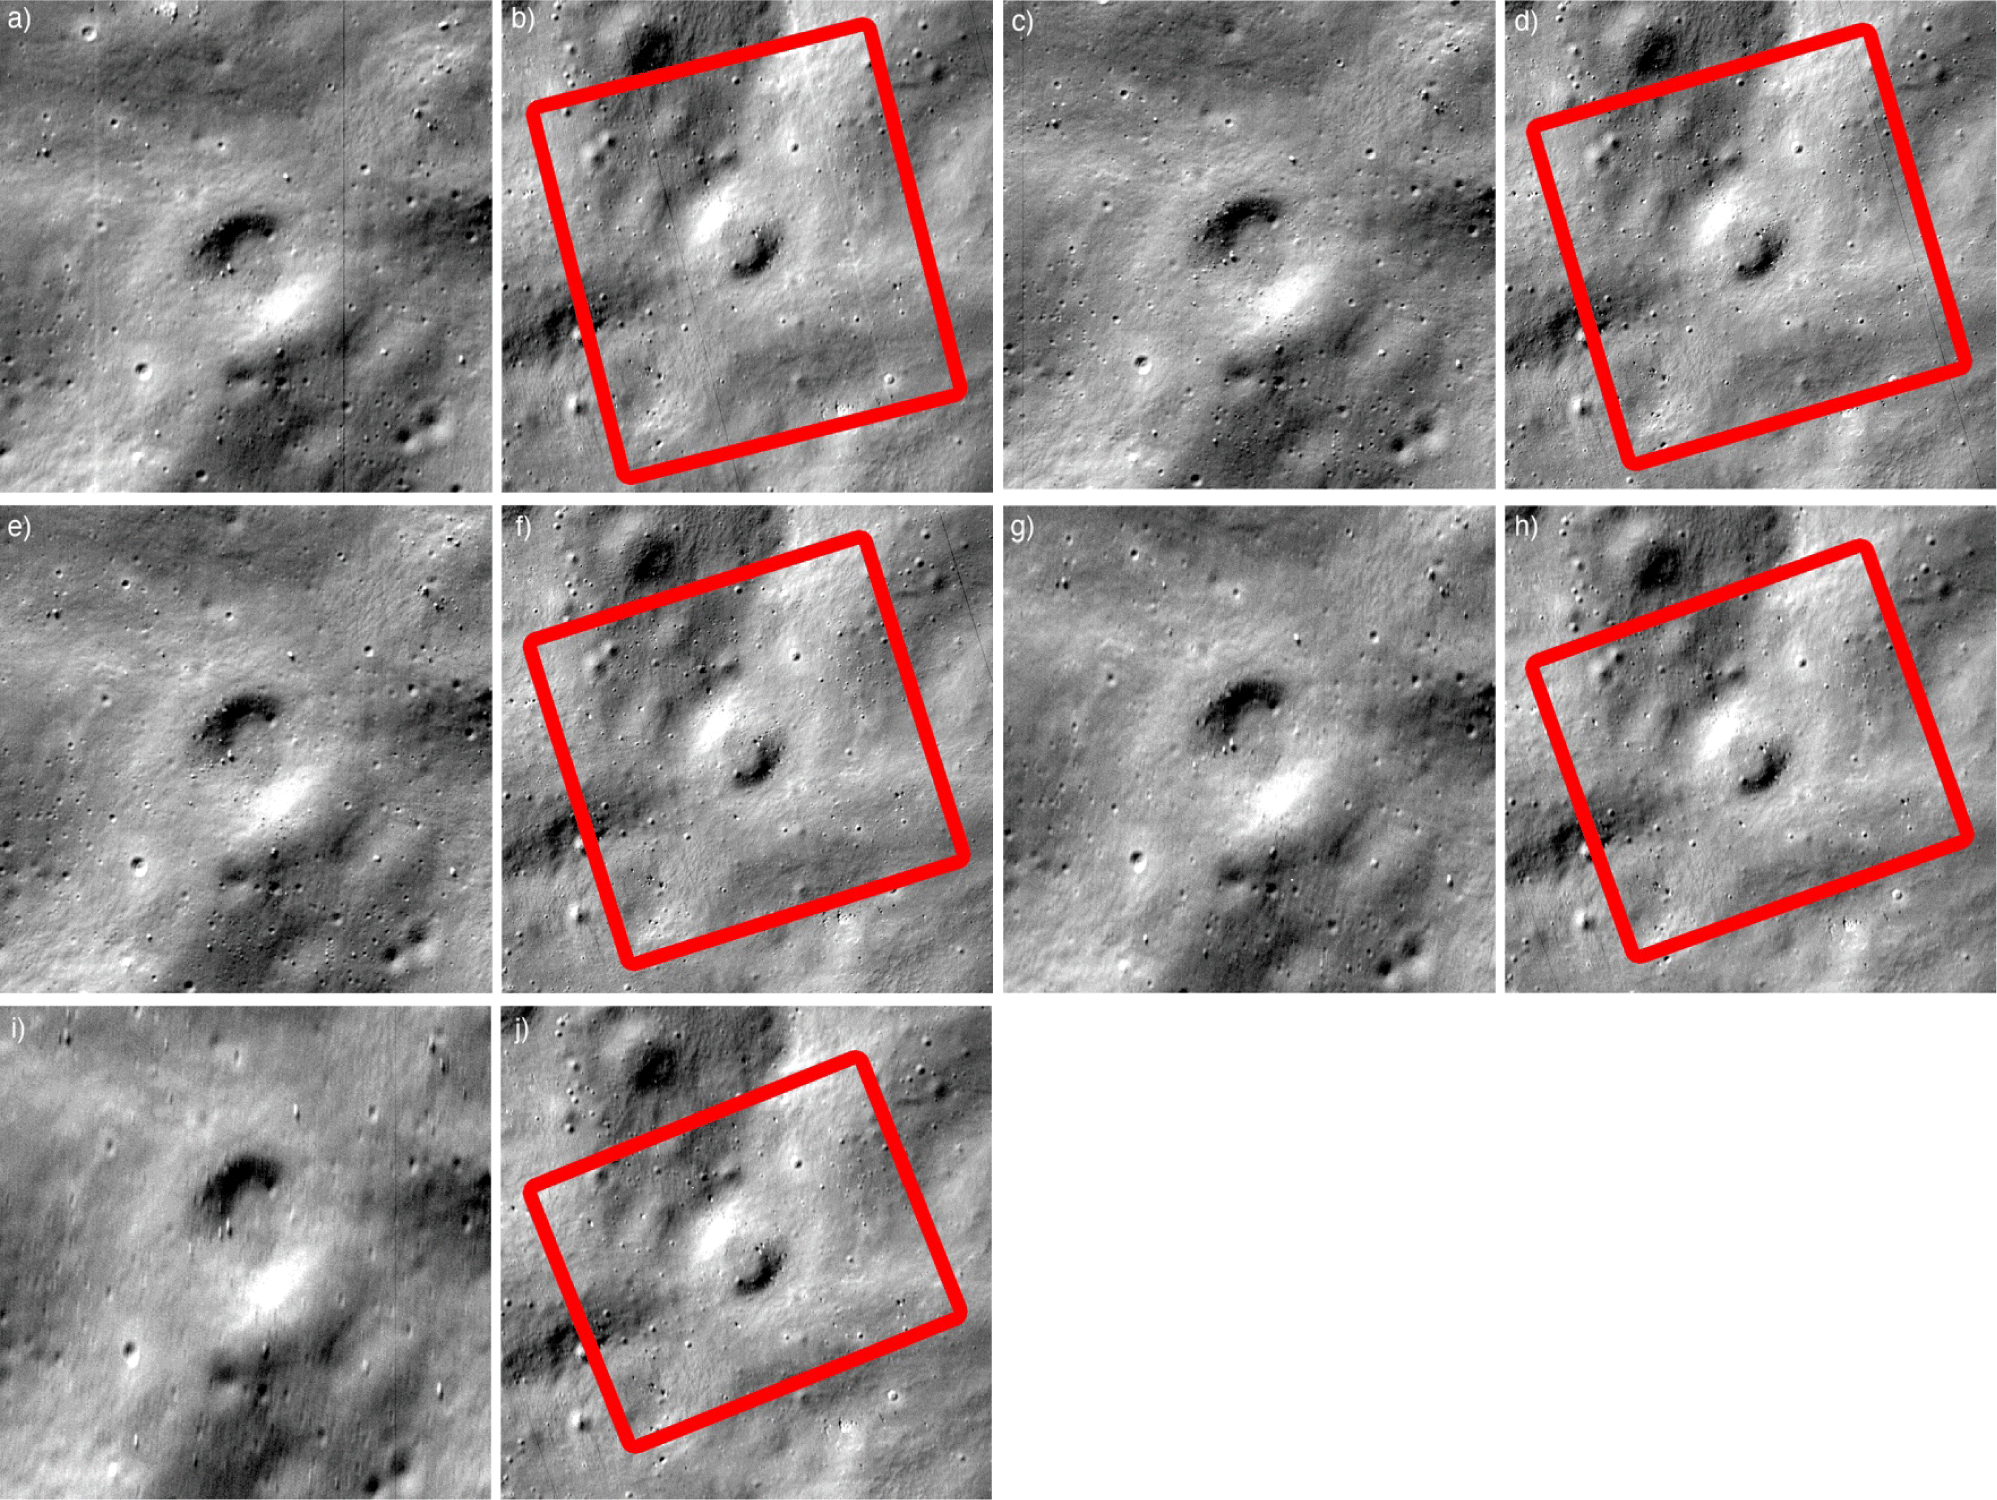
Fig. 13 shows how a down-track smear manifests in the resulting observations. Each frame shows the same region within Shackleton crater collected over a series of eight orbits, with the spacecraft’s altitude remaining steady at between 117.7 and 120.7 km. In Fig. 13(e) and Fig. 13(f), the TDI line time is set to be optimal for the floor region of the crater. The observations above and below have longer (top) and shorter (bottom) line times. The images on the left show the geometrical down-track compressing or stretching of the image and quality reduction due to TDI mismatch smear. The images on the right are map projected so they only show the quality reduction due to the TDI mismatch smear. This quality reduction is very subtle in the map-projected images, even for the top and bottom images with 5 pixels of TDI mismatch smear. Table 3 presents statistics about each observation’s pixel scale and line time.
6. IN-FLIGHT CALIBRATION AND MAPPING
Projecting images (line, sample) to the correct location (latitude, longitude) on the surface or in space (RA, right ascension; Dec, declination) is a multi-step process. First, we need to know the location and orientation of the spacecraft with respect to the target surface. This ephemeris (SPK) and orientation (CK) data is stored in a series of SPICE kernels (Acton 1996). In addition, an instrument kernel (IK) stores the interior orientation parameters (focal length, optical distortion, etc.) discussed in Section 4. Finally, with a frames kernel (FK) containing the camera orientation relative to the spacecraft, which is refined later in this section, a simple pinhole camera model in Integrated Software for Imagers and Spectrometers (ISIS; Anderson et al. 2004; Laura et al. 2022) can be used to translate between images (line, sample) and locations on the Moon (latitude, longitude). This ISIS camera model accounts for sensor motion, lens distortion, and non-linear distortions due to surface topography.
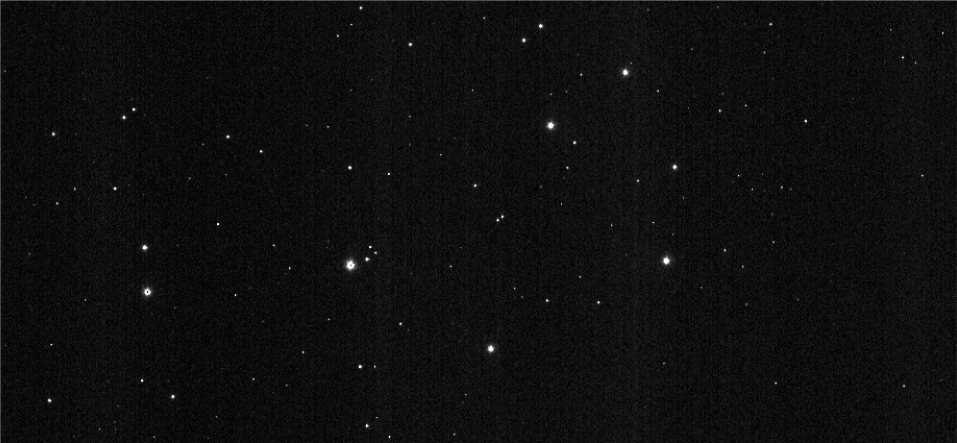
An alignment cube (Fig. 1) was mounted outside the optical structure during instrument assembly. A best effort was made to align the cube with the sensor, which was challenging since the ShadowCam CCD is back-illuminated, meaning no internal structures (e.g., pixel patterns) are visible on the detector. Before flight, the alignment cube was used to measure the orientation of the instrument with respect to the spacecraft bus. During the cruise phase of the mission and while in orbit, the ShadowCam instrument collected a series of star observations. These star observations enabled the first estimate of pointing (boresight direction) and refinement of clocking (rotation of the instrument about the boresight) with respect to the main spacecraft bus. The KPLO spacecraft scanned across the Pleiades star cluster at a fixed rate (Fig. 14), and the line time of the ShadowCam observation was set to match the scan speed. Using the location of the stars in the observations and their known RA and Dec, we could refine the pre-flight pointing estimates based on lab measurements acquired during instrument integration. This assumes that the errors in the spacecraft attitude follow a normal distribution, and the multiple scans across the Pleiades can, therefore, effectively characterize the boresight alignment. Using the relative along-track errors of stars near the same line in the image, we constrained the twist offset to be between 0.1° and 0.3° away from perfect nominal alignment.
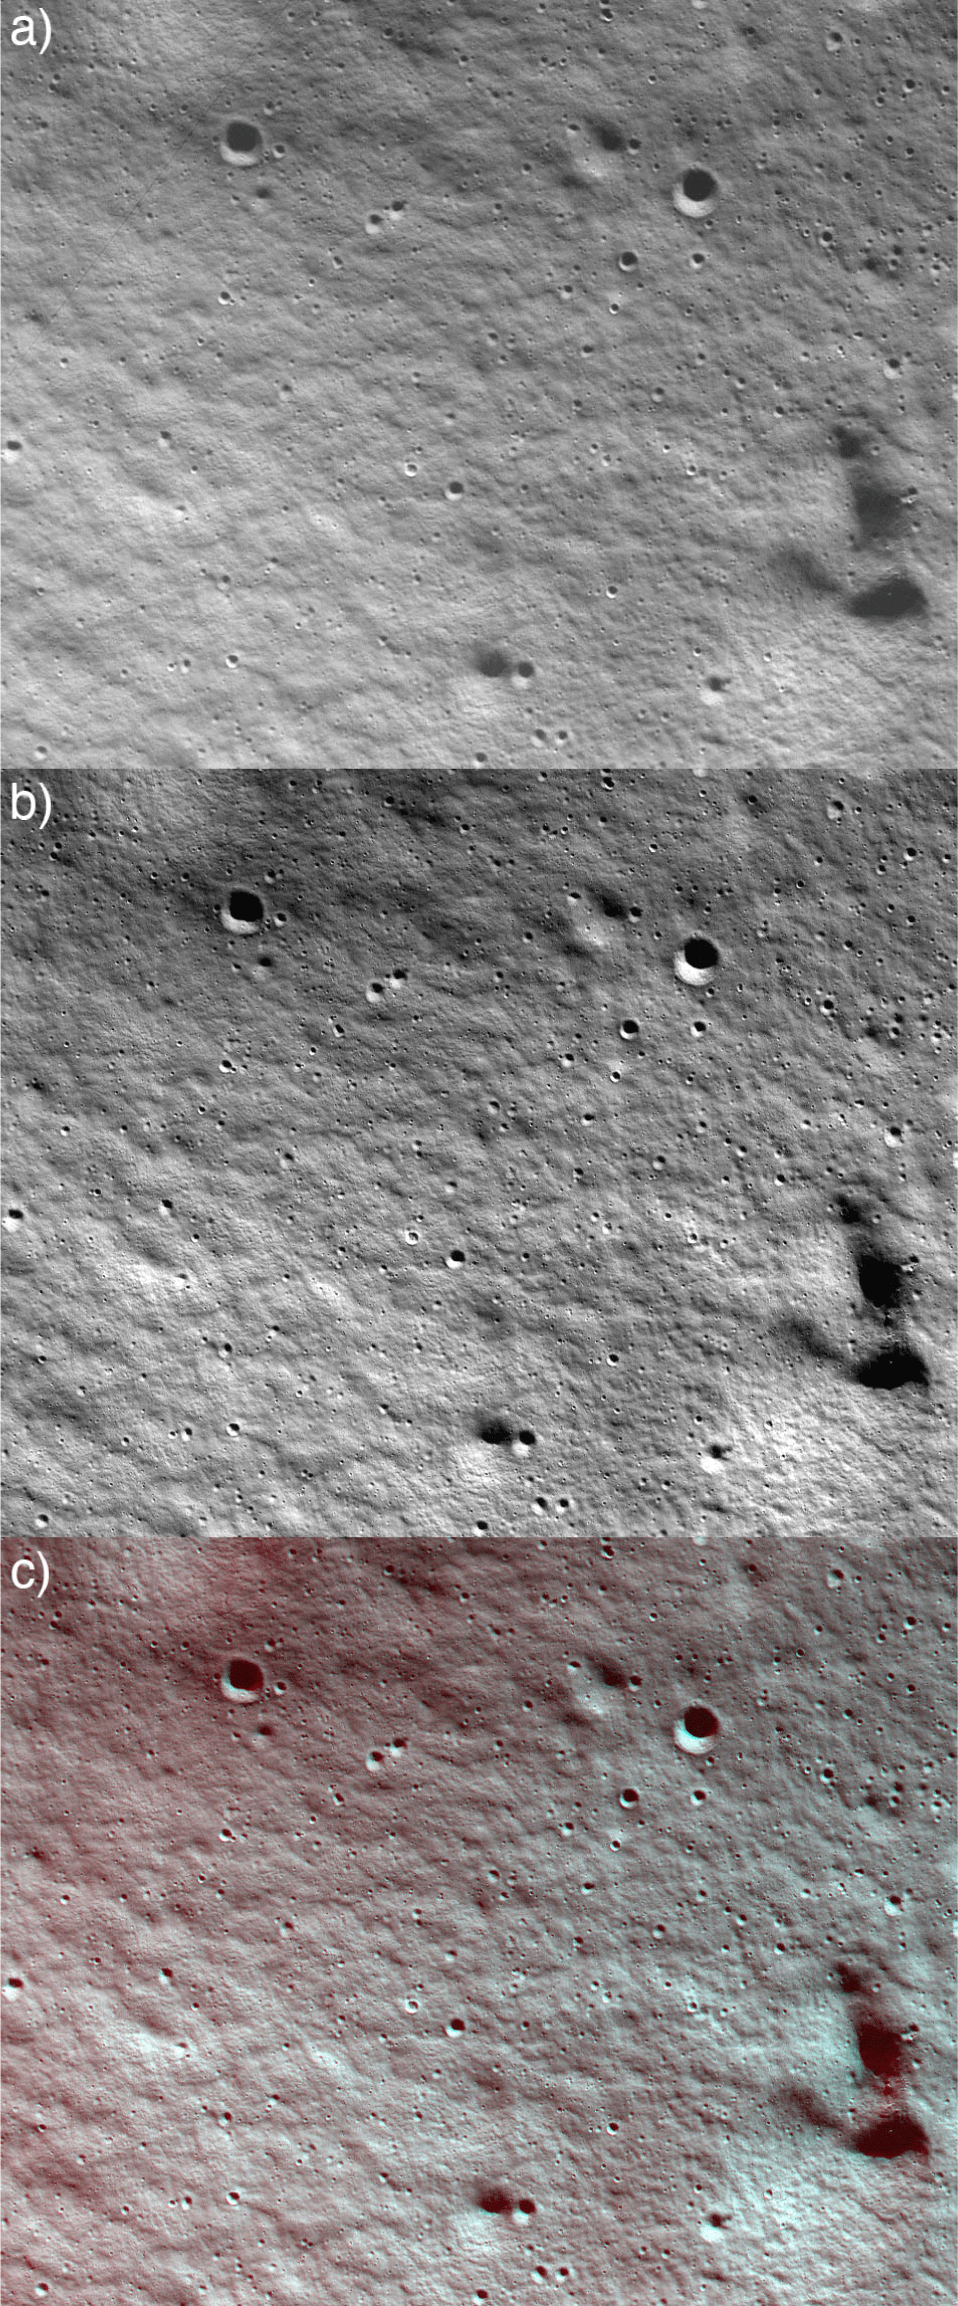
In addition, the ShadowCam instrument can be tied to LROC NAC lunar observations. While the LROC NAC can only collect coarse and low SNR measurements inside the darkest PSRs, the NAC can acquire detailed observations (meter scale, SNR > 60) of illuminated areas, including areas that experience prolonged shadow but are illuminated for part of the year. The LROC NAC instrument underwent extensive pre-flight (Robinson et al. 2010) and in-flight (Speyerer et al. 2016) calibration, and the relative accuracy within an NAC image is less than ½ ShadowCam pixel. ShadowCam and NAC observations that cross with nearly perpendicular ground tracks provide the most accurate geometric comparison. Perpendicular observations allow analysis at the center of the NAC, where the optical distortion is best characterized (< 0.1 pixels). Fig. 15 shows a region near Shackleton crater where this ideal case occurred. A color composite image (Fig. 15(c)) shows the NAC in the cyan channel and the ShadowCam image in the red channel, the ground features line up perfectly, leaving color offsets only due to shadowing differences and not the location of surface features. This comparison confirms the accuracy of the laboratory distortion calibration described in Section 4.
ShadowCam observations were aligned to Lunar Orbiter Laser Altimeter (LOLA) digital elevation models (DEMs), enabling an assessment of an on-orbit timing offset between the nominal image command execution time and the actual time of the first line. For the south pole, we used DEMs with varying pixel scales depending on latitude: 10 m/px for 83–90°S (205 images), 20 m/px for 80–83°S (273 images), and 30 m/px for 75–80°S (39 images). For the north pole, all images used a 20 m/px DEM (178 images). All DEMs used were recently-released adjusted LOLA DEMs with significantly reduced track artifacts (Barker et al. 2021) and a preliminary equivalent product for 80–90°N.
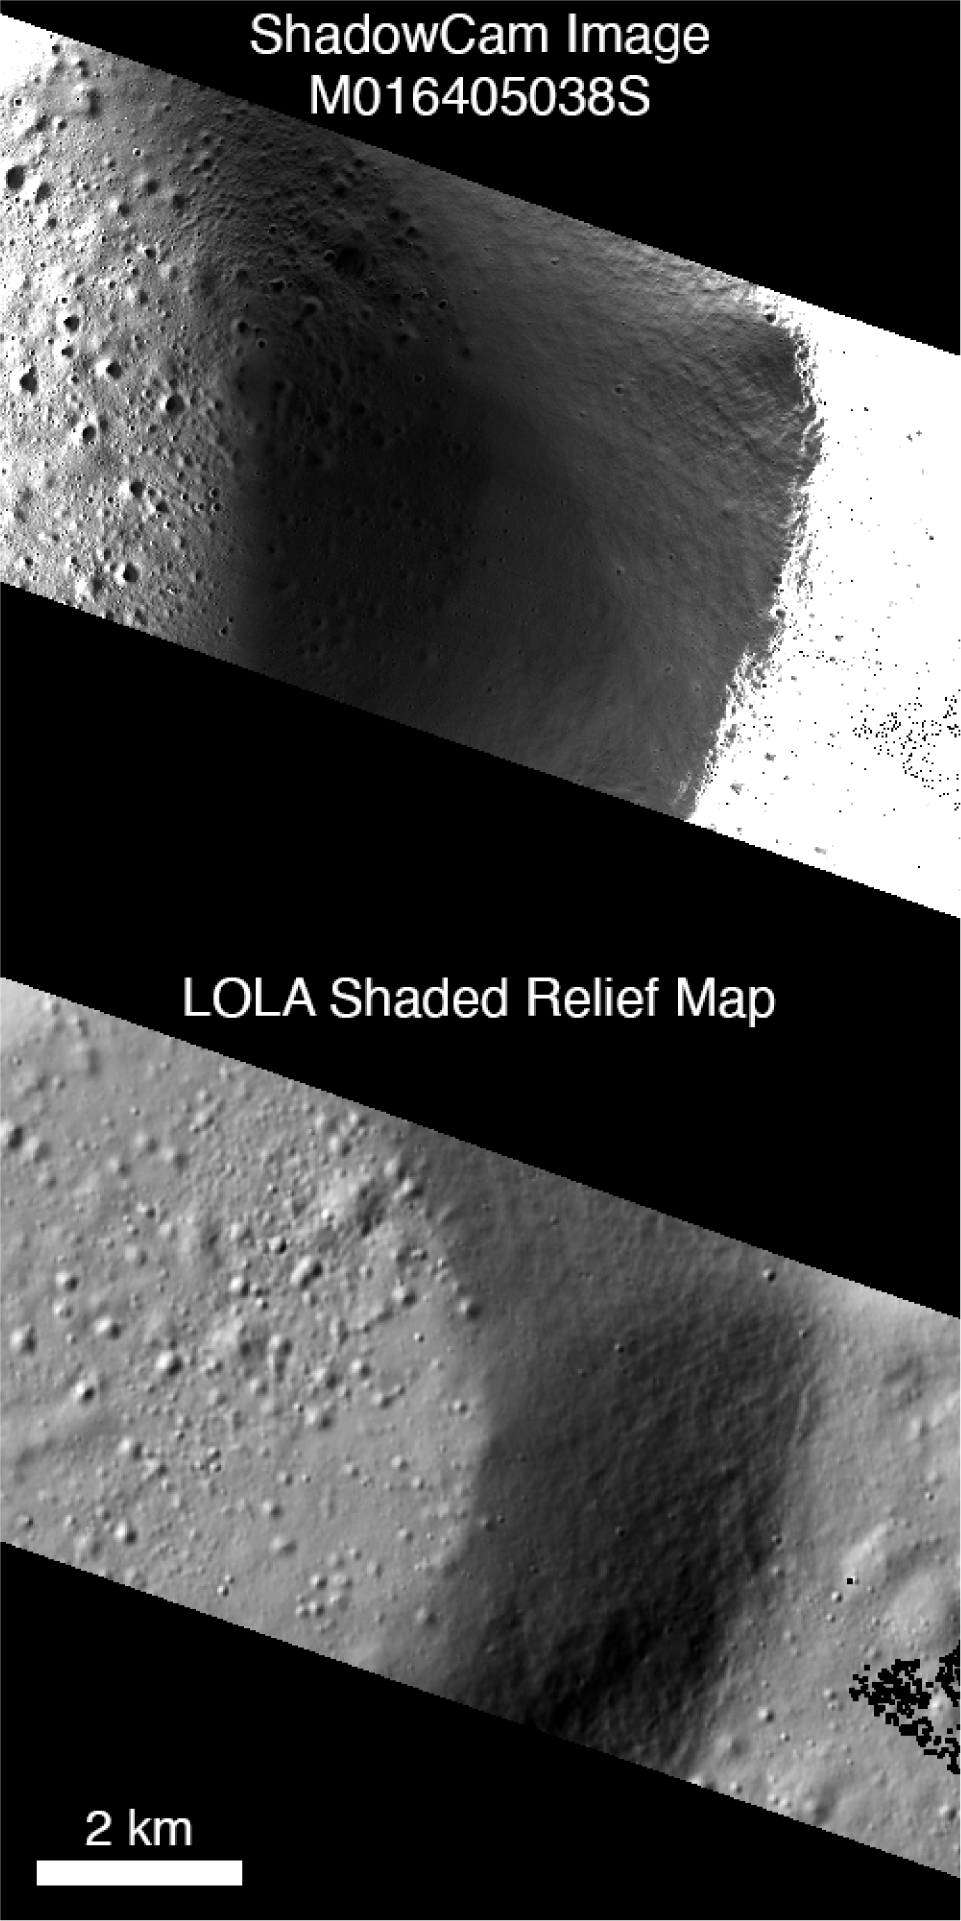
We map-projected ShadowCam observations with backplanes (raw image line and sample) to the same map projection and pixel scale as the LOLA DEM. We then computed a shaded-relief map from the LOLA DEM with lighting direction reversed from the actual Sun direction (approximating the average secondary lighting direction from an illuminated crater rim) when the ShadowCam image was acquired. Next, the ShadowCam image was shifted to align with the shaded relief map using the maximum correlation algorithm in the coreg utility in ISIS to match a sample patch in the ShadowCam to the LOLA based reference. This alignment enabled the registration without identifying the contrast boundaries or edges of individual surface features, which may not be represented in the lower resolution and interpolated LOLA DEM. We then used the shift of the raw image sample and line at an arbitrary location before and after alignment to determine the cross-track and down-track offsets of the image in pixels, which were then converted to angular and timing offsets.
We ran this alignment procedure for a random sample of 2,000 images acquired between 1 January 2023 and 31 October 2023 (including both TDI-A and TDI-B images to deconvolve down-track pointing error and any timing error) and manually inspected blinks between the shifted ShadowCam image and reference LOLA shaded relief image to determine if the alignment was accurate (Fig. 16). Images with > 1-pixel post-alignment offsets or insufficient detail to determine if there was an offset were excluded from the analysis, leaving 695 images. We estimate the alignment accuracy to be ± 1 LOLA pixel, or ~18 m on average. This corresponds to ~0.013 s of down-track travel of the spacecraft. We iterated adjustments to the estimated mounting angles of the camera and the offset between the recorded image start time and actual start time until the mean image offsets for both A- and B-direction images converged on zero.
This comparison revealed that image acquisition consistently started 0.7954s after the recorded start time. This offset was in addition to the correction in the spacecraft clock drift recorded in the spacecraft metadata. We found mounting angle offsets in the roll and pitch directions of 0.04537° and 0.0263°, respectively, with uncertainty on both values of ~0.001°. With these corrections applied, we found that ShadowCam image locations vary by up to ~60 m relative to the LOLA “truth” positions (95th percentile offset), slightly higher in the down-track (~50 m) than cross-track direction (~40 m). This positional variation likely corresponds to uncertainty in the spacecraft position and orientation ephemeris. We expect this overall accuracy to improve as the long-term (one-month) orbit determination results (smithed ephemeris) become available.
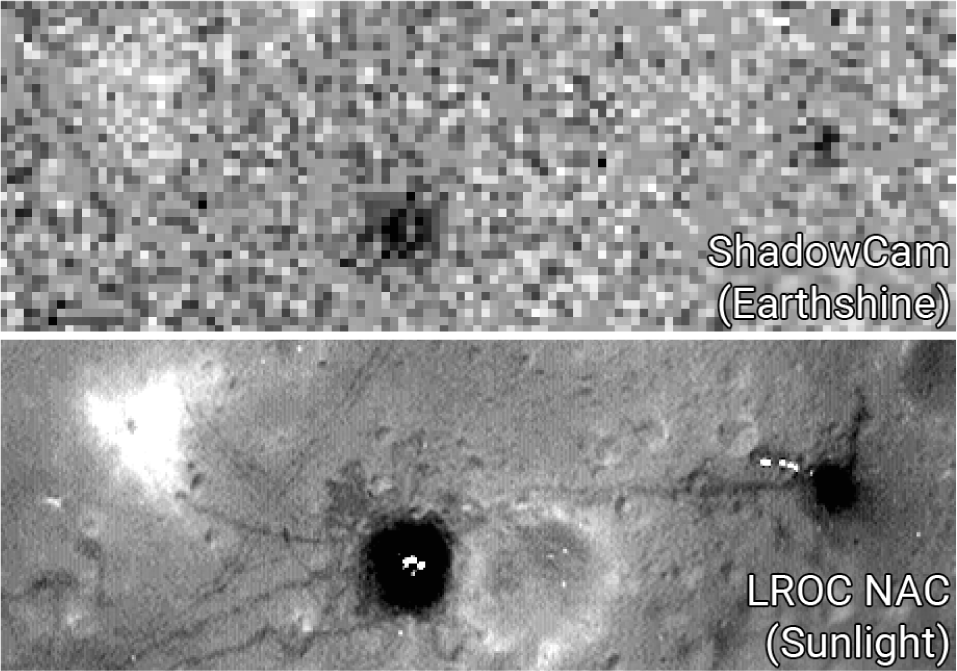
As a final verification, we analyzed images of several Apollo landing sites whose coordinates have high accuracy (Wagner et al. 2017). Images of the sites were acquired when illuminated only by earthshine. Earthshine is relatively dim (Wagner et al. 2023), resulting in lower signal-to-noise ratio images than images acquired of shadowed areas near the poles illuminated under diffusely lit from secondary light. However, the Apollo site images have sufficient signal to allow the identification of the darkened patch of regolith (the result of extensive foot traffic) surrounding the lunar module (LM) descent stages and lunar roving vehicles (LRV; Fig. 17). We calculated the apparent locations of the hardware in ShadowCam images based on the centers of these dark patches and compared them to their proper positions, which are known to within 3 m (Wagner et al. 2017). For four Apollo Earthshine images, the offsets from the known LM and LRV positions (Table 4) range from 5 to 23 m (mean offset 13 m), well within the expected range based on the LOLA alignment estimate.
7. SUMMARY
The ShadowCam instrument provides the highest-resolution views of PSRs near the lunar poles. Here, we characterized the geometric properties of the camera before flight and in orbit, enabling accurate observation placement within the lunar cartographic framework. This work describes the derivation of the internal and external orientation parameters using laboratory observations and images collected during the cruise and commissioning phase of the mission. We identified a radial distortion in the cross-track direction from these observations, which is correctable during our standard calibration pipeline procedures. We also calculated the pointing of the camera relative to the spacecraft bus within ~0.001°. With these models and corrections and the initial ephemeris the KARI provided, ShadowCam images can be aligned within 60 m on the surface (95% confidence interval). This calibration and a precise radiometric model will enable reliable interpretation of ShadowCam images and the development of future derived products, including precisely mapped mosaics and meter-scale DEMs.
This work will aid multi-temporal (before and after) image comparisons, which are crucial for monitoring and analyzing changes within shadowed regions over time. Additionally, the geometric calibration supports the mapping of lunar polar regions, which is essential for planning traverses for future crewed (Artemis III) and robotic (Polar Resources Ice Mining Experiment 1 (PRIME-1)/Intuitive Machines IM-2 Nova-C Lander/Rover/Hopper and the VIPER rover) missions. Such detailed ShadowCam and LROC maps and accurate geolocation capabilities enhance mission safety and efficiency, ensuring successful exploration and utilization of lunar resources in these challenging environments. As more images and updated ephemeris become available throughout the mission, we will refine the geometric calibration and update the SPICE kernels to ensure the highest fidelity mapping products.


