1. INTRODUCTION
In the mesosphere and lower thermosphere (MLT) region, it is widely known that the wind field is closely associated with temperature through the thermal wind balance. Additionally, dynamics such as winds and temperature in this region are easily controlled and varied by waves whose oscillating periods range from a few minutes to annual time scales. Thus, quantifying variabilities affected by various sources is essential to understand the dynamics in the MLT region. Long-term observations are important to investigate the sources of these variabilities and have revealed annual oscillation (AO), semi-annual oscillation (SAO), and quasi-biennial oscillation (QBO). These oscillations, observed for both wind and temperature, are significant features in this region.
In the climatological features of AO, which is prominent at polar regions, amplitudes in the mesosphere are larger than in the stratosphere, and phases in the mesosphere are out of phase with those in the stratosphere (Remsberg et al. 2002; Xu et al. 2007). The AO in the stratosphere is generated by solar heating, while that in the mesosphere might be generated by the filtered gravity waves propagated through AO in the stratosphere (Mayr et al. 2010). Especially in the equatorial region, SAO is an important oscillating feature and has peaks in the stratosphere and mesosphere (Remsberg et al. 2002). The forcing mechanism of equatorial SAO helps to understand the diverse features in the meridional plane. As the Sun passes the equator twice a year, SAO can be generated by momentum advection from the summer to winter hemisphere (Hirota 1980; Holton & Wehrbein 1980). However, this process seeks to reproduce the stratospheric SAO. Therefore, an interaction between wave and background flow is necessary to generate the equatorial SAO in the stratosphere. As Hopkins (1975) and Hamilton et al. (1995) noted, planetary waves propagating in the meridional direction and westward traveling atmospheric gravity waves (AGWs) contribute to the westward acceleration of wind in SAO in the stratosphere. The phase of the westward wind might be induced either by the momentum of westward gravity waves that have passed through the eastward wind field formed in the stratosphere by gravity wave wind filtering, and by the influence of fast Kelvin waves (Hirota 1978; Andrews et al. 1987).
However, due to limited observations, the generating mechanism of SAO in the mesosphere has been insufficiently studied compared to SAO in the stratosphere. A widely adopted conception is that selectively filtered AGWs and Kelvin waves by SAO in the stratosphere generate the mesospheric SAO with out-of-phase features.
In the polar regions, long-lasting observation is more challenging than in the equatorial region, especially in Antarctic region, leading to a lack of long-term monitoring of the polar SAO. In this paper, we present the SAO features in both neutral winds from two meteor radars (MRs) and pressure from microwave limb sounder (MLS) onboard Aura satellite, and suggest their possible sources. In addition, we also discuss a hemispheric asymmetry of SAO probably due to the westward field formation in the MLT region.
2. DATA ANALYSIS
In this study, MRs located at King Sejong Station (KSS; 62.22°S, 58.78°W) and Esrange (67.90°N, 21.10°E) are used to obtain the neutral horizontal winds in the MLT region. Specifications of both MRs are described in Kam et al. (2019). The horizontal winds are derived from radial velocities of meteor echoes within a height-time block of 2 km and 1 h. The radial velocity is computed from at least six echoes in each height-time block using the least square method, and the meteor echoes utilized for this analysis were adopted only when the absolute difference between projected and observed radial velocities was less than 25 m/s (Holdsworth et al. 2004). As shown in Fig. 1, the datasets of zonal winds observed from both MRs are daily mean winds as a function of altitude in the MLT region. For KSS MR, the wind profiles range from 80–100 km with a height resolution of 2 km and for Esrange MR the data are sampled from 82–97 km with a height resolution of 3 km.
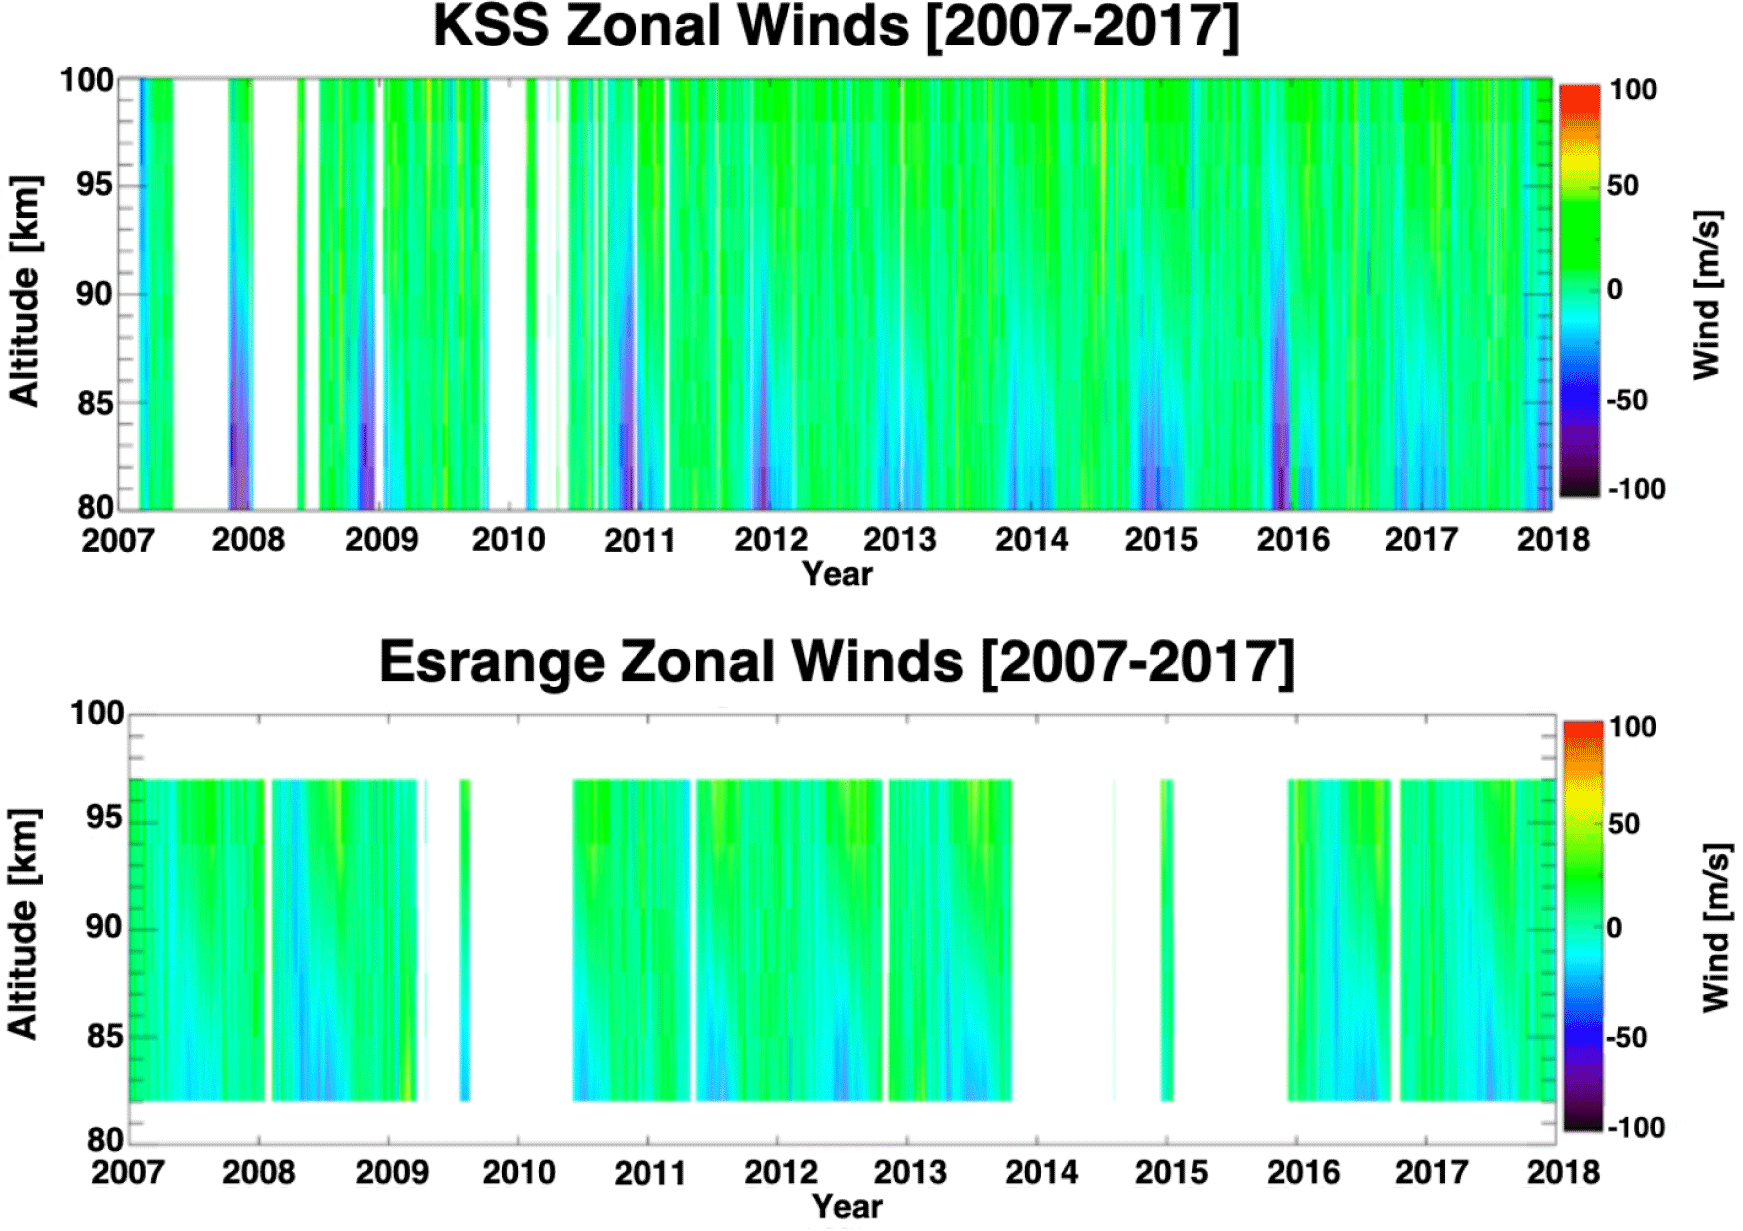
Note that there are some gaps in both datasets, mostly caused by the instrumental malfunction. The zonal winds from both MRs show typical features of strong seasonal variations with the formation of a westward wind field in summer and an eastward wind field in winter over the MLT region. From the clear variations of both zonal winds in Fig. 1, it can be expected that the AO signals will appear strong whereas it is difficult to discern the SAO signal.
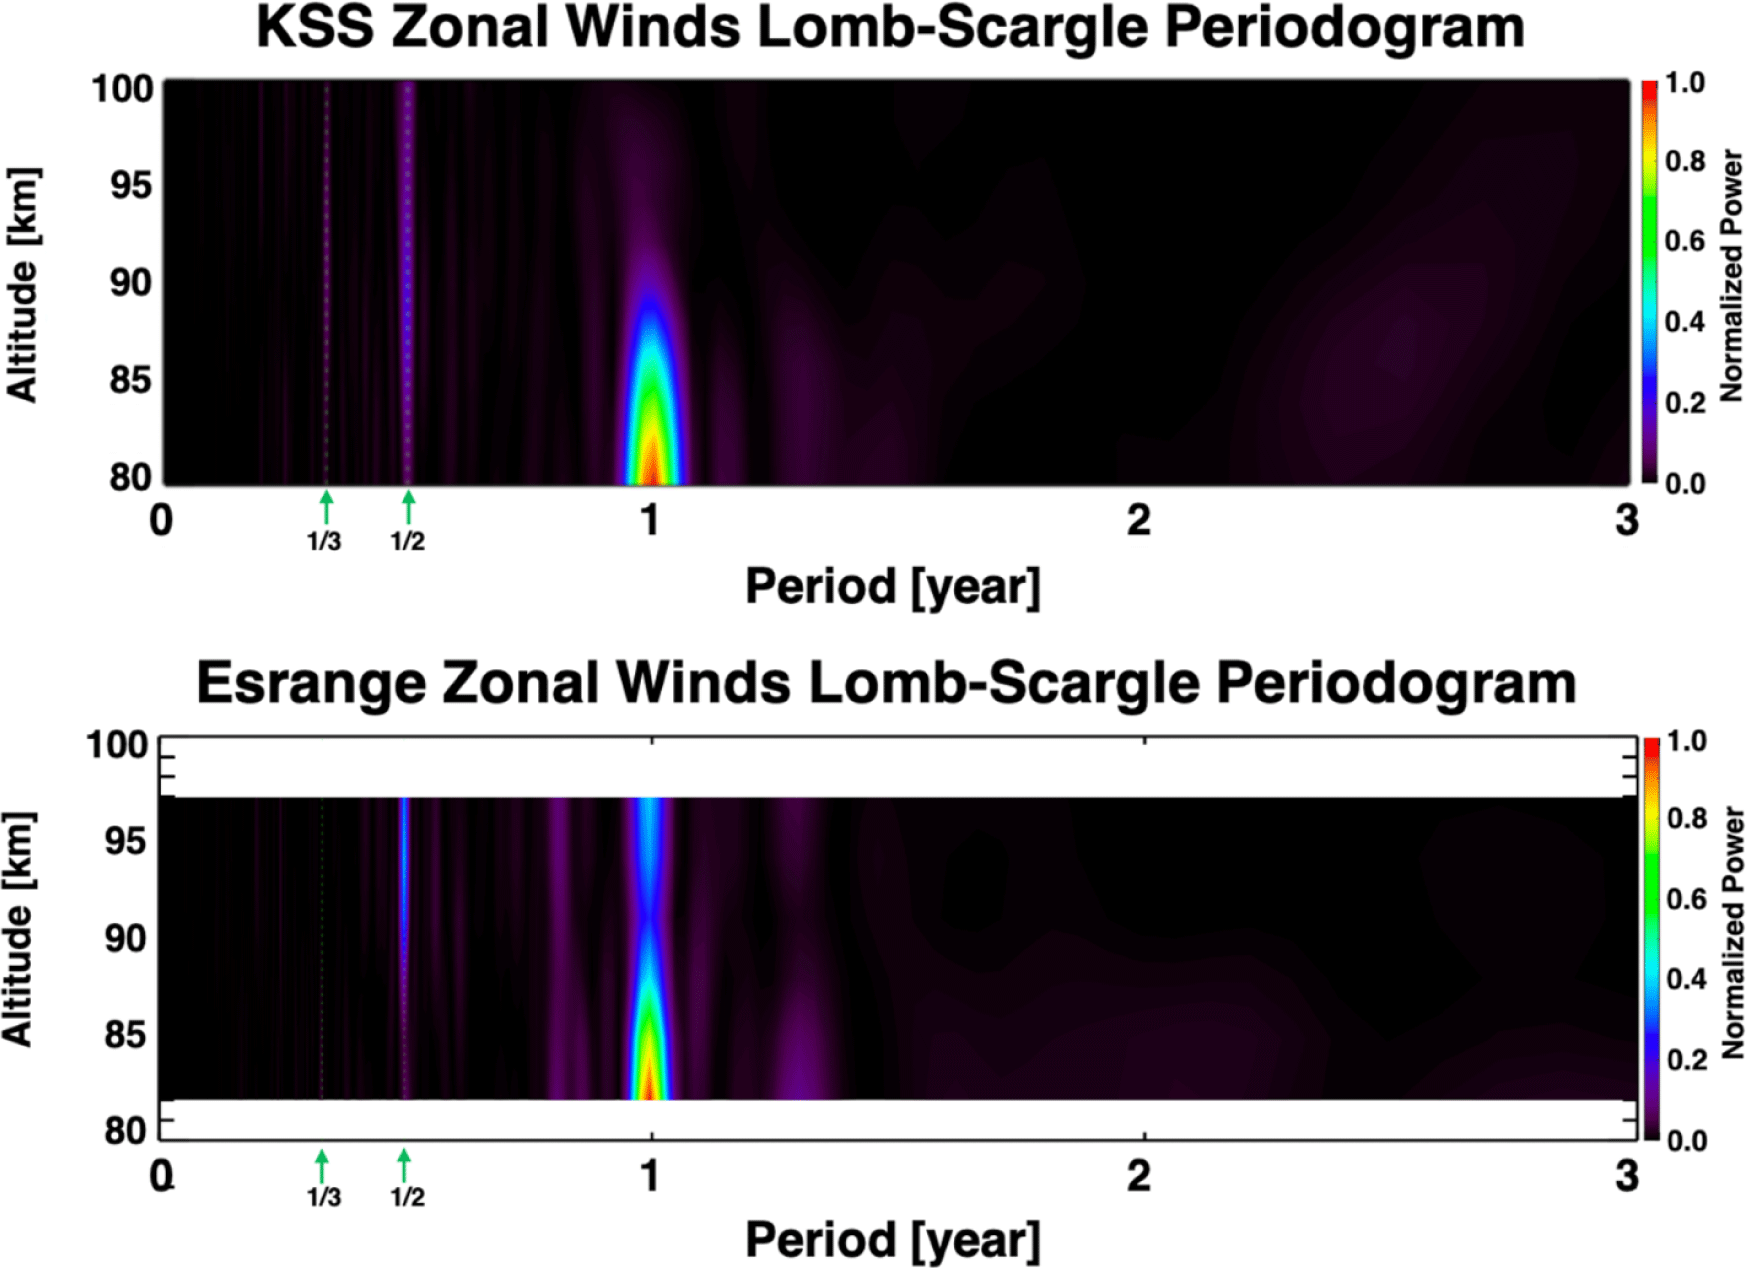
To examine a periodicity of the variations in long-term zonal winds, we computed the Lomb-Scargle periodogram (Fig. 2), which is effective for the datasets including the periods of data gaps. As expected, the AO with 1-year period are the strongest, and the second strongest peak appears exactly at a period of 365/2 (= 182.5) days, considered as SAO in the MLT region at both sites. In the case of KSS, it seems noteworthy that significant ter-annual oscillation (TAO) with a period of 365/3 (= 122.667) days clearly appears in all height range, showing relatively stronger amplitude in the range of 85–95 km altitude. In this study, not only the AO and SAO, but also the TAO power from the spectral analysis exceeded the 95% significance level. While the TAO has been rarely mentioned in previous studies (Krebsbach & Preusse 2007; Shuai et al. 2014; Chen et al. 2019), a recent study by Chen et al. (2019) revealed that the TAO is not a product of an independent generating mechanism but is likely due to the pulse-like occurrence of the subtropical convective AGW source. The subtropical region has an ‘active’ phase of strong convection for four months and a relative ‘calm’ phase for the remaining eight months. Their spectral analysis revealed an enhanced harmonic of the annual cycle with a strong TAO component. As a result, TAO emphasizes the convective sources concerning broader maxima on global coupling in the winter polar vortex. Therefore, the occurrence of TAO indicates the poleward propagating AGWs from the convection in subtropical region up to about 70° latitude near the altitude of 90 km where large momentum flux are transferred. Likewise, the TAO feature observed at KSS might be caused by the convective AGWs generated during the four-month-long ‘active’ phase of strong convection from the subtropical region. Notably, every signal of AO, SAO, and TAO varies concerning height. Over KSS, significant AO power appears up to an altitude of 90 km, and the power of SAO and TAO is shown between 85 km and 95 km. In the case of Esrange, the power of AO decreases up to 90 km, similar to KSS; however, the AO power increases above 92 km. The vertical variation of SAO power in Esrange is similar to that of KSS, and the TAO signal in Esrange is not visible in the periodogram in Fig. 2. Therefore, it may imply that dynamical variabilities in the MLT region will cause different results depending on the altitude region or observing sites.
To investigate the strength of those periodic oscillations, we computed amplitudes for various periods from 100 d to 500 d using wavelet analysis. The wavelet analysis requires continuous datasets, so we replaced the blank observation period with climatological MR zonal winds calculated using the data during the observation period for each site. To calculated the climatological MR zonal winds, wind data during periods with abnormal signals, such as large phase offset or low SNR in returned meteor echo signals, which result in unreliable wind estimation, were rejected. Consequently, to calculate the climatological wind, we performed a composite average, excluding anomalous periods such as sudden stratospheric warming (SSW) events. In the case of the Northern hemispheric high latitude, major SSW events occurred on 2009 (January 21), 2010 (January 24), and 2013 (January 6). When calculating the climatological MR zonal winds for Esrange, wind data within ± 2 days of the SSW events were excluded from the analysis.
Fig. 3 shows the spectral results for zonal winds in units of amplitude from wavelet analysis, and the three main periodic components of AO, SAO, and TAO are clearly visible as seen in Fig. 2. Analyzed periods varying between 100 and 500 days show not only the three main components but also minor components with much lower amplitudes. The powers of these minor components and TAO vary according to seasonal variation, and their structures are more complex in Esrange.
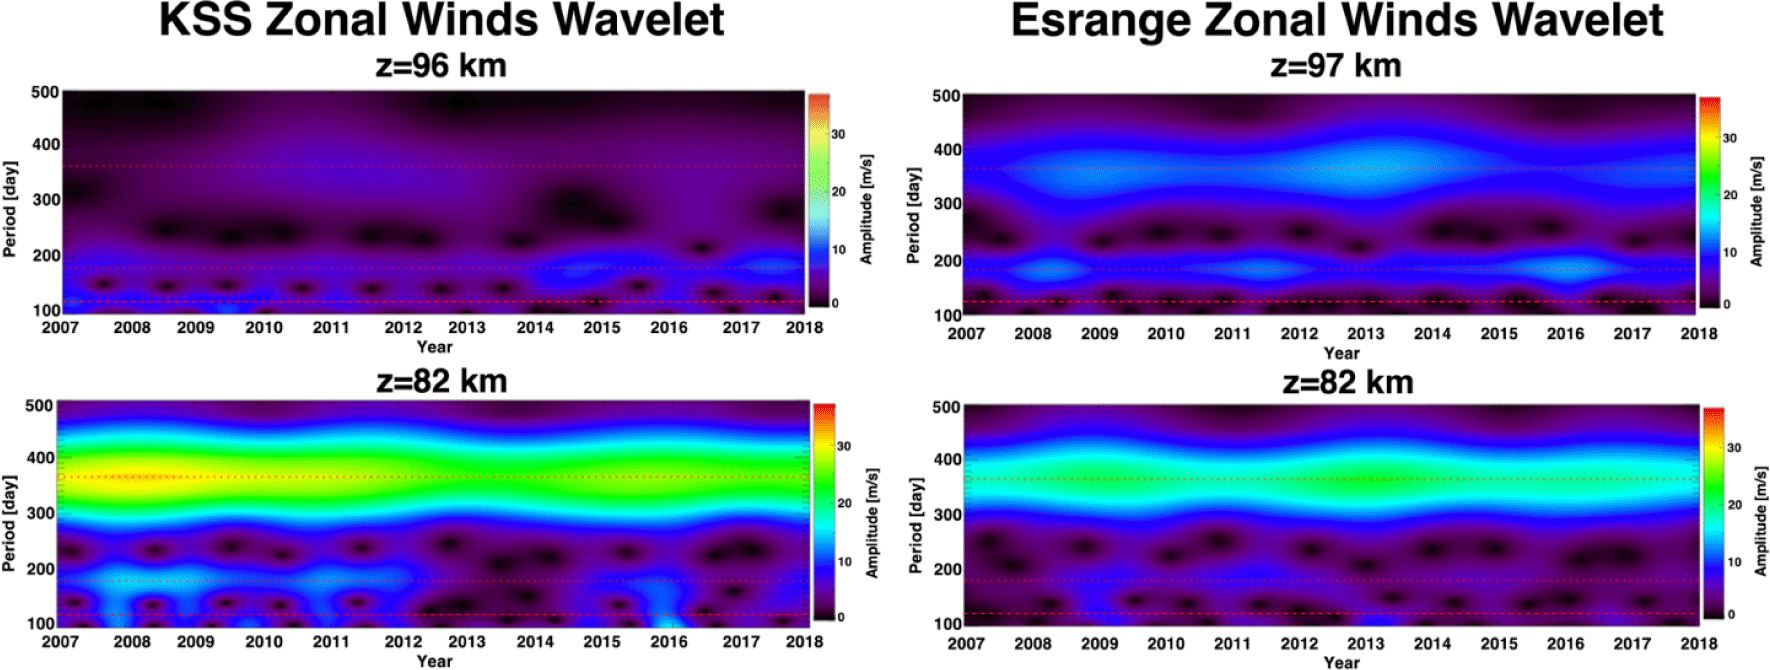
At lower regions (z = 82 km) below the mesopause, AO has maximum power among others in KSS and Esrange, and its power and broadening centered at the period of 1 year are larger in KSS than Esrange. However, at upper regions (z = 96 km or 97 km) above the mesopause, SAO power seems to be comparable with AO power in both sites, similar to the results of the lomb-scargle periodogram in Fig. 2. Especially, only at higher regions at an altitude of 96 km at KSS, the power of AO is much lower than that of SAO. This may imply that the dynamical processes around the mesopause are very complicated and affected by several factors such as the westward wind during summer, upward propagation of AGWs interacting with background mean flow, and dissipations of AGWs.
The Aura satellite, launched on July 15, 2004, is part of NASA’s ‘A-train’ satellite group. This satellite has been observing Earth’s atmosphere since August 13, 2004. The Aura satellite operates in a sun-synchronous orbit at an altitude of 705 km with an orbital inclination of 98°. It performs global observations and revolves around the Earth approximately 14 times a day. The ascending node of the satellite crosses the equator at 13:45 ± 15 min in solar local time. The latitudinal coverage of this satellite extends from 34° in one hemisphere to 80° in the other, due to the instrument’s viewing direction being 90° from the direction of the satellite’s motion and the orbital inclination. The primary scientific objectives of the Aura mission are to investigate the recovery of stratospheric ozone chemistry after depletion, measure ozone pollution in the upper troposphere, and study climate change processes throughout the atmospheric layers. The MLS loaded on the Aura satellite is an instrument that monitors the thermal emission of microwaves in the limb of the Earth’s atmosphere. The MLS performs limb scanning every 24.7 s from the surface of the Earth to the altitude of approximately 90 km and provides the vertical structures of atmospheric constituents, temperature, pressure, and ice particles.
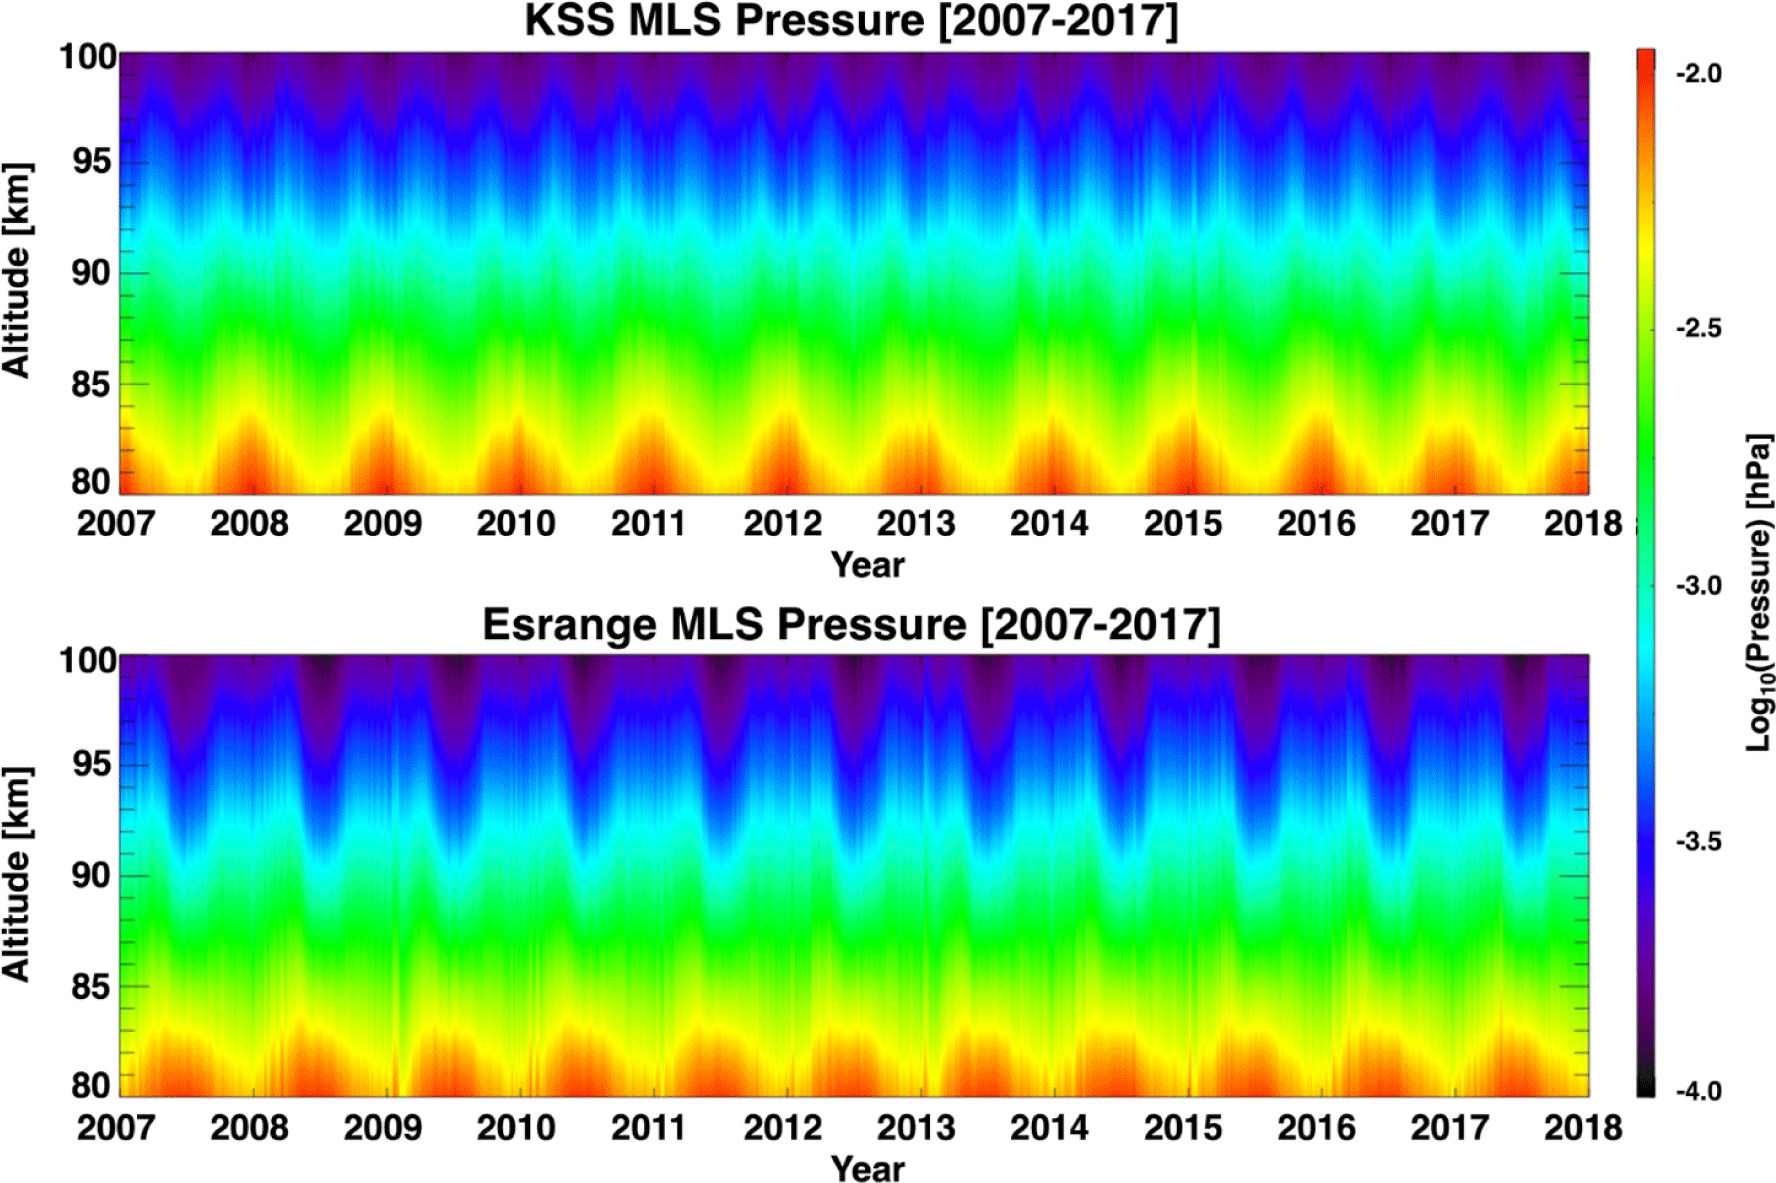
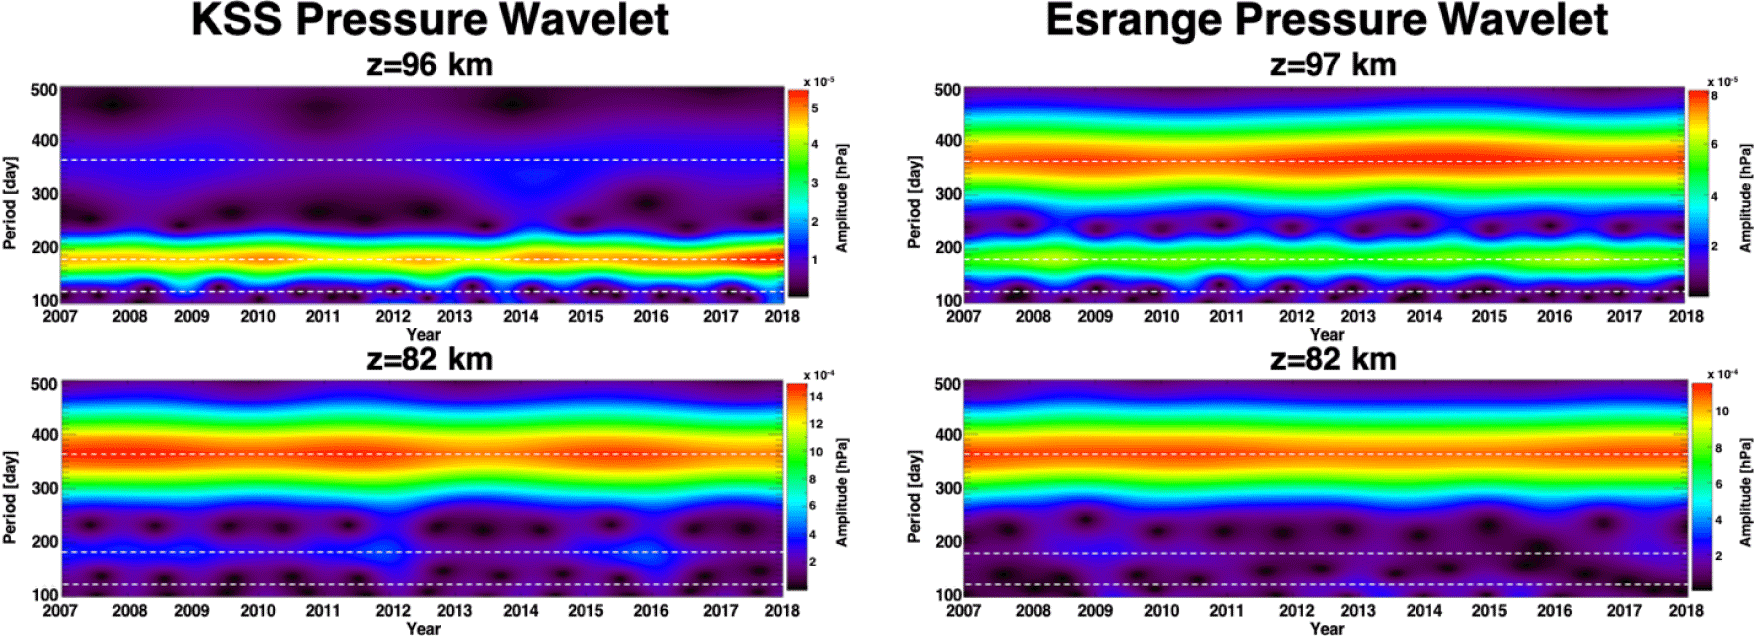
Fig. 4 shows daily mean MLS atmospheric pressure profiles in the altitude range from 80 km to 100 km for the locations of KSS and Esrange. In order to sample as many pressure profiles as possible, these daily mean pressure profiles were calculated using the profiles within ± 5° in latitude and longitude for the locations of KSS and Esrange. Atmospheric pressures in time series have significant variations over both sites during the period of 2007–2017. At both sites, oscillating periods of the variations show differences between altitudes above and below approximately 90 km where the mesopause is located. Below an altitude of 85 km, it is visible that there is strong AO signal in the atmospheric pressure. Above an altitude of about 90 km, the SAO signal is noticeable for KSS, showing low pressures in two solstices (summer and winter) and high pressures in two equinoxes (spring and fall), while the SAO signal over Esrange seems to exist but relatively faint because of the large difference between the pressures in summer and winter. In order to compare with the result of wavelet analysis for zonal winds, we also performed the wavelet analysis for the MLS atmospheric pressure with same manner as shown in Fig. 5. From the results of wavelet analysis for the pressure, distinctive features are generally consistent with those in zonal winds, showing strong AO and SAO signals but the signals of TAO are hardly detected at both sites.
3. RESULTS AND DISCUSSIONS
The characteristics of periodic oscillation in pressures (Fig. 5) have similarities with those in winds (Fig. 3). First, the relative powers of SAO increase with altitude, making it comparable or superior to those of AO. In particular, AO powers above the mesopause over KSS are much lower than SAO power. Second, the power of AO at an altitude of 82 km in KSS is much larger than in Esrange, while this feature inverts at 96 km (97 km) with larger power in Esrange than in KSS. Third, in the summer, the temporal distribution for significant signals of enhanced SAO and TAO almost coincides, especially in the periods of 2008–2009, 2011–2012, and 2015–2016 at 82 km over KSS. According to these oscillating similarities in zonal winds and pressures, it can be deduced that these two dynamic properties are closely related in the MLT region.
For an intuitive interpretation of AO and SAO, we derived the ratio of their amplitudes. The ratio is calculated in logarithms as Log10 (AO amplitude / SAO amplitude). If the power of AO is smaller than that of SAO, the ratio is computed as a negative value. However, since pressure decreases with altitude, this ratio is difficult to grasp the structure of dominance with overall altitude, and direct comparison with the ratio in winds is also difficult. Therefore, we derived a normalized ratio that can directly reveal which is larger amplitude between AO and SAO, as shown in Fig. 6.
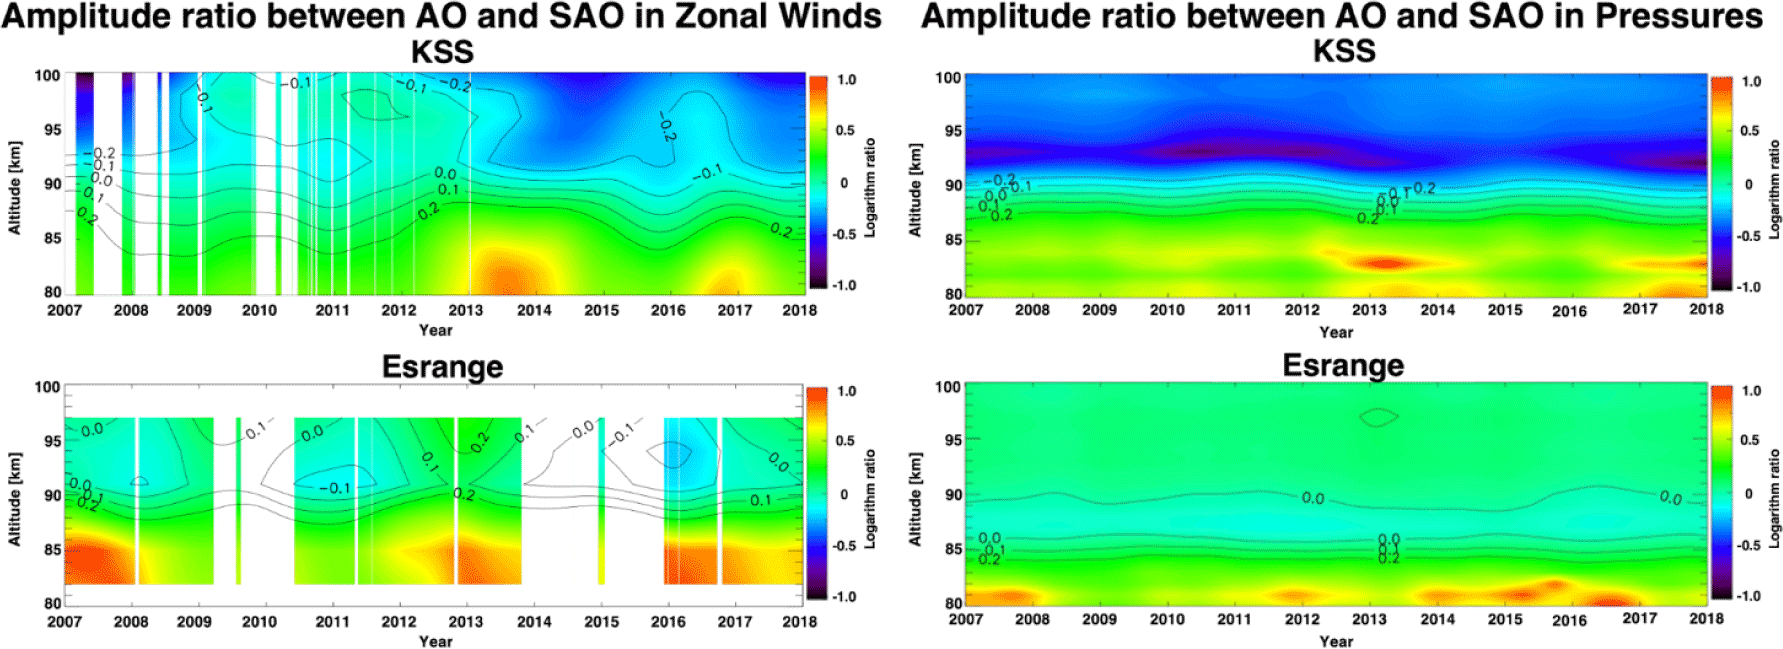
As expected, the time-height distributions of the ratio are similar between the two dynamical properties at each site. Usually, the layers where the ratio is inverted or has a magnitude of zero are around an altitude of 90 km where the mesopause is located. Above 90 km, SAO amplitudes at KSS are significantly larger than AO amplitudes, while Esrange shows that the amplitudes of AO are comparable to those of SAO. In other words, as shown in Fig. 2, AO amplitude at KSS attenuates with increasing altitude, while the amplitude at Esrange decreases up to an altitude of 90 km but increases above 90 km.
There is a hemispheric asymmetry of AO and SAO in neutral winds observed from KSS and Esrange, and pressure. Especially, dynamics in the MLT region have large variabilities; their features may therefore appear differently depending on the location. To compare wind patterns between KSS and Esrange, we computed long-term mean zonal wind from MR, as shown in Fig. 7.
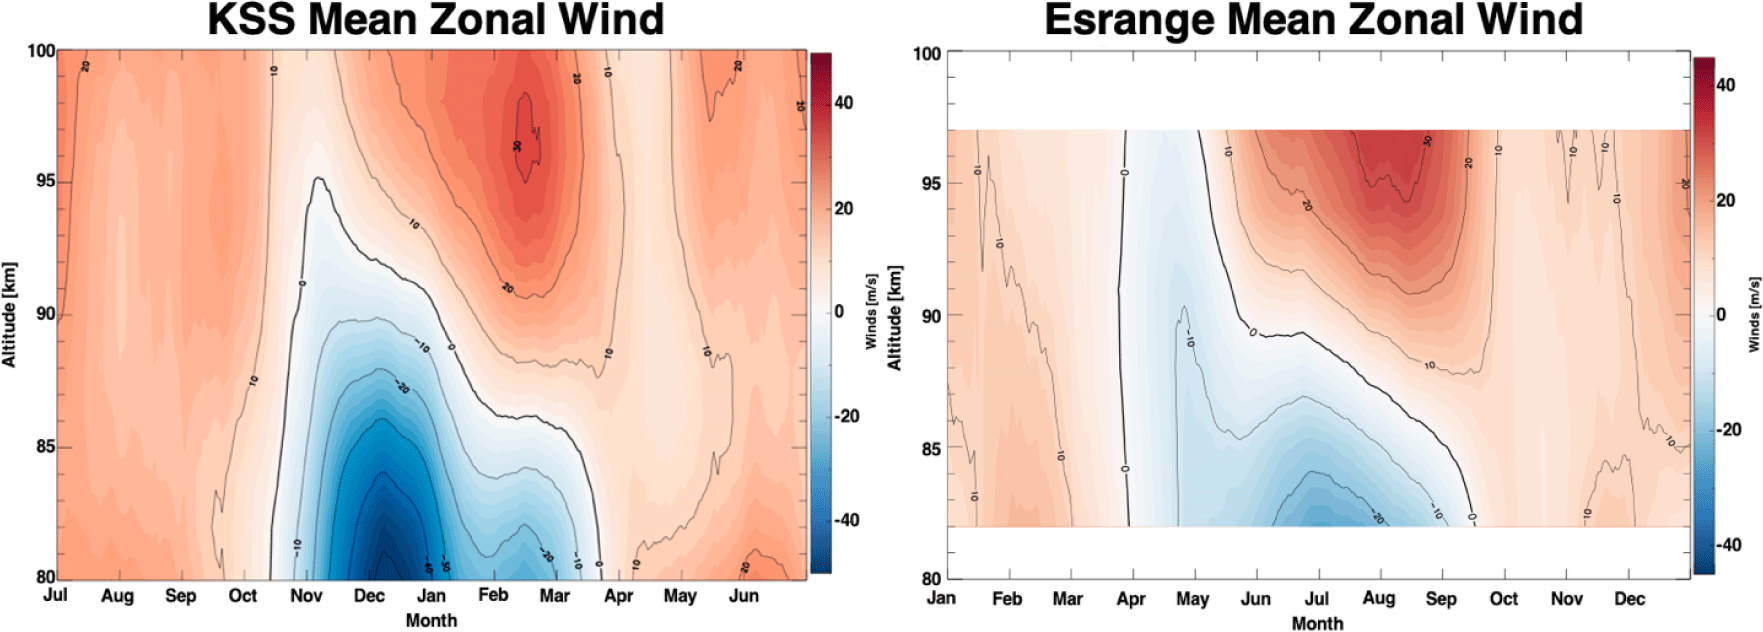
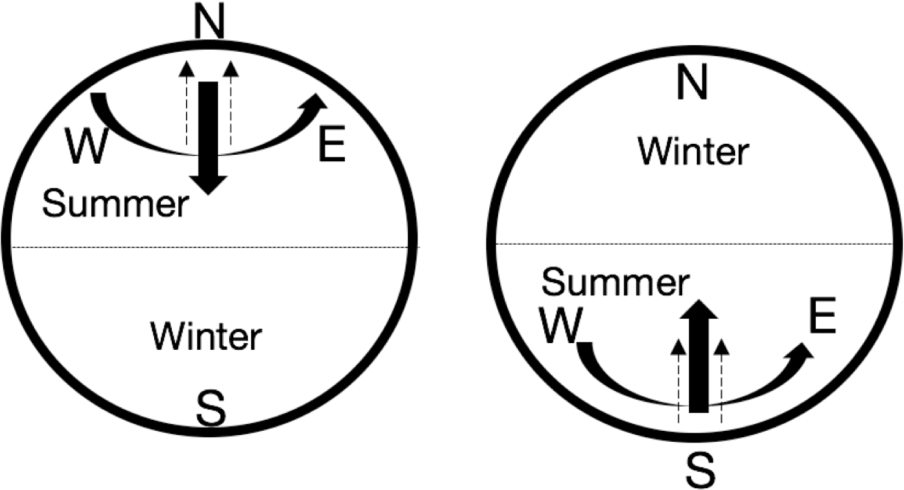
At both sites, the mean winds show dominant eastward wind fields in the MLT region throughout the year, except summer when there is a strong westward wind field. The magnitudes of eastward wind fields at both sites are similar, with wind speeds of 20 m/s. However, the maximum magnitude of westward wind speed in summer is about 50 m/s and 30 m/s at KSS and Esrange, respectively. Therefore, these westward winds below the mesopause may induce strong AO signals in winds, with larger power at KSS than at Esrange. Above the mesopause, strong eastward wind fields result from the eastward AGWs forcing by westward wave filtering below the mesopause. Therefore, the SAO signal in wind above the mesopause is caused by two peaks of eastward wind in summer and winter. Above all, in summer, these generated eastward winds are induced by AGWs forcing, becoming a factor that causes significant consequences in the dynamics of MLT region. As shown in Fig. 8, above the mesopause in summer, the Coriolis force acts on the eastward winds, generating equatorward circulation (residual circulation). Consequently, upward transport occurs to recover the depletion due to equatorward transport, then generating an adiabatic expansion which leads to a drop in temperatures and pressures.
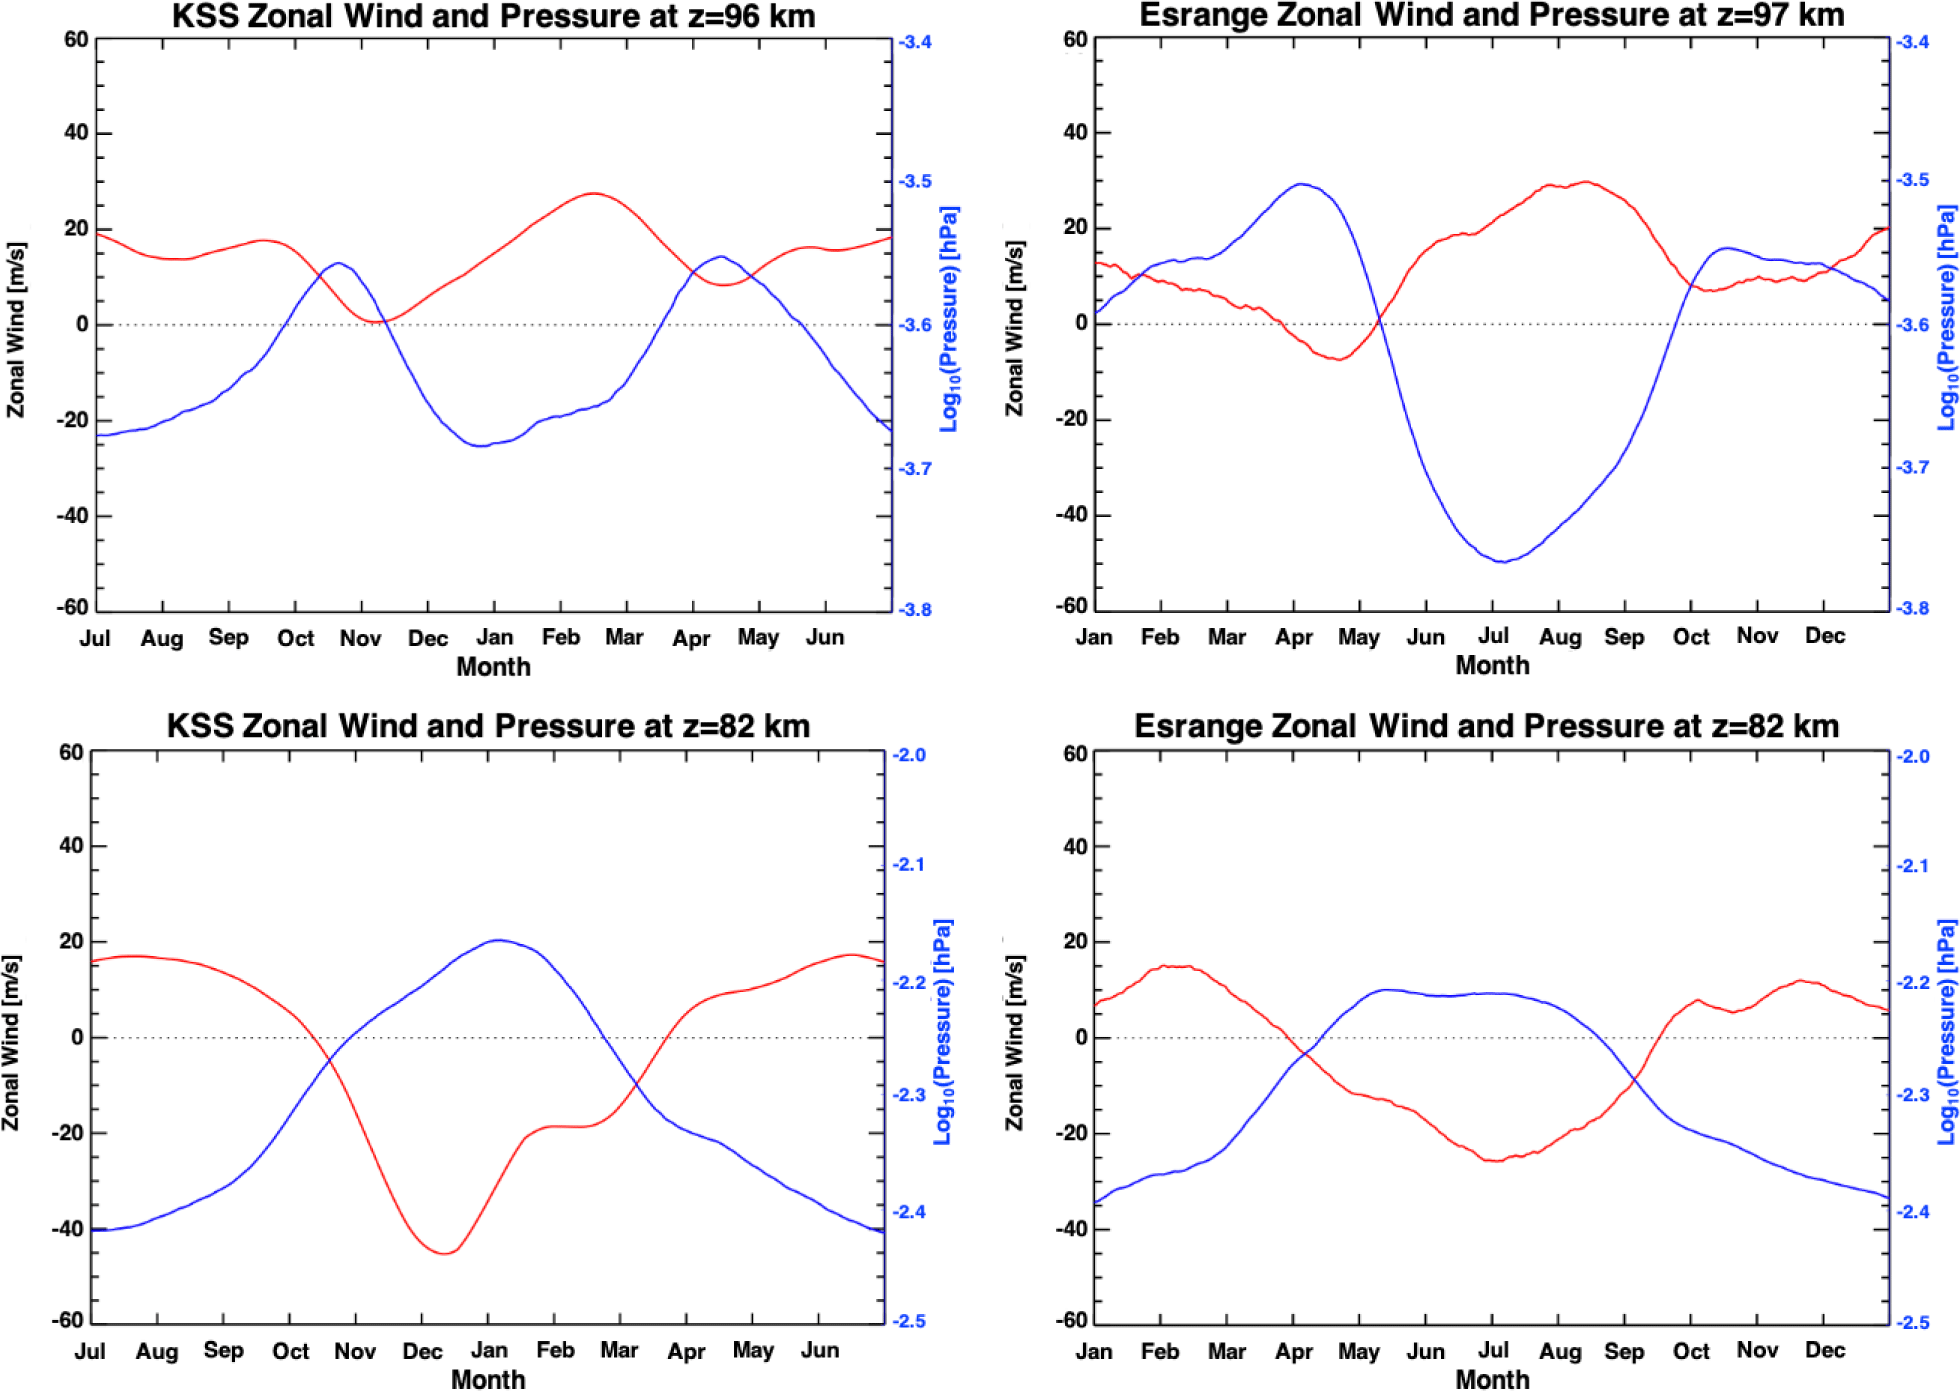
Fig. 9 represents the seasonal variations of climatological properties for winds and pressure. Notably, the relationship between zonal winds and pressure is almost an anticorrelation showing increasing pressures in westward winds and decreasing pressures in eastward winds by meridional circulation, which brings out the similarities in ratio distribution between winds and pressures in Fig. 6. The increase in pressure at an altitude of 82 km during summer is a result of pressure increase caused by the expansion of the lower atmosphere. Without the residual circulation, the pressure increase in summer would have been also induced up to an altitude of 96 km (97 km), but the circulation-induced pressure depletion pattern is observed at altitudes of 96 km (97 km). The different ratio distribution between KSS and Esrange seems to be related to westward wind field formation. In Fig. 7, the westward wind field in spring forms up to 95 km in altitude, while the westward wind field exists over the entire altitudinal range in Esrange. Therefore, the eastward wind is always dominant in the upper MLT region (above ~96 km) over KSS throughout the year, making strong SAO signal of two peaks (one primarily induced by solar radiation in winter and the other generated by filtered AGW). However, above 90 km over Esrange, the westward wind field extends to all height regions in spring. This westward wind above 90 km and the rest period with eastward wind field make the strong AO signal. It is necessary to examine the formation of the top altitude on the westward wind field in further study.
4. SUMMARY
The analysis of long-term oscillations in zonal winds and pressure of MLT region using 11-year data obtained at KSS and Esrange by Lomb-Scargle periodogram and wavelet methods reveals two dominant periodic components: AO and SAO. In addition, spectral analysis for KSS location revealed a component of TAO which might be induced by AGWs from convective sources in the subtropical region. Notably, distributions of signal powers for AO and SAO differ depending on the observing duration, location, and height. The features from spectral analysis of winds and pressures are quite similar to each other. At both sites, the relative power of SAO in relation to AO grows with height and the features can be characterized by the mesopause. Above the mesopause, the origin of the SAO in winds is two peaks of summer eastward winds and winter eastward winds. The eastward winds in summer, generated by the selected propagation of eastward AGWs from westward wind blocking below the mesopause, induce meridional circulation by the Coriolis force. Upward transport occurs to recover the atmospheric depletion due to equatorward transport, leading to an adiabatic expansion which provokes a drop in atmospheric temperatures and pressures. Consequently, oscillating pressures above the mesopause contain the SAO signal when the pressure is low in summer and winter, and high in spring and fall. The different distributions of AO and SAO between KSS and Esrange might be related to the spatial-temporal boundary of the westward wind field during summer. The top heights of the westward wind field are usually formed at around 95 km altitude in KSS, while they are much higher in Esrange. Understanding the different top heights at the two sites requires further study, such as AGW forcing.


