1. INTRODUCTION
Geomagnetic storms are extreme space weather phenomena caused by solar activities, such as solar flares and Coronal Mass Ejections (CMEs). These storms occur when the solar wind, composed of high-energy particles and magnetic fields emitted from the Sun, disrupts Earth’s magnetosphere. When the solar wind interacts with Earth’s magnetosphere, it increases the influx of strong electric fields and high-energy auroral particles from the magnetosphere into the polar upper atmosphere along the geomagnetic field lines. This results in the formation of auroras, rapid plasma convection, and strong currents in the high-latitude ionosphere (e.g., Axford & Hines 1961; Dungey 1961; Weimer 1996; Siscoe et al. 2002; Birn & Hesse 2005). The momentum and energy related to this magnetosphere-ionosphere coupling significantly impact the high-latitude thermosphere. Particularly during geomagnetic storms, Joule heating not only causes localized heating but also alters the global mean atmospheric circulation. Not only the disturbance dynamo electric fields caused by the disturbed neutral winds propagated from the high-latitude ionosphere to lower latitudes but also the prompt penetration electric fields (PPEFs) transferred instantly to the equatorial region leads to substantial changes in the composition, density, dynamics, and structure of the global upper atmosphere (e.g., Fuller-Rowell & Ree 1980; Richmond & Thayer 2000; Deng & Ridley 2007; Kwak & Richmond 2007; Kwak et al. 2007; Kwak et al. 2009; Lu et al. 2016; Kwak & Richmond 2021).
The changes in near-Earth space environment due to these intense geomagnetic storms caused by strong solar activity can severely impact modern human technology. This includes satellites orbiting the Earth, communication and navigation systems, and power grids. The consequences of the impact may comprise satellite malfunctions, orbit deviations, satellite damage, disruptions to satellite and ground-based radio communications, increased GPS errors, and damage to terrestrial power grids, resulting in significant socio-economic impacts. As a recent example, 38 of 49 Starlink satellites launched on February 3, 2022 are unexpectedly deorbited due to space weather events. The cause is known to be the increased atmospheric drag on the satellites due to higher upper atmospheric density caused by geomagnetic storms triggered by solar activity at that time (e.g., Dang et al. 2022; Fang et al. 2022; Zhang et al. 2022). Additionally, strong solar activity and the resulting intense geomagnetic storms pose considerable risks to human space activities, affecting the safety of crew members and passengers on polar route flights, as well as astronauts exploring space.
The G5-level (extreme) geomagnetic storm that occurred from May 10 to 12, 2024, was the first G5-level storm since the Halloween storm in late October 2003 during solar cycle 23, marking the strongest event in the current solar cycle 25. During this period, the Sun exhibited extreme activity, with consecutive occurrences of strong flares and CMEs reaching Earth. This led to severe fluctuations in Earth’s magnetosphere, causing various damages such as satellite communication disruptions and increased GPS errors. Comprehensive analysis of such extreme geomagnetic storm events is crucial for enhancing our understanding of space weather phenomena and preparing for similar future events.
This paper aims to achieve an in-depth understanding of the physical processes from the Sun to Earth through comprehensive observational analysis of the G5-level geomagnetic storm that occurred between May 10 and 12, 2024. Specifically, this study seeks to answer the following key questions:
-
What were the main causes of the G5-level geomagnetic storm that occurred between May 10 and 12, 2024?
-
What was the process from the occurrence of flares and CMEs on the Sun to their arrival at Earth?
-
What were the impacts of this event on Earth’s magnetosphere and upper atmosphere?
The goal of this research is to provide essential information for predicting and responding to future intense geomagnetic storms by comprehensively analyzing the sequence of processes from solar activity to Earth’s impacts. To this end, data collected using the latest satellite and ground-based observation systems will be analyzed to uncover the physical mechanisms of the Sun-Earth system. By gaining a deep understanding of the unique characteristics of this event and the various phenomena it triggered, it is expected that prediction models for geomagnetic storms will be improved and response strategies strengthened. Ultimately, this research aims to minimize potential damage from geomagnetic storms and enhance the stability of Earth-based technological systems.
In the following Section 2, we analyze the solar activity that led to the G5-level geomagnetic storm and the state of the solar wind as it reached near-Earth space (1 AU). In Section 3, we examine the interaction between this solar wind and Earth’s magnetosphere. Section 4 discusses the energy influx into polar regions due to magnetosphere-ionosphere coupling, while Section 5 focuses on the global upper atmospheric responses during the geomagnetic storm, based on satellite and ground-based observation data. In particular, we report the changes in near-Earth space captured by various satellite and ground-based instruments operated by the Korea Astronomy and Space Science Institute (KASI). Finally, in Section 6, we summarize the observational analysis and interpretation related to this G5-level geomagnetic storm as comprehensively discussed in the previous sections.
2. SOLAR SOURCES FOR G5-LEVEL GEOMAGNETIC STORM
In this section, we present remote-sensing and in-situ observations and results of prediction model from the very bottom of the solar atmosphere to interplanetary space near the Earth which are relevant to the G5 geomagnetic storm.
A large and complex sunspot cluster, designated as National Oceanic and Atmospheric Administration (NOAA) active regions (ARs) 13664 and 13668 (hereafter AR 13664/8), produced a series of major eruptions during its passage across the Earth-facing solar disk, including 11 X-class flares from 8 to 14 May in 2024 (refer to Table 1 for details of the X-class flares). Fig. 1 shows the long-term evolution of AR 13664/8 from its relatively quiet to active phases of producing flares, with the continuum intensity (left column) and radial magnetic field (right column) maps obtained by the Helioseismic and Magnetic Imager (HMI; Scherrer et al. 2012) onboard NASA’s Solar Dynamics Observatory (SDO; Pesnell et al. 2012).
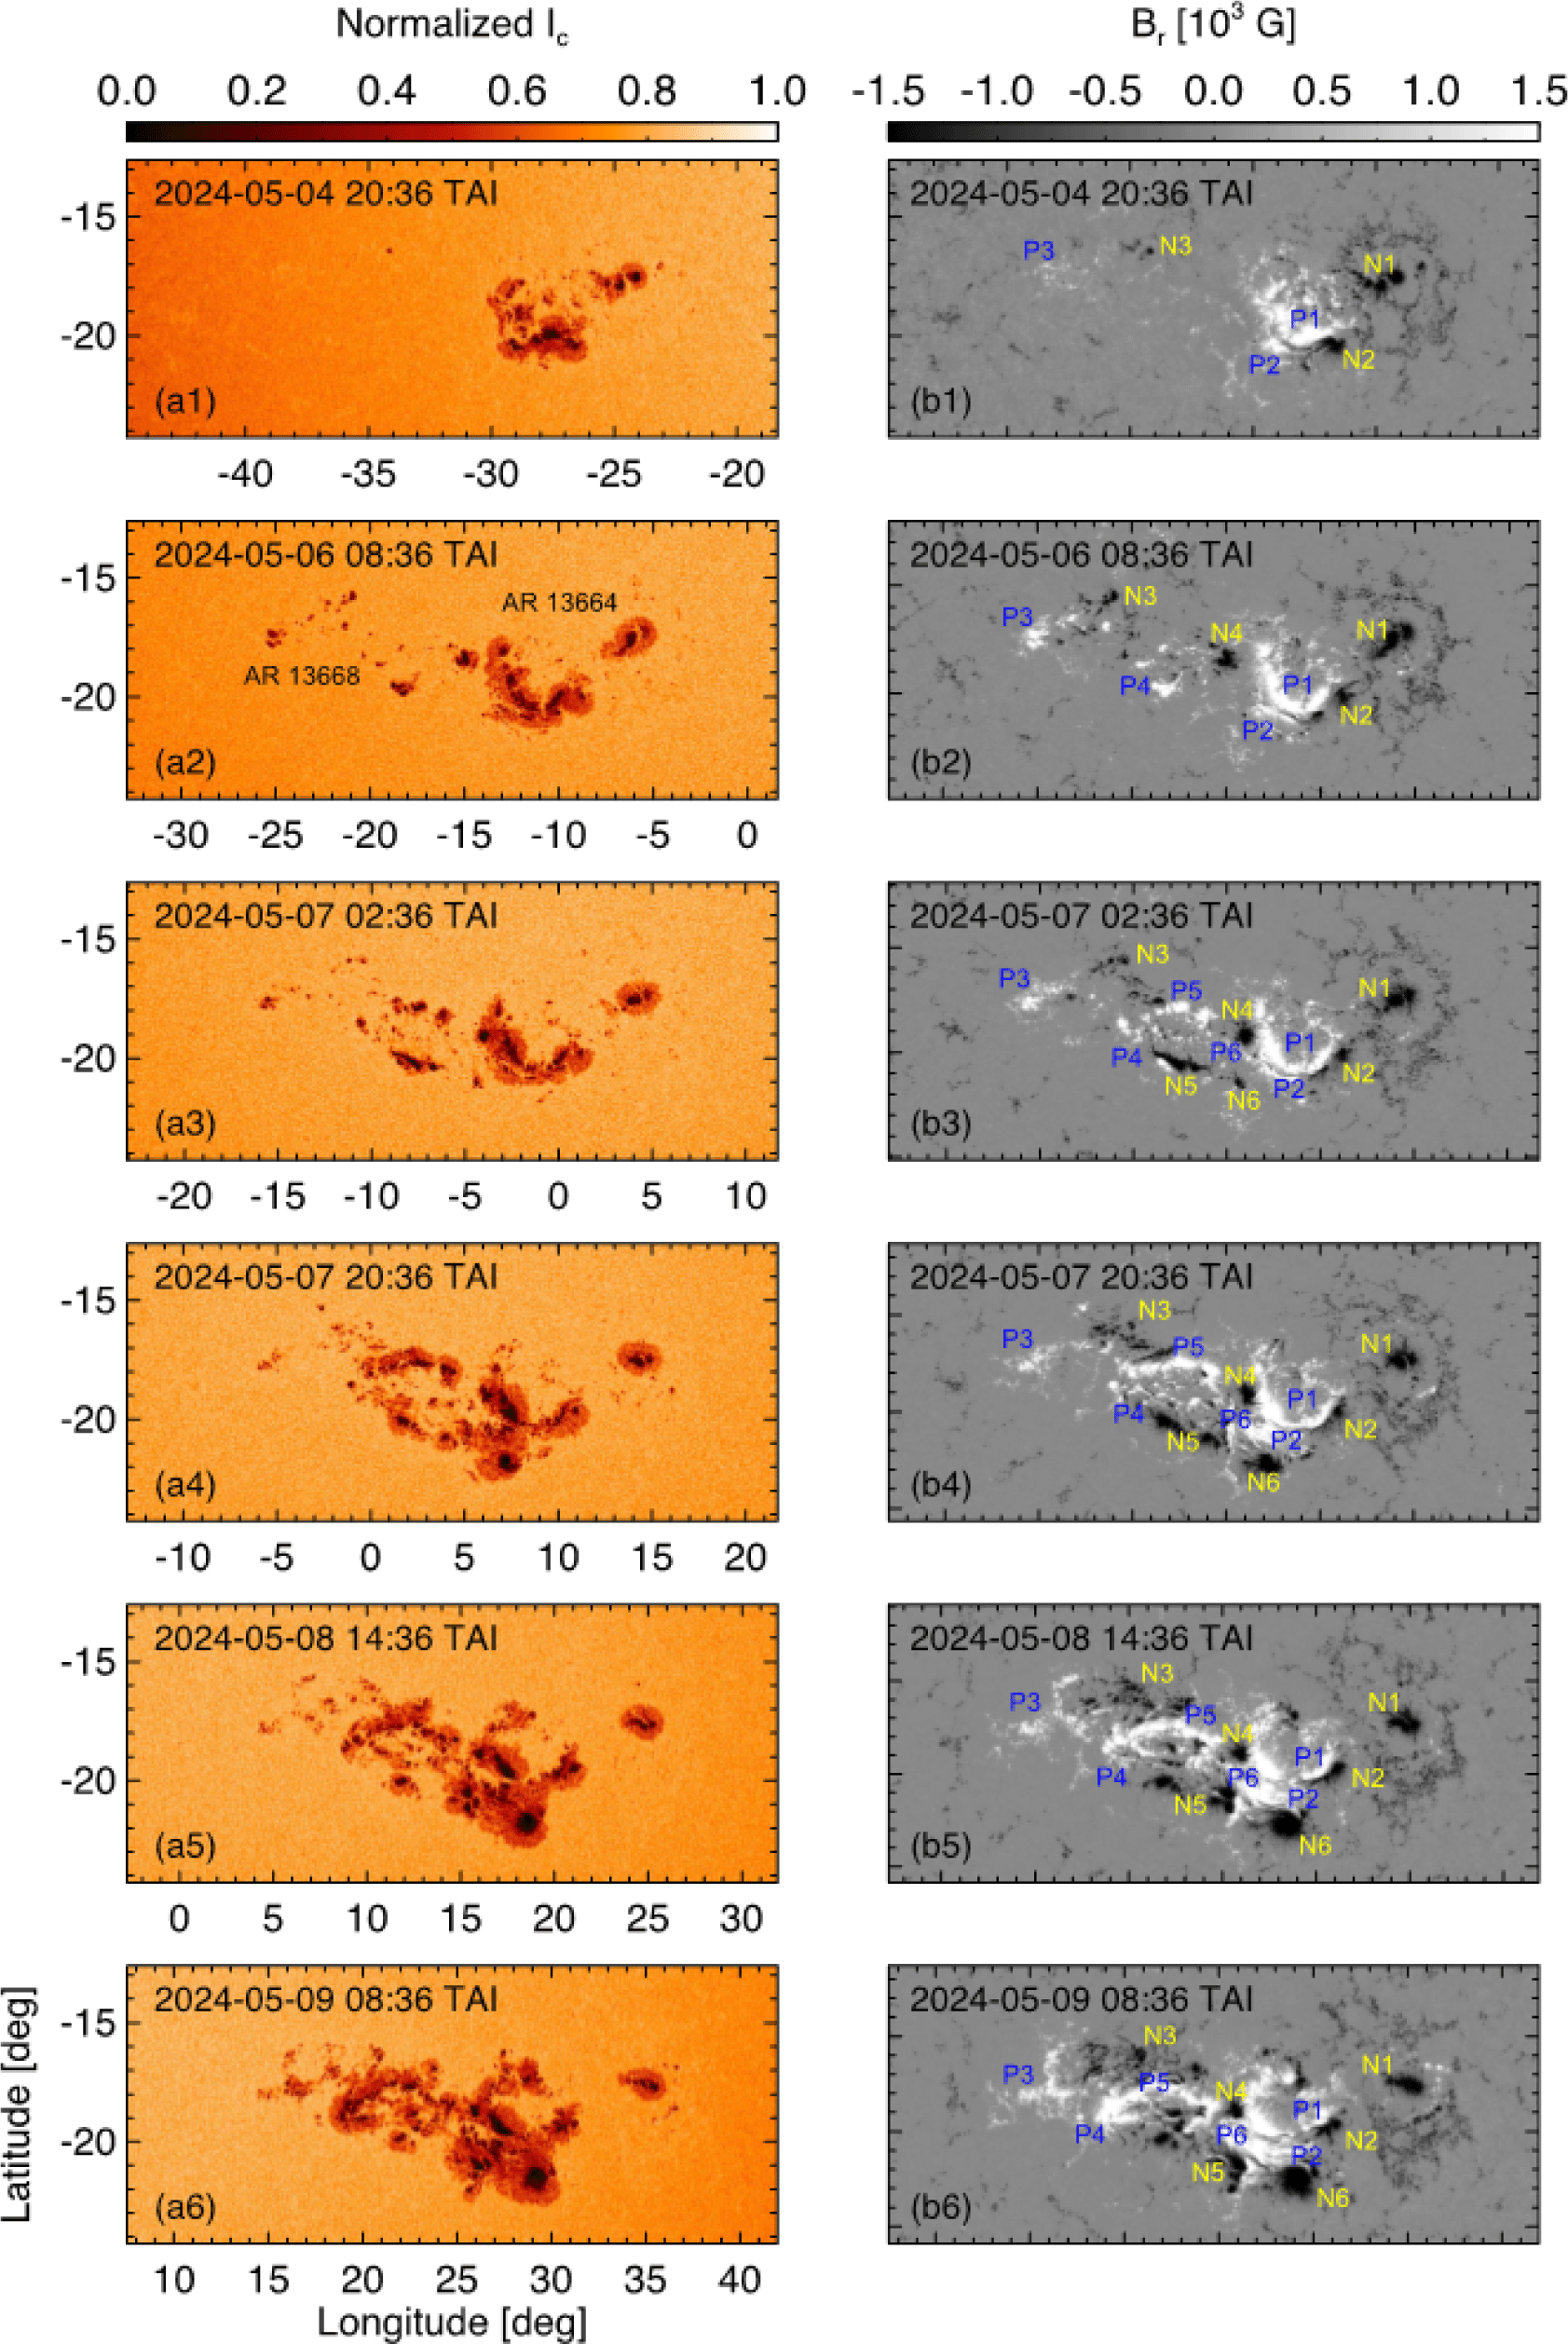
AR 13664 first became visible on the east limb as seen from Earth on May 1. On May 4, a pair of a small bipolar structure (N3/P3, Fig. 1(a1) and 1(b1)) began to emerge on the eastern side of the two pre-existing bipolar magnetic structures (N1/P1 and N2/P2) within AR 13664. This newly emerged magnetic structure later was designated as a separate active region, AR 13668. On May 6, another bipolar pair (N4/P4) emerged between AR 13664 and the bipolar magnetic structure N3/P3, and separated quickly (Fig. 1(a2) and 1(b2)). On May 7, two additional bipolar magnetic structures (N5/P5 and N6/P6) emerged between AR 13664 and 13668 with a north-south direction, quickly moved westward exhibiting significant shearing, and formed a complex sunspot cluster AR 13664/8 (Fig. 1(a3)–1(a6) and 1(b3)–1(b6)). Notably, the X-class flares from this magnetic complex began on May 8 and produced 11 X-class flares until the sunspot cluster moved beyond the west limb (Fig. 2), suggesting that AR 13664/8 had become highly flare-productive active regions as a result of the merging of these two active regions.
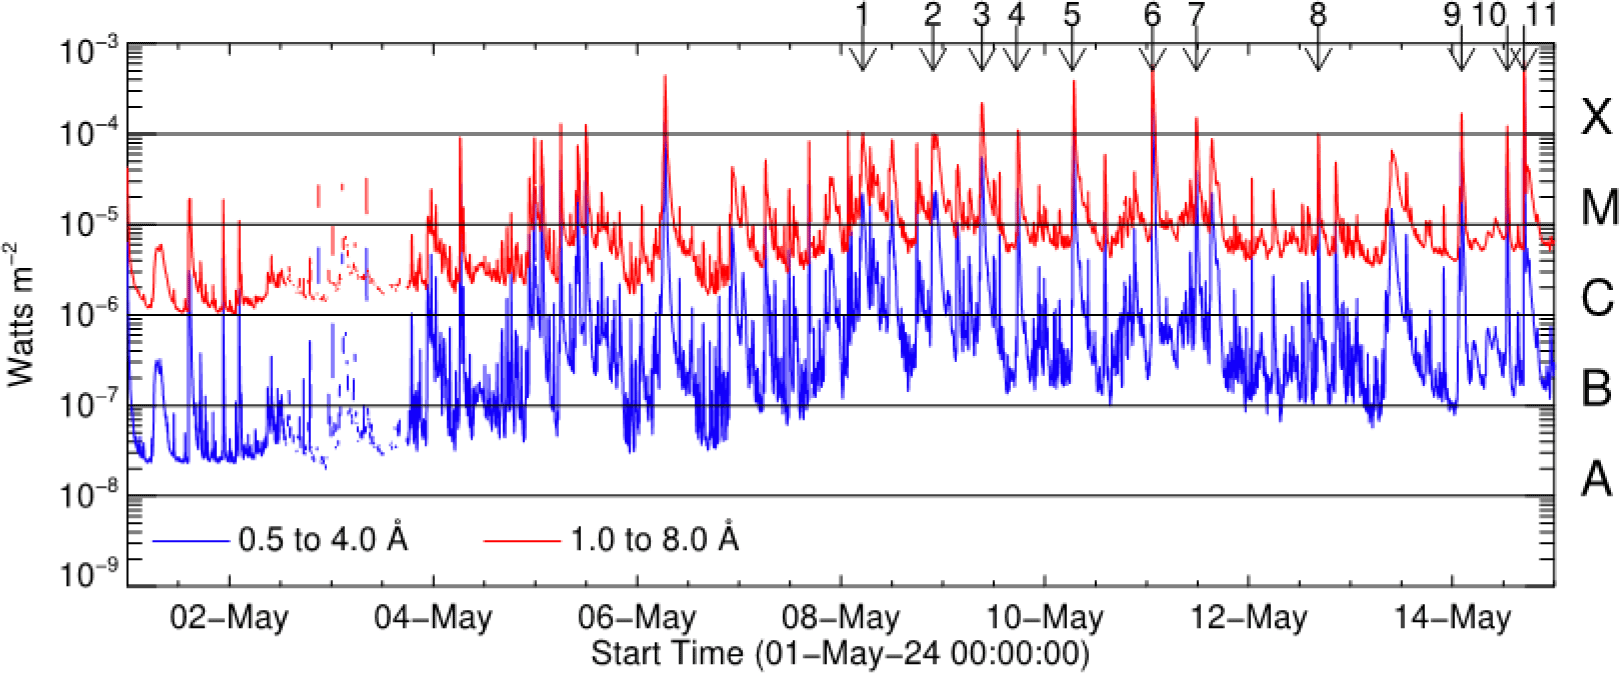
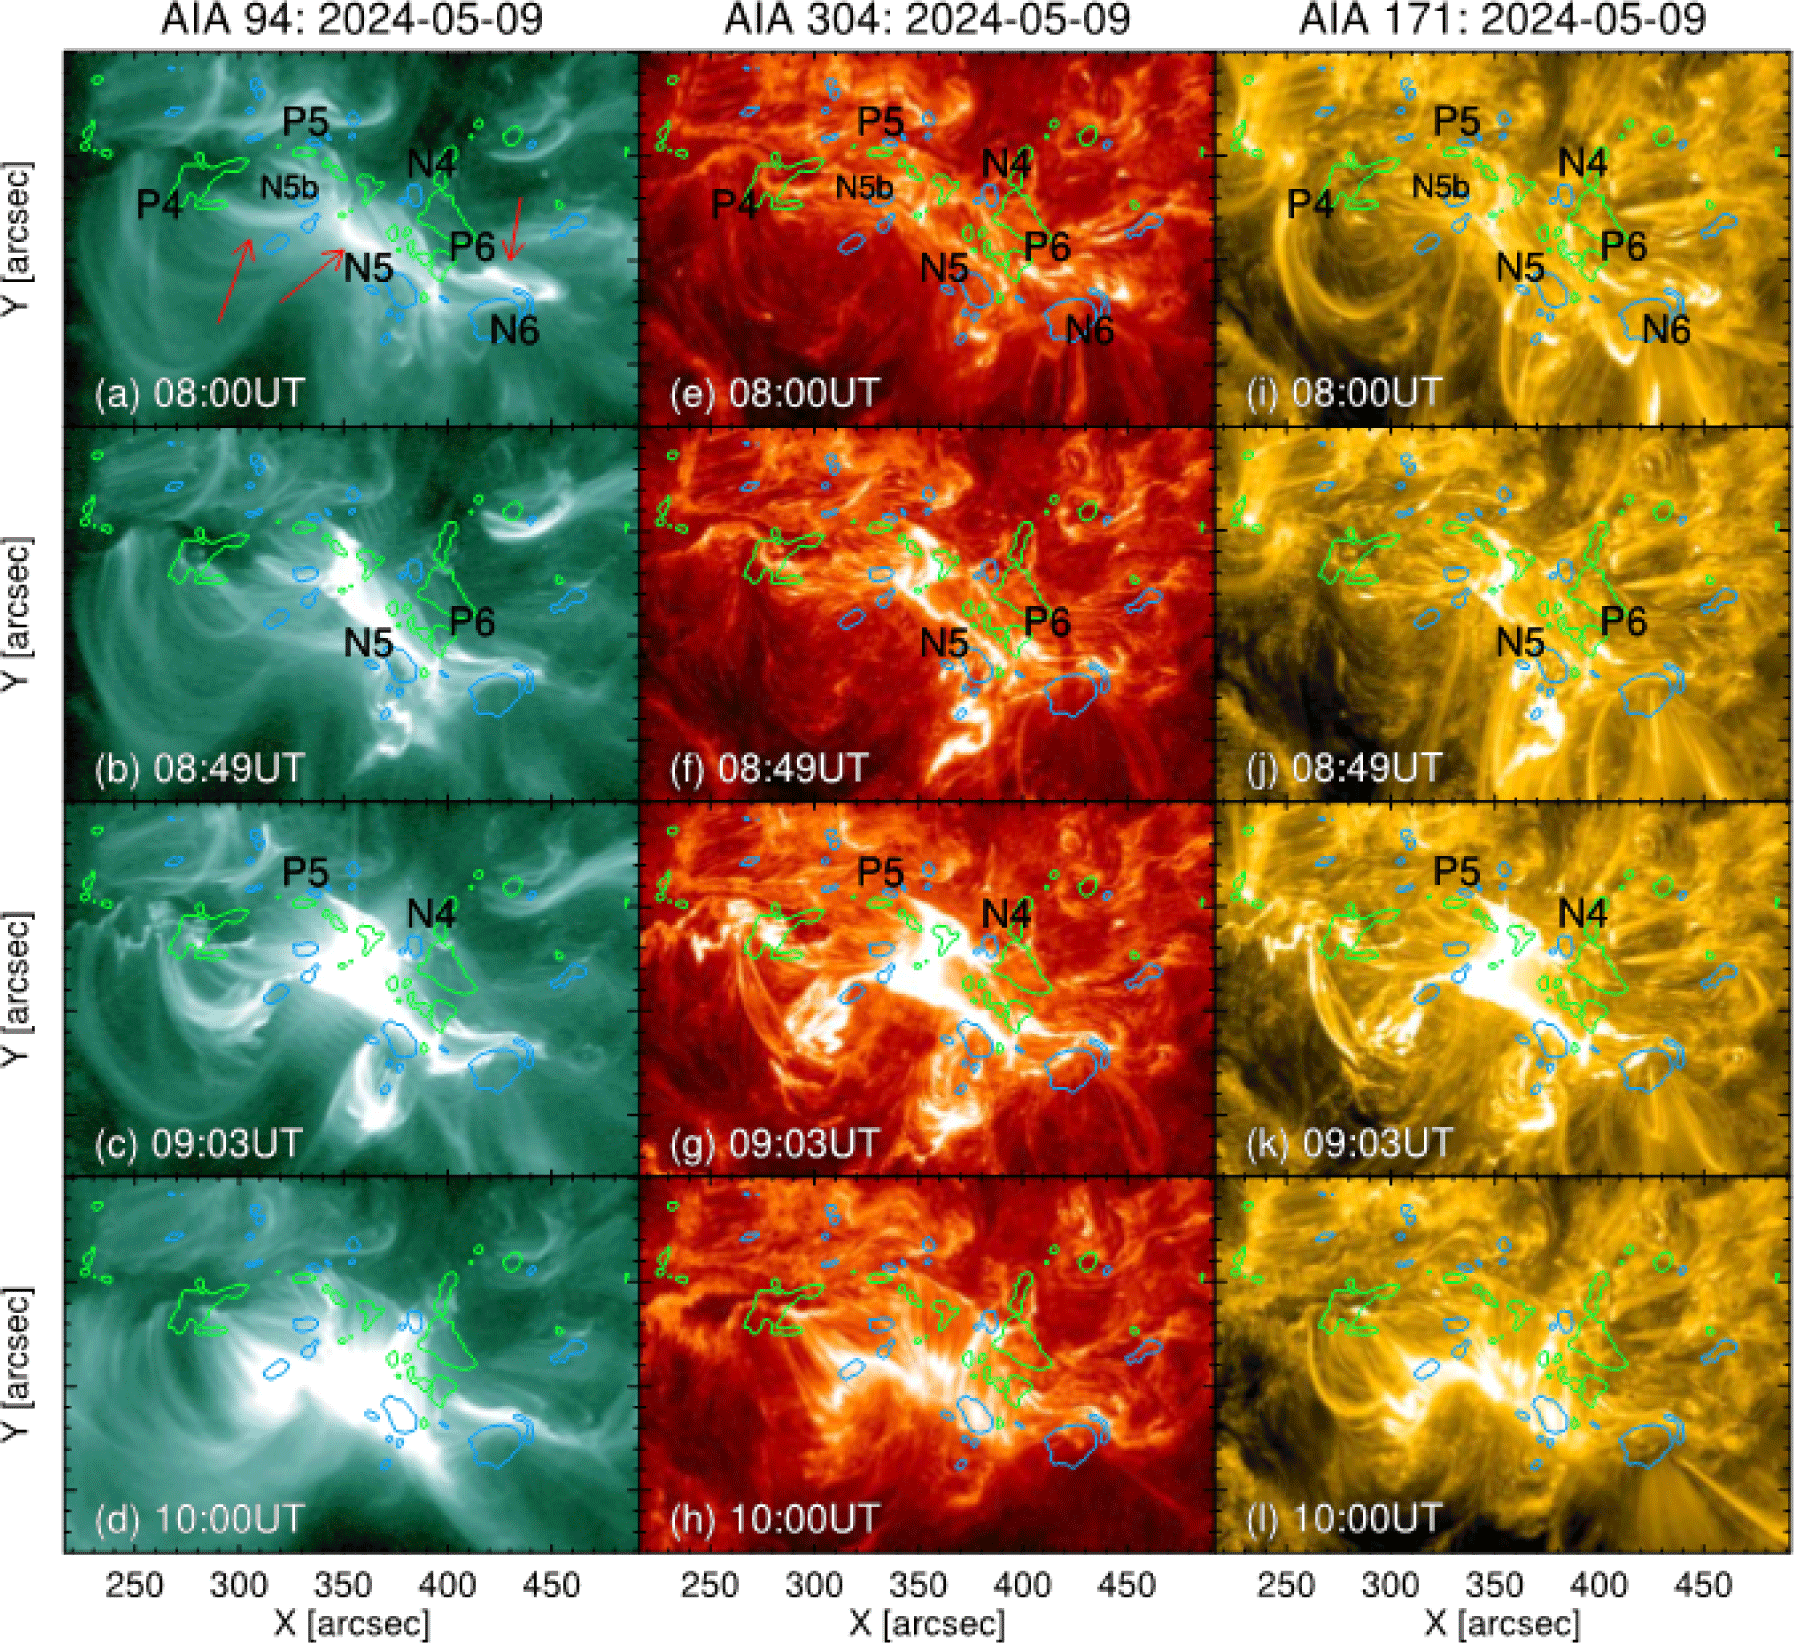
The evolution of AR 13664/8 indicates that the merging of these active regions is responsible for the flares. For instance, the X2.2 flare (indicated by the third arrow in Fig. 2) began at 08:45 UT on May 9 lasted for 50 minutes, reaching its peak at 09:13 UT. Our careful investigation of Atmospheric Imaging Assembly (AIA; Lemen et al. 2012) images at different channels in time reveals two important properties of the AR13664/8 regarding the X2.2 flare activity. Firstly, this active region consists of at least three independent flux rope systems inside it. Those flux ropes can be distinguished well before the flare onset, as indicated by red arrows in Fig. 3(a). We can see bright flux ropes, each of which is connecting a bipolar set of P4/N5b, P5/N5, and P6/N6 that are highly sheared an east-west direction over AR 13664/8, in the AIA 94 Å image taken at 08:00 UT, half an hour before the flare onset. Those flux ropes can be seen in the images of AIA 304 Å (Fig. 3(e)) and 171 Å (Fig. 3(i)), even with signs of twist, which are all right-handed. Secondly, the time series of AIA images reveals that the X2.2 flare involves two-step magnetic reconnections between those three flux ropes. AIA images taken at 08:49 UT, 4 minutes after the onset time, show that the brightening occurs between N5 and adjacent positive flux, which is part of P6 (Fig. 3(f) and 3(j)). The remote brightening close to P5 also indicates that the flux rope connecting P5/N5 is involved in this first reconnection. As a result, a long flux tube connecting P5 and N6 forms. Later, near the flare peak time, intense brightening occurs between P5 and N4 (Fig. 3(g) and 3(k)), indicating secondary reconnection between the long flux tube connecting the P5/N6 pair and the other flux tube connecting the P4/N4 pair. These findings suggest that such consecutive powerful solar flares originated from the merging and interaction of the two active regions, AR 13664/8, which formed a highly complex and sheared magnetic field configuration.
It has been well established that the leading cause of geomagnetic storms is the compression of Earth’s magnetosphere by the passages of CMEs or sheaths of CME-driven shocks (e.g., Gosling et al. 1990; Cid et al. 2012). However, directly attributing a specific geomagnetic storm to a particular solar activity, such as solar flares and CMEs, can be a non-trivial problem due to the occurrence of multiple flares and CMEs in succession.
The G5-level geomagnetic storm started at 17 UT on May 10. For this analysis, we considered the flares and CMEs that occurred three days (May 7) and one day (May 10) before the storm, accounting for the potential transit times of CMEs from the Sun to 1 AU. We utilized the CME listings and geometric parameters determined by the Korea AeroSpace Administration (KASA)/Korea Space Weather Center (KSWC), which provides regular space weather forecasts by monitoring solar activities and the near-Earth space environment. KSWC also uses the CME geometric parameters as inputs to the Wang-Sheeley-Arge (WSA; Arge & Pizzo 2000; Arge et al. 2004)–ENLIL+Cone model to predict geomagnetic storms.
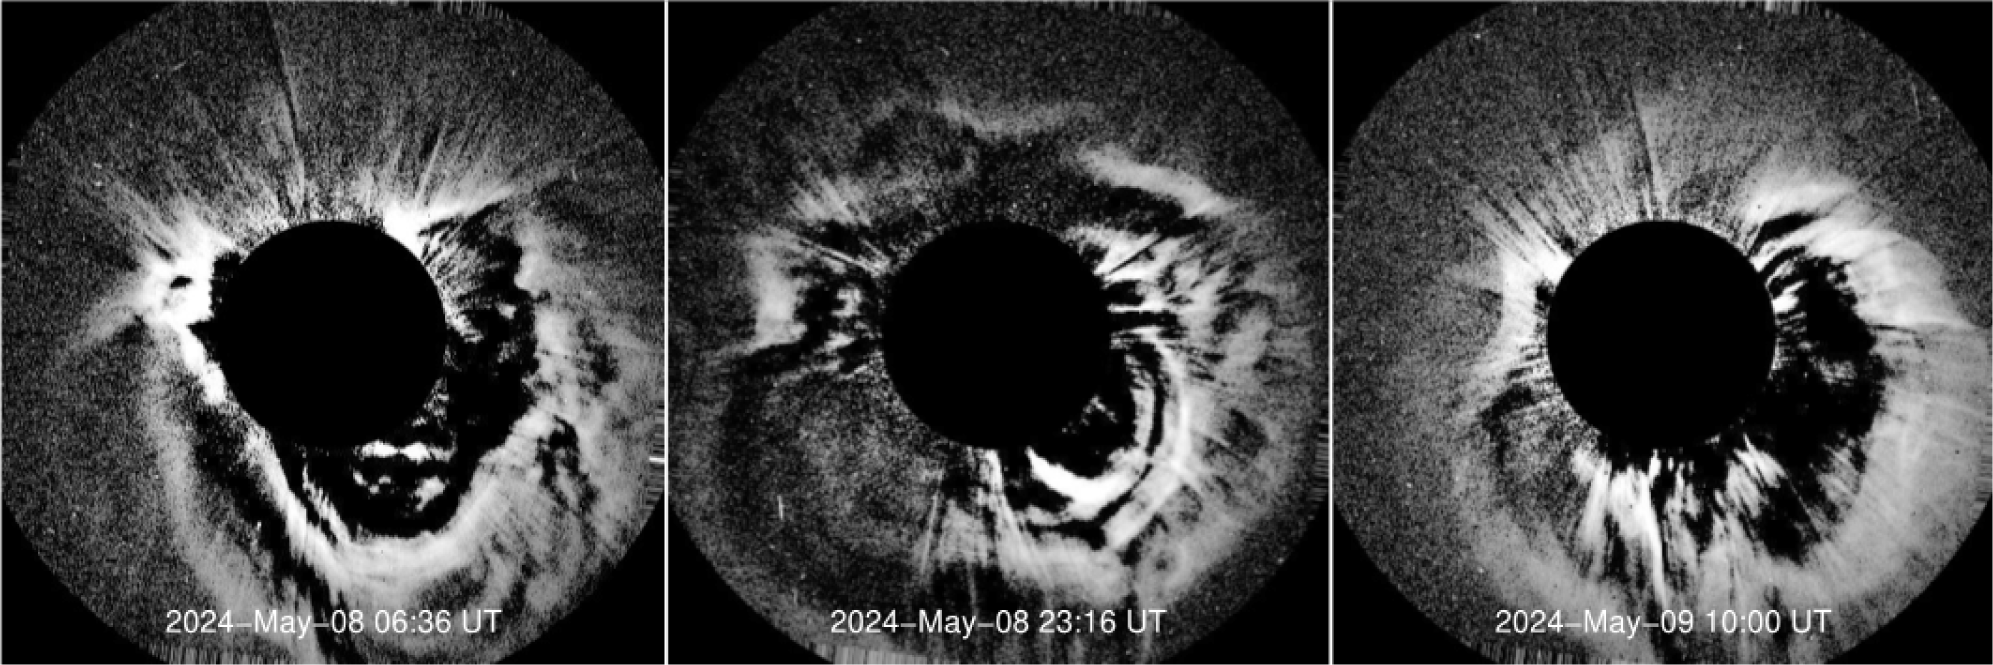
Fig. 4 shows three examples of CMEs observed by the Large Angle and Spectrometric Coronagraph Experiment (LASCO; Brueckner et al. 1995) C2 onboard the SOlar and Heliospheric Observatory (SOHO; Domingo et al. 1995), which were conjectured to have caused the storm. Before the day of the storm, there were 4 X-class flares in active regions 13664/8, and all of these flares were eruptive and associated with Earth-directed CMEs. Three panels in this Figure show the CMEs associated with X-class flares starting at 04:37 UT and 21:08 UT on May 8 and 08:45 UT on May 9, respectively.
We have conducted simulations using WSA–ENLIL+Cone model installed at KSWC to identify the CME responsible for the observed geomagnetic storm. The WSA–ENLIL+Cone model is capable of simulating the propagation of multiple CMEs through the heliosphere (Odstrcil 2003; Odstrcil et al. 2004). This model is widely used in space weather forecasting as it can predict the arrival time and impact of CMEs on Earth and other planets. The model takes into account various inputs, such as solar wind parameters and CME characteristics, to produce detailed predictions of the solar wind environment, including velocity, density, and magnetic field strength.
The left and right panels in Fig. 5 depict the results of the model simulation at the time of the four CMEs that are considered as potential candidates for triggering the storm had been launched from the Sun, and around the time when the merged CMEs arrived at 1 AU. The model results suggest that multiple CMEs departed separately at different times underwent merging processes during their propagations owing to their similar directions and different speeds. It appears that when the CME associated with the flare whose start time was 04:37 UT on May 8 was about to reach 1 AU, it was overtaken by the CME associated with the X2.2 flare (see Section 2.2) that started at 08:45 UT on May 9.
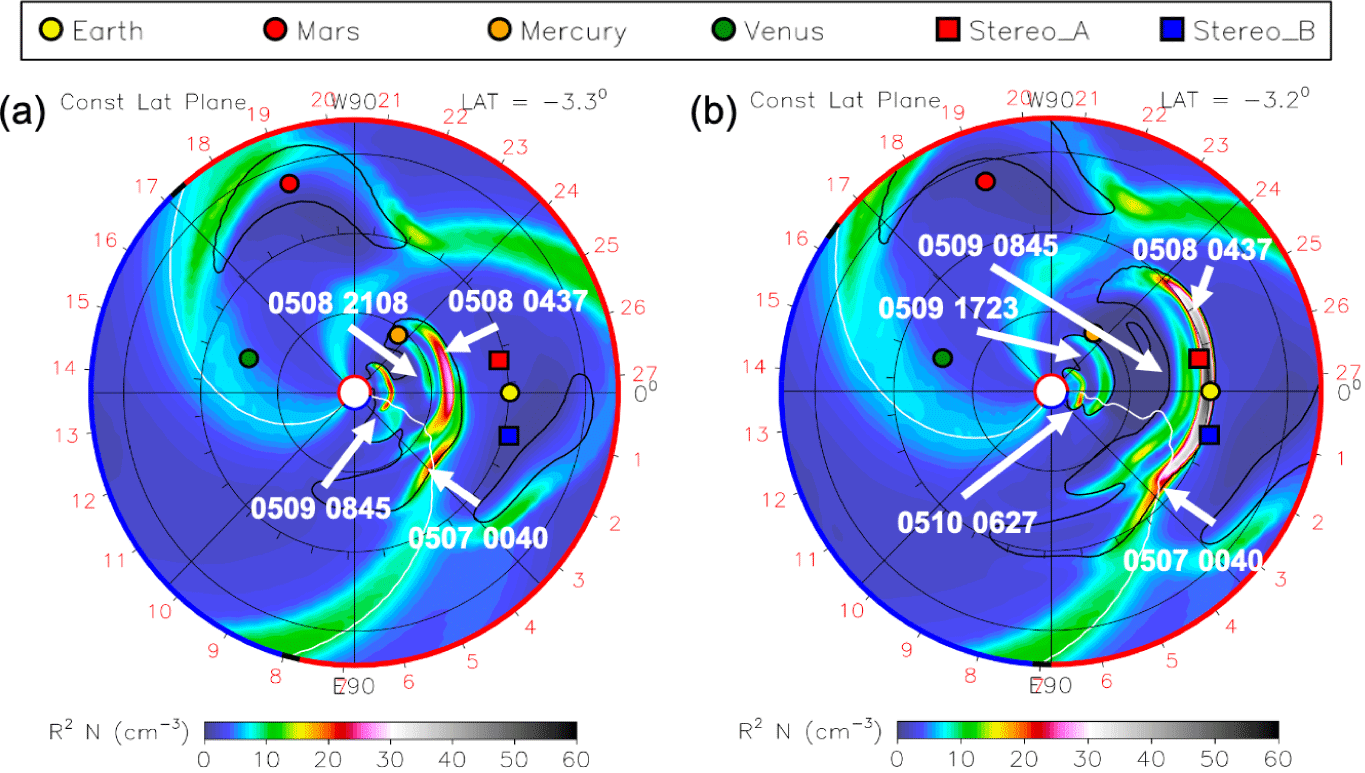
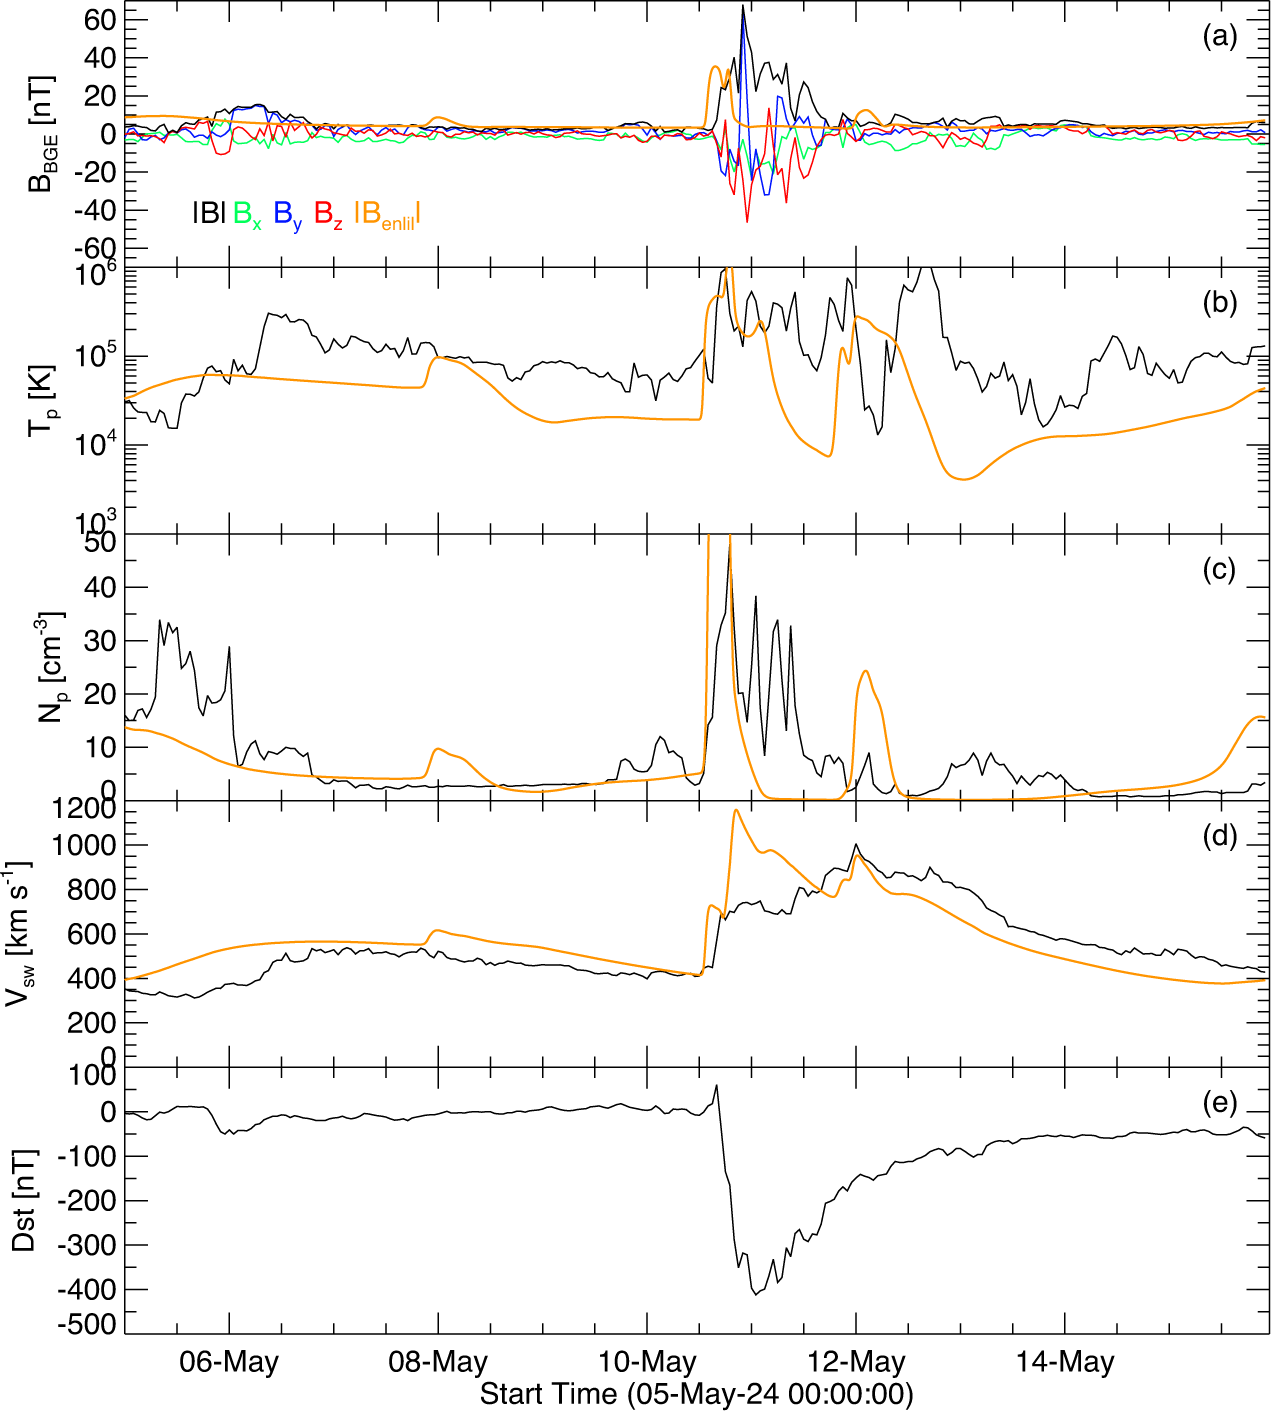
Fig. 6. depicts the solar wind conditions from 5 to 15 May 2024, obtained from the NASA OMNI2 data set (http://omniweb.gsfc.nasa.gov/). From top to bottom are (a) the interplanetary magnetic field (IMF) intensity B (black), magnetic field z-component Bz (red) in the Geocentric Solar Ecliptic (GSE) coordinate system, (b) proton temperature (c) proton density, (d) solar wind (SW) flow velocity, and (e) Dst index. The properties of both solar wind plasma and IMF exhibit the abrupt increases around 17:00 UT on May 10 in the SW speed, density, temperature, and IMF intensity, indicating an interplanetary CME (ICME). The ICME arrival seems to be associated with the storm that commenced with a sudden increase in the strength of the Earth magnetic field, as referred to as Sudden Storm Commencement (SSC), as shown in panel (e). Notably, panel (a) indicates that a rapid southward turning of the IMF Bz was simultaneously observed, which is thought to be an important driver for geomagnetic storms (e.g., Gonzalez & Echer 2005). Whereas a typical magnetic cloud structure is expected to have a smooth rotation of the IMF Bz, the IMF Bz component in panel (a) seems highly variable, which may indicate the arrival of multiple ICME merged together. It leads to a conjecture that merging multiple ICMEs resulted in the long-duration strong southward IMF Bz component, which could drive intense magnetic reconnection at the dayside of the Earth’s magnetopause, eventually leading to an intense geomagnetic storm. The WSA–ENLIL+Cone model result supports this scenario that the CME associated with the flare that started at 08:45 UT May 9, swept through preceding CMEs, and eventually merged near 1 AU with the CME associated with the flare that started at 04:37 UT May 8. It is interesting to note that large-amplitude variations of negative IMF Bz caused by the multiple ICMEs give rise to irregularly shaped storm as shown in the main and recovery phases of Dst index. We overlaid the ENLIL model results in this figure (orange-colored lines in Fig. 6) with solar wind parameters obtained with in-situ observation in Fig. 6 and found the simulation results agree well with real parameters near the Earth. It implies that the CME-CME interactions play a significant role in producing strong geomagnetic storms (e.g., Scolini et al. 2020).
3. INTERACTION BETWEEN SOLAR WIND AND MAGNETOSPHERE
This section examines how the solar activity and the resulting solar wind discussed in Section 2 interacted with Earth’s magnetosphere as they reached near-Earth space. To this end, we analyzed the magnetic field and energetic particle data observed by NOAA’s Geostationary Operational Environmental Satellite (GOES) 16 and 18, as well as the data from the Korea Space wEather Monitor (KSEM) instruments onboard Korea Meteorological Administration (KMA)’s Geostationary Korea Multi-Purpose Satellite-2A (GEO-KOMPSAT-2A, GK2A).
Fig. 7 shows OMNI solar wind data (King & Papitashvili 2005), the Sym-H (World Data Center for Geomagnetism, Kyoto, 2022) and AU/AL (World Data Center for Geomagnetism, Kyoto, 2015) indices, and magnetic field and energetic particle data from GOES 16 and 18, and GK2A (Oh et al. 2018) during the main and early recovery phases of this superstorm. In a long time scale, before the interplanetary shock arrived at Earth at ~17 UT on 10 May 2024 (Fig. 7(a) and 7(c)), energetic proton fluxes began to increase with energy dispersion on both dayside (GOES 18 and 16; Fig. 7(f) and 7(i)) and nightside (GK2A; Fig. 7(l)) at ~12 UT on 10 May, corresponding to further enhancements of solar energetic proton fluxes in interplanetary space. After that, high-energy (radiation belt) electron fluxes decreased during the storm main phase, but increased beyond the prestorm level during the storm recovery phase (Fig. 7(g), 7(j), and 7(m); see Miyoshi & Kataoka 2005).
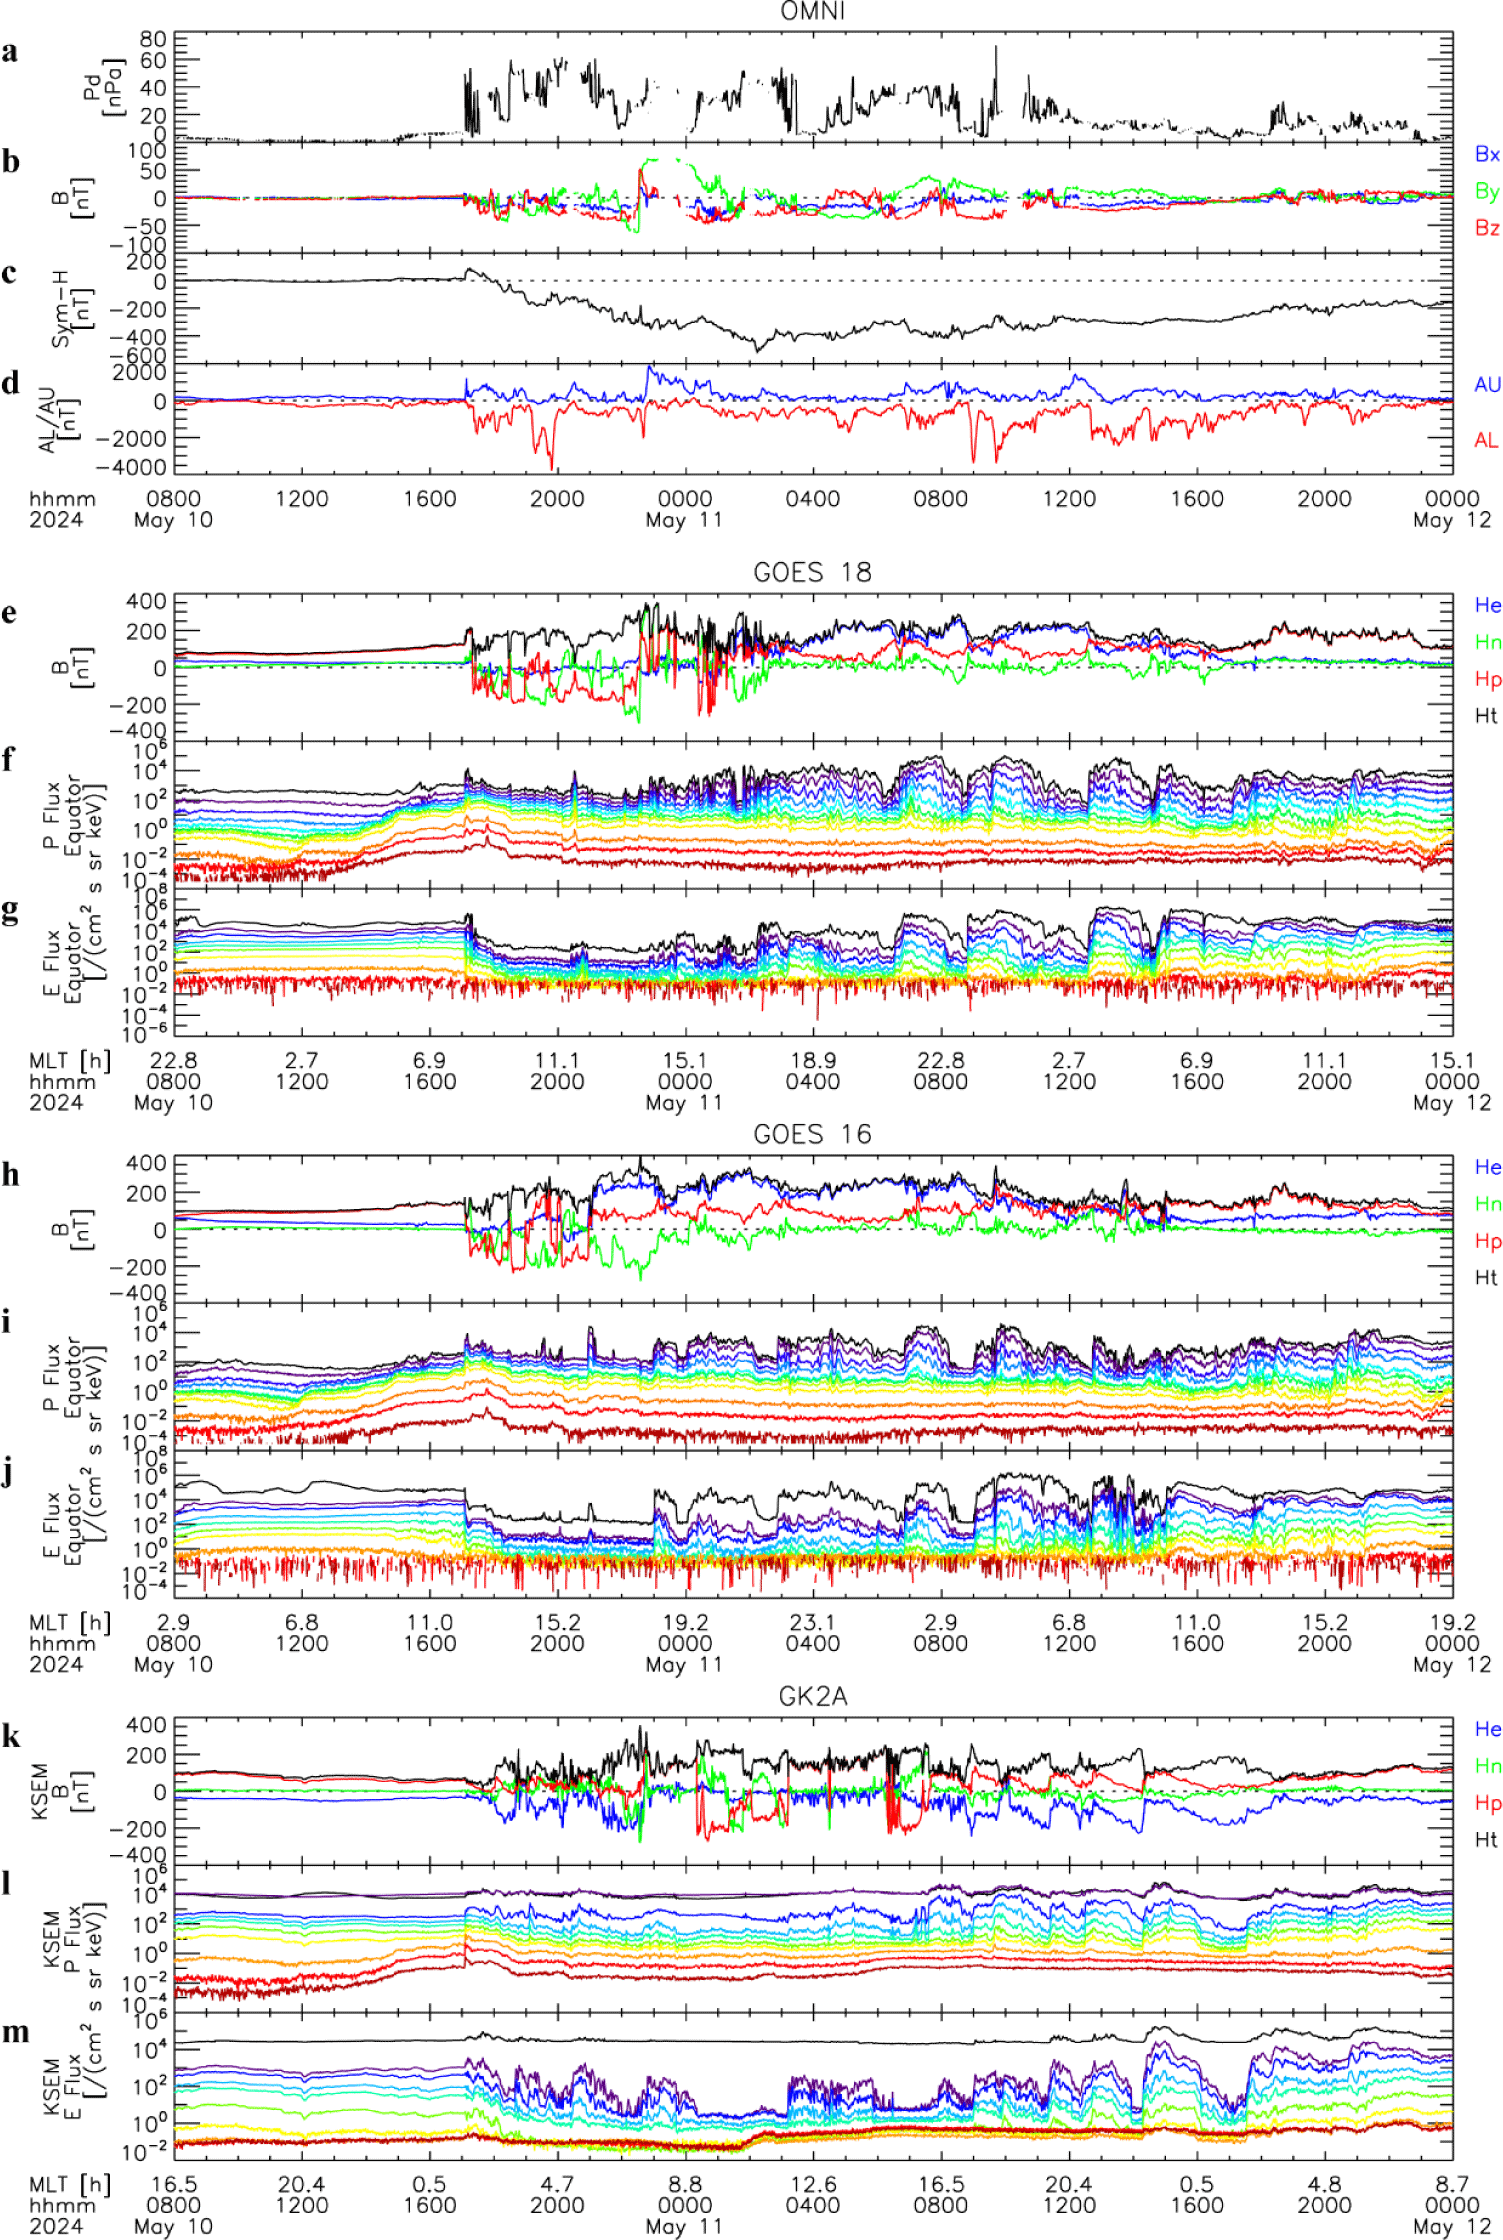
On the other hand, several short-time-scale phenomena were observed during the interval of interest. When the interplanetary shock hit Earth’s magnetosphere at ~17 UT on 10 May, the magnetic field and proton and electron fluxes transiently increased, particularly on the dayside, due to magnetospheric compression (sudden impulse; Fig. 7(e)–7(m); see Kokubun 1983; Lee & Lyons 2004; Lee et al. 2005). Immediately after that, however, the dayside GOES satellites observed southward magnetic fields (Fig. 7(e) and 7(h)), indicating that these satellites exited from the magnetosphere, that is, the magnetopause shifted to inside geosynchronous orbit, caused by magnetospheric compression due to the extremely high solar wind dynamic pressure (Fig. 7(a)) and by dayside closed field line reconnection (erosion) due to the large southward interplanetary magnetic field (Fig. 7(b); see Shue et al. 1998). Such southward magnetic fields at dayside geosynchronous orbit were observed by the three satellites intermittently until ~8 UT on 11 May, that is, from ~17 UT on 10 May to ~1 UT on 11 May for GOES 18 (~8–16 magnetic local time (MLT); Fig. 7(e)), ~17–21 UT on 10 May for GOES 16 (~12–16 MLT; Fig. 7(h)), and ~0–8 UT for GK2A (~9–16 MLT; Fig. 7(k)), suggesting that a wide range of the dayside magnetopause crossed geosynchronous orbit back and forth.
On the nightside, net increase in the northward magnetic field (dipolarization; Fig. 7(e), 7(h), and 7(k)) occurred repeatedly, associated with substorms, including those with a minimum AL of –3,000 to –4,000 nT (Fig. 7(d)), causing enhancements of energetic proton and/or electron fluxes (injections; Fig. 7(f), 7(g), 7(i), 7(j), 7(l), and 7(m)). The injections were dispersionless or dispersive, depending on the satellite locations (Birn et al. 1997). In particular, the three satellites observed several clear injections associated with dipolarizations at ~2 h period from ~9 to ~16 UT on 11 May. Such periodic injections are called “sawtooth event” (Henderson 2006). The distribution of dipolarizations (~17–5 MLT) implies that the auroral breakup region, which corresponds to the dipolarization region (Liou et al. 2002), spread over an unusually wide MLT rage. Periodic dipolarizations and injections were observed also by GK2A in the postmidnight sector from ~18 to 23 UT on 10 May (Fig. 7(k)–7(m)) and by GOES 16 in the premidnight sector from ~23 UT on 10 May to ~8 UT on 11 May (Fig. 7(h)–7(j)).
4. ENERGY INFLUX INTO THE POLAR IONOSPHERE
We examined various indicators and data to infer the energy influx into high latitudes after the G5 event. First, we looked at the Auroral Electrojet (AE) index (https://wdc.kugi.kyoto-u.ac.jp/ae_provisional) and the Kp index (Matzka et al. 2021). The AE index is calculated from changes in the horizontal component (H) of the Earth’s magnetic field measured by 10–13 magnetometers along the auroral oval in the northern hemisphere. Specifically, the AE index is the difference between the AU index (eastward auroral electrojet) and the AL index (westward auroral electrojet). Since the AL index is negative, the AE index represents the total auroral electrojet activity. Hence, the AE index indirectly infers the total energy influx into high latitudes. Unlike the AE index, the Kp index is calculated using data collected from mid-latitude magnetometers installed worldwide, particularly in the Northern Hemisphere. It serves as a standard for assessing overall geomagnetic activity on Earth. The Kp index is updated every three hours, and the data is available from the GFZ German Research Centre for Geosciences (https://kp.gfz-potsdam.de/en/). As shown in Fig. 8(a), the AE and Kp indices suddenly increased around 17:00 UT on May 10, 2024, indicating continuous energy influx and geomagnetic disturbances until 06:00 UT on May 12, 2024.
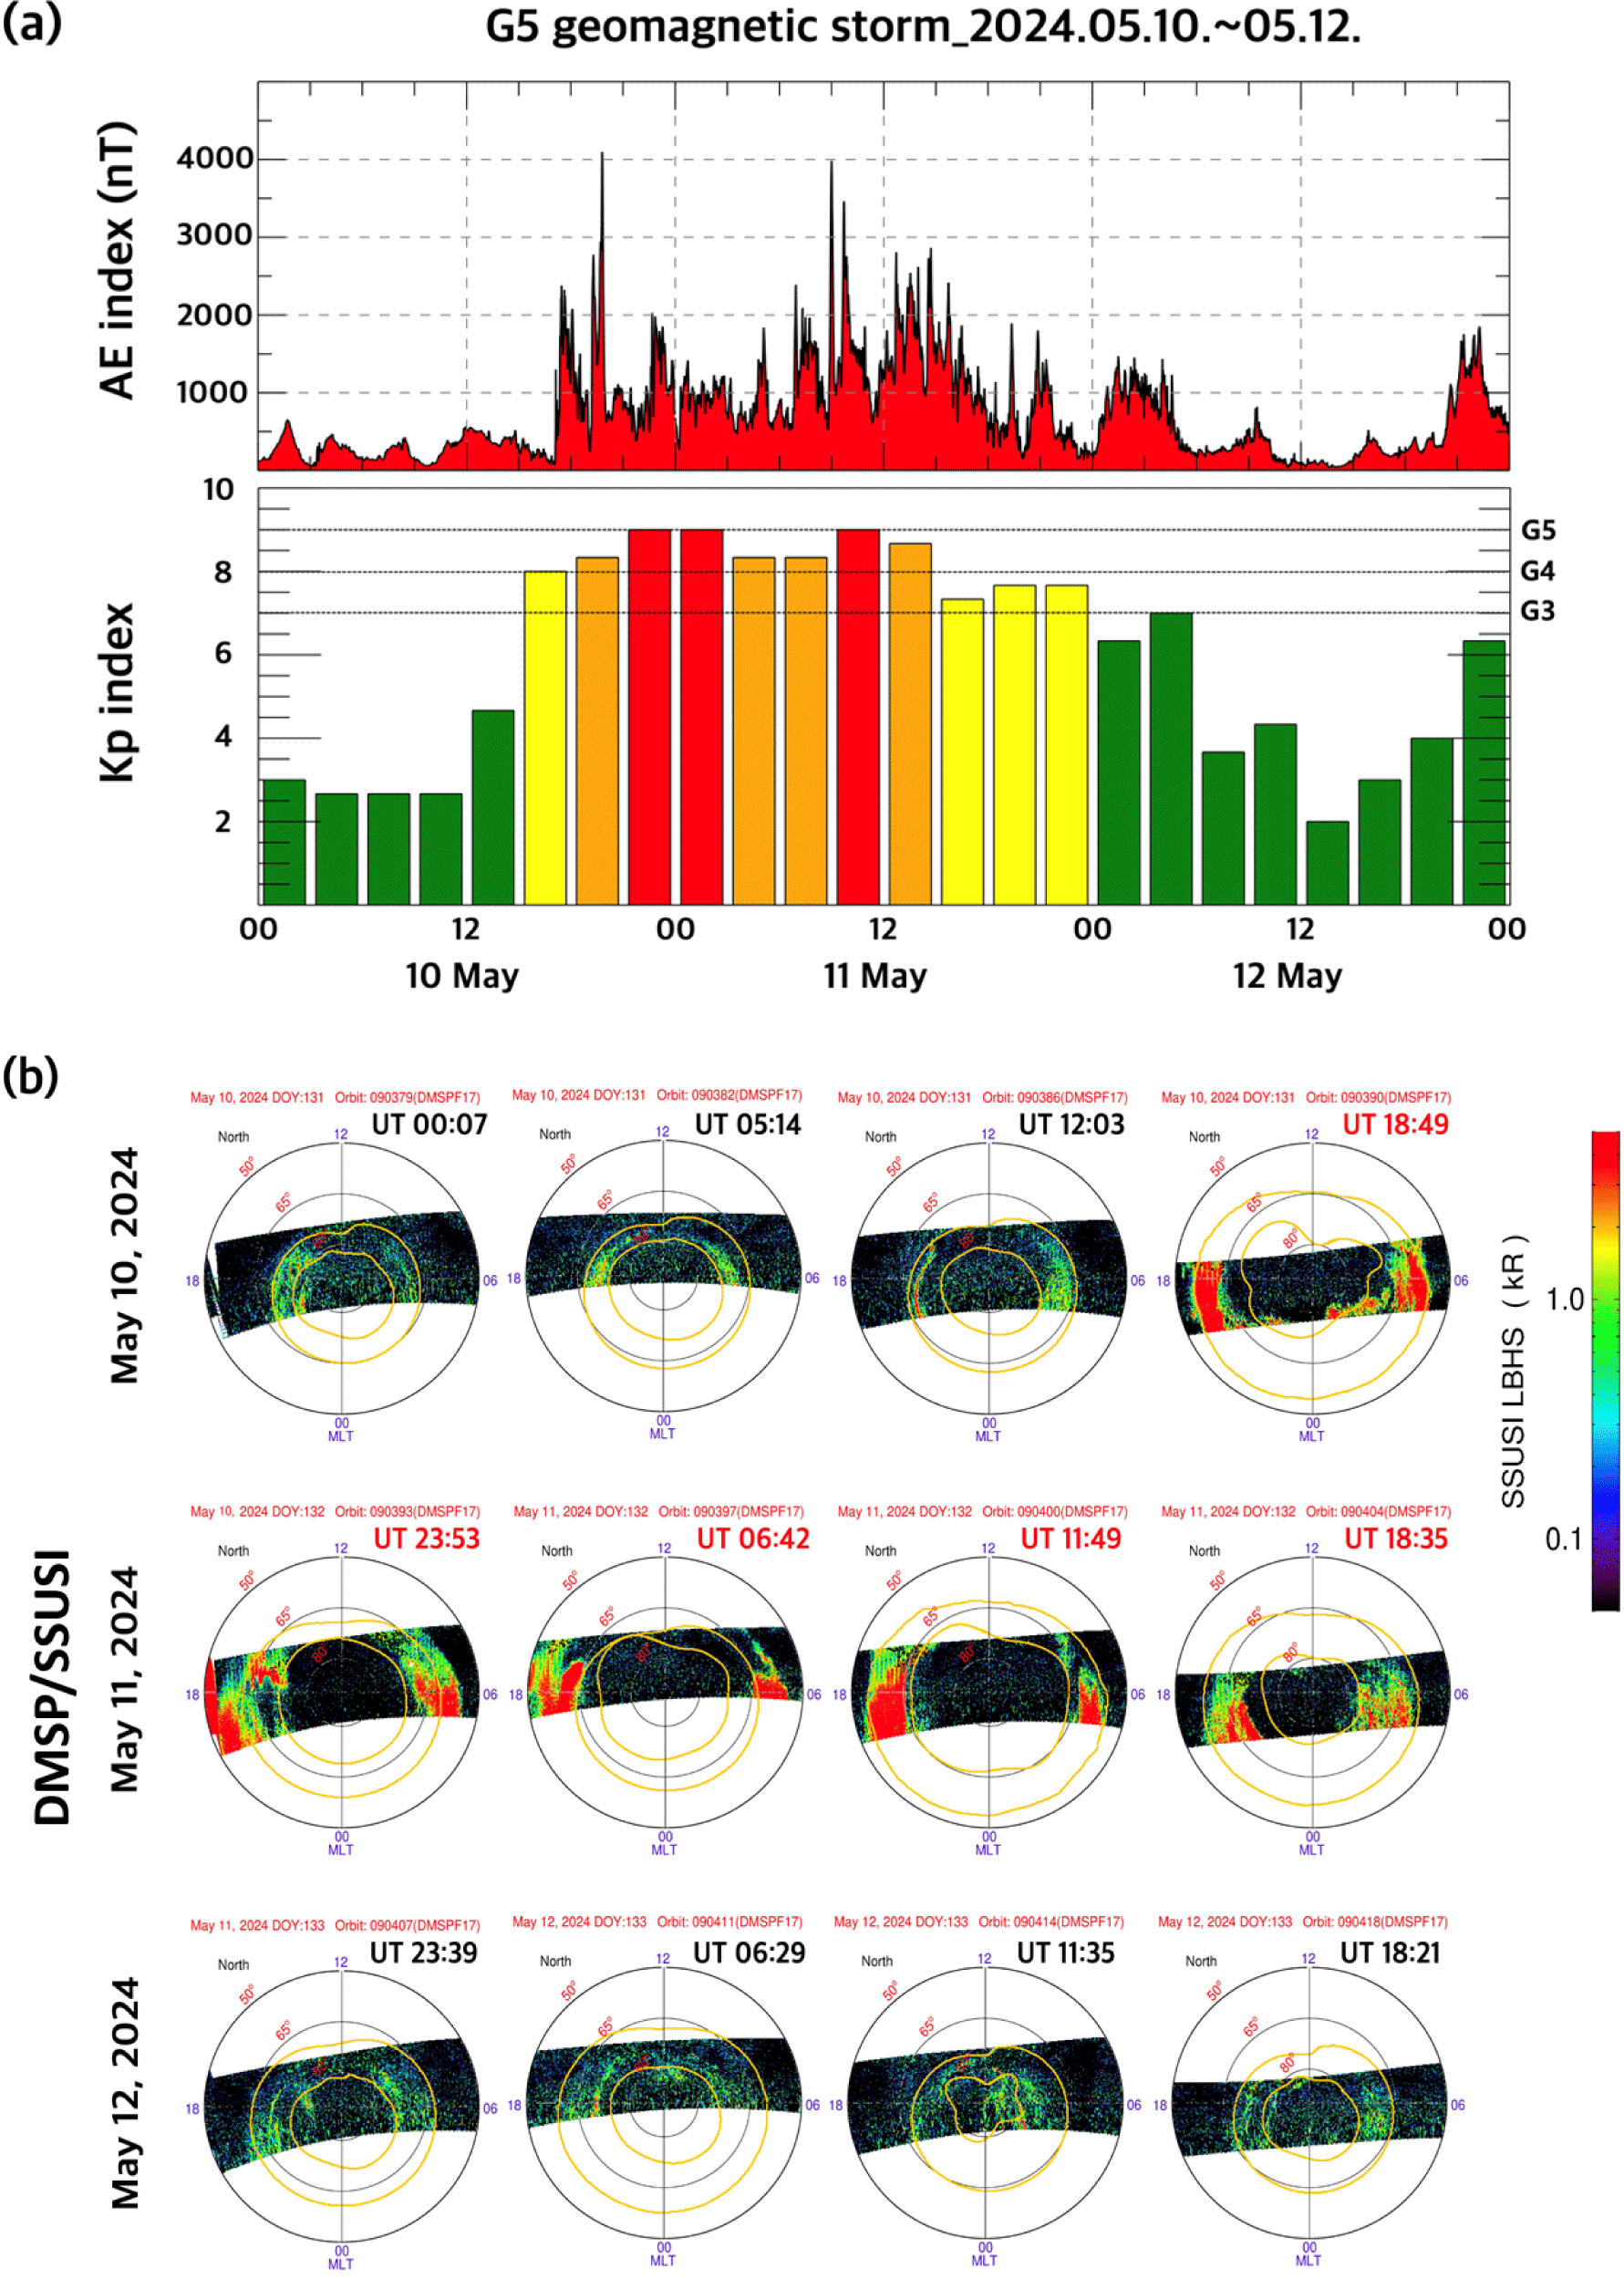
We additionally confirmed the intensity of the auroral activity using space-based observation. We examined the intensity of the Lyman-Birge-Hopfield short band from the far ultraviolet (FUV) observations (https://ssusi.jhuapl.edu/data_availability) of the Special Sensor Ultraviolet Spectrographic Imager (SSUSI) onboard the Defense Meteorological Satellite Program (DMSP) satellite operated by the Johns Hopkins University/Applied Physics Laboratory (JHU/APL). Fig. 8(b) shows data from May 10 to 12 with images of the northern hemisphere at approximately 6-hour intervals, demonstrating increasing auroral activity immediately after the geomagnetic storm started at 18:49 UT on May 10. However, DMSP/SSUSI images have limitations in showing the latitudinal extent and full MLT variations of the auroras because DMSP/SSUSI only observes the Dawn-Dusk sector. Additionally, the auroral boundary (yellow solid line) values are derived from the Global Ultraviolet Imager (GUVI) model (Zhang & Paxton, 2008), which is incorporated with the DMSP/SSUSI data. The KASI has worked to address observational gaps through its space program, the Republic of Korea Imaging Test System, and through the application of artificial intelligence techniques.
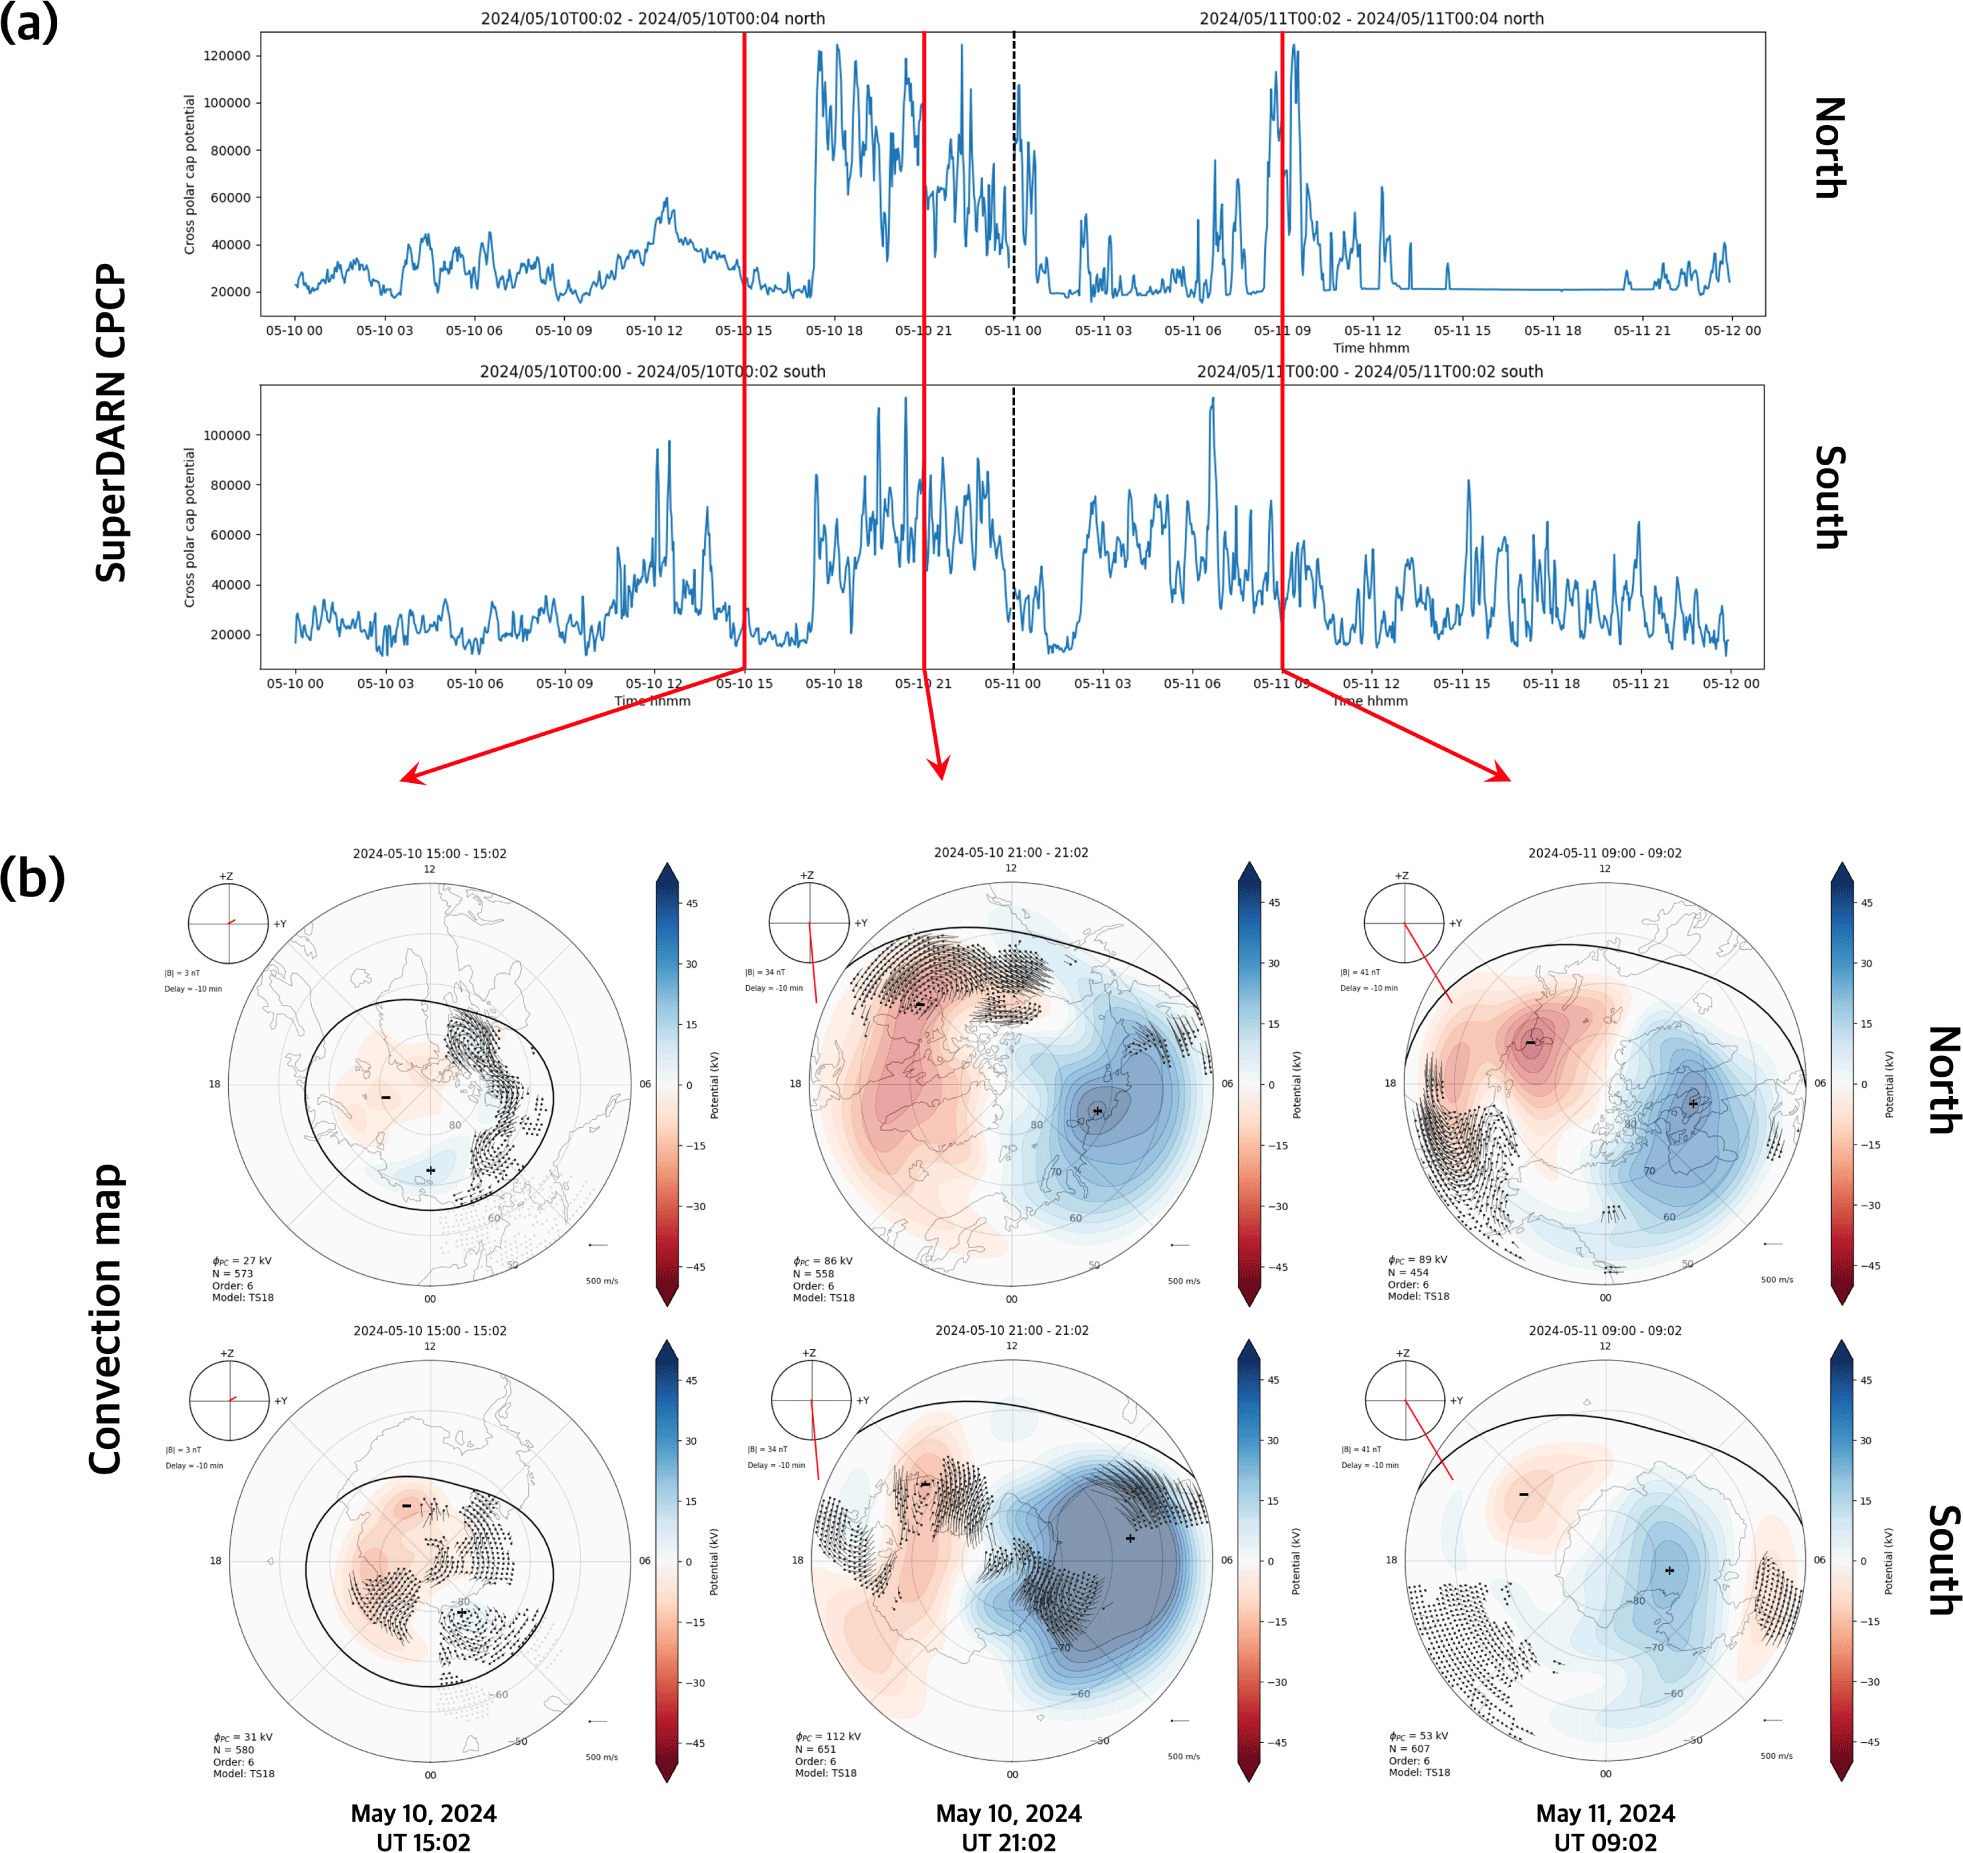
We examined additional observation data to estimate the energy influx into high-latitude regions. While previous data focused on auroral activities due to high-energy particles from geomagnetic storms, the following data show changes in the electric field from a magnetosphere-ionosphere coupling perspective. As seen in Fig. 9(a), the Cross Polar Cap Potential (CPCP) represents the electric potential difference over the polar region, calculated using the Super Dual Auroral Radar Network (SuperDARN) radar data (Greenwald et al. 1995; Chisham et al. 2007; Nishitani et al. 2019) from both hemispheres, typically expressed in kilovolts (kV). This potential difference between the dawn and dusk sectors indicates the interaction strength between the solar wind and Earth’s magnetosphere, showing a high correlation with the Interplanetary Electric Field y-component (IEFy). Fig. 9(a) illustrates the changes in potential differences across the polar ionosphere. Similar to the AE index and DMSP/SSUSI data, there is a sudden increase in CPCP around 17:00 UT on May 10, indicating a strong voltage surge. We also examined the plasma convection map from the SuperDARN, shown in Fig. 9(b). We selected three-time points in the CPCP time series (marked by red vertical lines) and placed the corresponding convection maps in Fig. 9(b). Comparing the first and second points from the left, it is evident that the size of the two-cell convection in the polar region significantly increases during the geomagnetic storm. Additionally, as shown by the color contours and grey lines, the potential difference in the polar region increases and equatorward auroral boundaries are expanded. The auroral boundary values are determined using the OVATION PRIME model (Newell et al., 2009, 2010).
5. UPPER ATMOSPHERIC RESPONSES TO THE GEOMAGNETIC STORM
We confirmed the amount of energy influx into high latitudes through data in the previous section. In this section, we examine how this energy is globally distributed. The energy influx into high latitudes significantly impacts the thermosphere. Joule heating, caused by current encountering resistance, and auroral heating, from high-energy particles colliding with the neutral atmosphere, can heat the thermosphere and trigger global responses (Shinbori et al. 2022; Kim et al. 2023).
Fig. 10(a) shows the global map of the oxygen-to-nitrogen ratio (O/N2) observed by the Global Ultraviolet Imager (GUVI) onboard the Thermosphere-Ionosphere-Mesosphere-Energetics and Dynamics (TIMED) satellite (https://guvitimed.jhuapl.edu/guvi-galleryl3on2). Oxygen atoms contribute to the production rate of ionospheric electron density, while nitrogen molecules contribute to the recombination process. Thus, tracking the O/N2 ratio reveals the primary neutral atmospheric components affecting ionospheric formation. As seen in Fig. 10(a), the O/N2 ratio on May 11 is lower than on May 10 in high-latitude regions. The lower O/N2 ratio indicates a higher N2 density, meaning that during the geomagnetic storm, heating in the thermosphere causes the scale height of atmospheric components to increase, allowing nitrogen molecules to rise to higher altitudes. This lower O/N2 ratio implies significant energy influx into high-latitude regions, as confirmed by TIMED/GUVI data in Fig. 10(a).
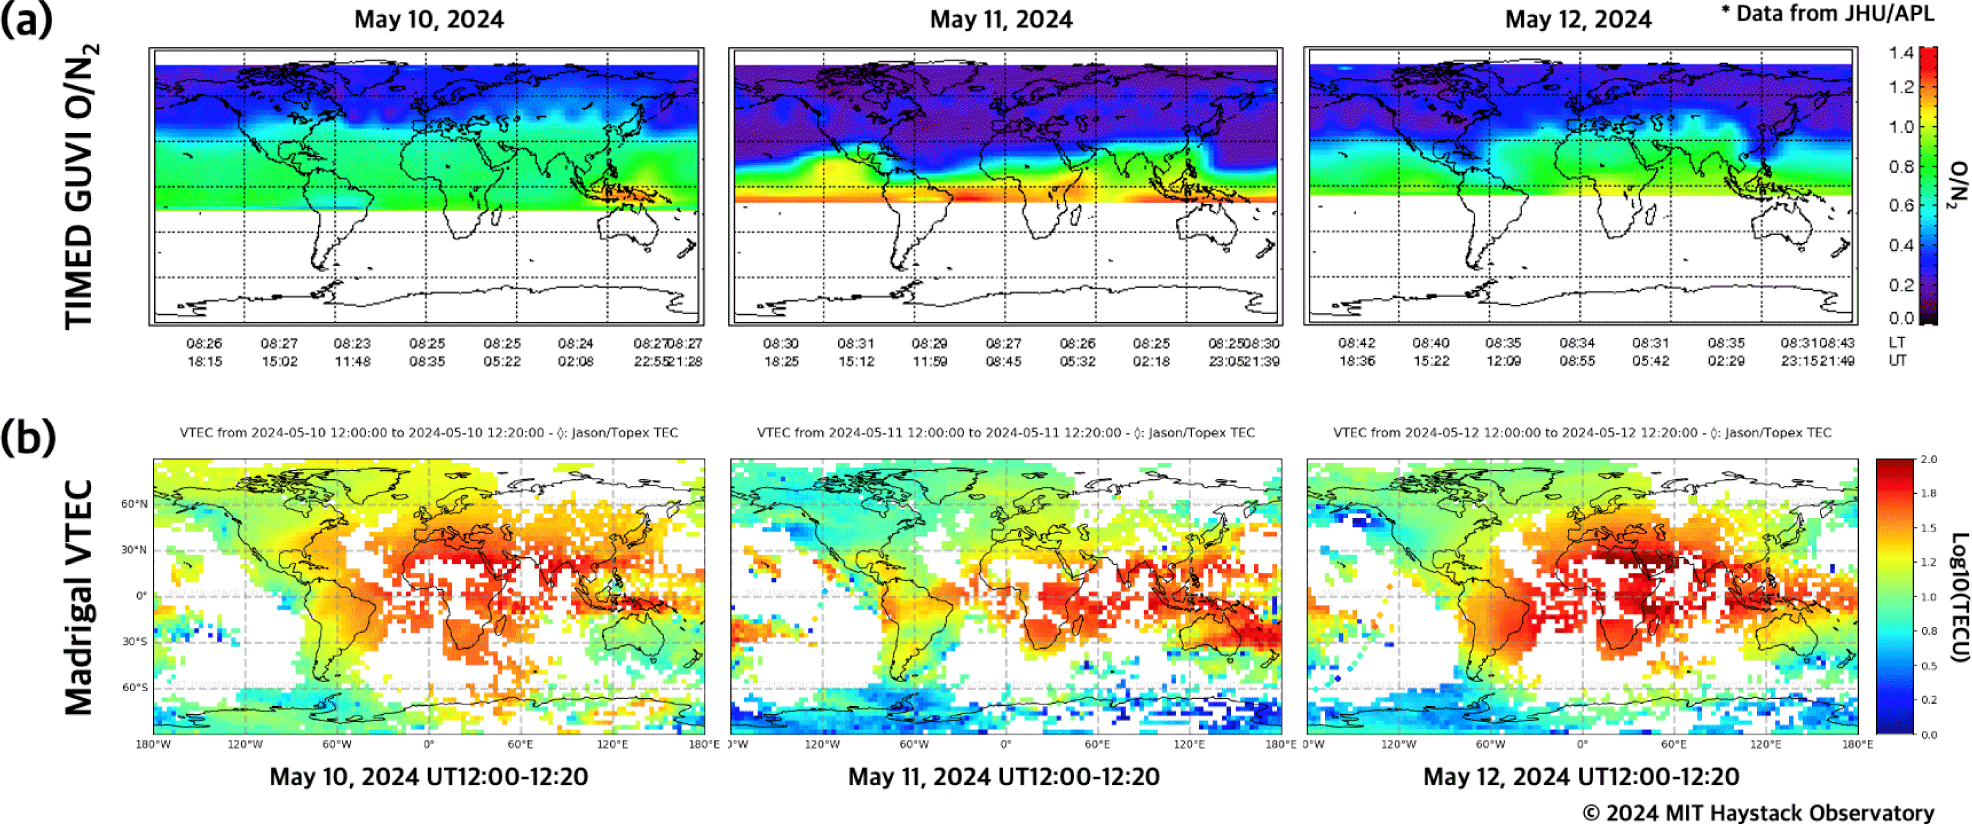
Next, we examined the changes in electron density. Fig. 10(b) presents the global vertical total electron content (VTEC) maps at 12:00 UT from May 10 to 12, provided by the MIT Haystack Observatory’s Madrigal database (http://millstonehill.haystack.mit.edu/list). The VTEC on May 11 decreases in high-latitude regions, consistent with the observed drop in the O/N2 ratio. These two datasets together illustrate the interactions between the thermosphere and ionosphere during the geomagnetic storm.
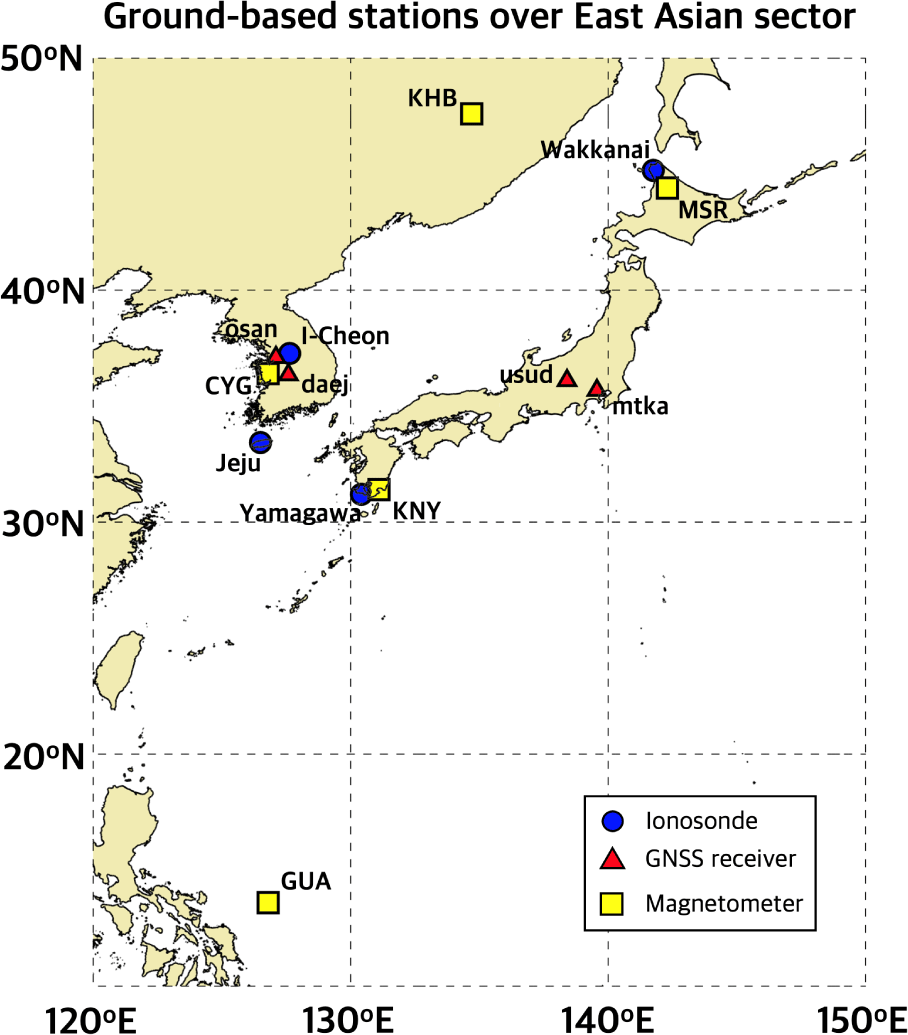
Next, we analyzed ground-based observation data, particularly focusing on data from the Far East Asia longitude sector where Korea is located. This includes ionosonde and Global Navigation Satellite System (GNSS) receiver data. The data from the I-Cheon and Jeju sites were provided by the SAO-X database server, which is linked to the Global Ionospheric Radio Observatory (GIRO) network (Reinisch & Galkin 2011). The data from the Wakkanai and Yamagawa sites were downloaded from https://wdc.nict.go.jp/Ionosphere. Also, the GNSS RINEX data and navigation files were obtained from the website (https://cddis.nasa.gov/archive/gnss/data/daily/), and the Differential Code Bias (DCB) files for total electron contents (TEC) calculation were obtained from ftp.aiub.unibe.ch. The GNSS VTEC calculation was performed using the gopi 3.5v program (Seemala 2023). Detailed information about each dataset can be found in Fig. 11 and Table 2.
First, we examined changes in ionospheric plasma density. Fig. 12(a) shows the diurnal variation of foF2 from the ionosonde, and Fig. 12(b) shows the diurnal variation of VTEC from GNSS receivers. The black solid line represents the quiet reference, selected based on the international quietest 5 days. The observations for each day are shown in red. The International Quietest Days (IQDs) are selected based on the Kp index to identify the quietest days of each month (Matzka et al. 2021). Typically, the 10 quietest days are labeled from Q1 to Q10. Depending on the study, researchers may use either 5 IQDs or 10 IQDs as a reference. In this study, we utilized the 5 quietest days of May 2024. After the geomagnetic storm began at 18:00 UT on May 10, both the ionosonde and VTEC in East Asia displayed a strong negative ionospheric storm, as also evident in the Madrigal VTEC maps. The case of the negative storm in this East Asian sector has also been interpreted with a similar mechanism involving the O/N2 ratio in a previous study by Kim et al. (2024).
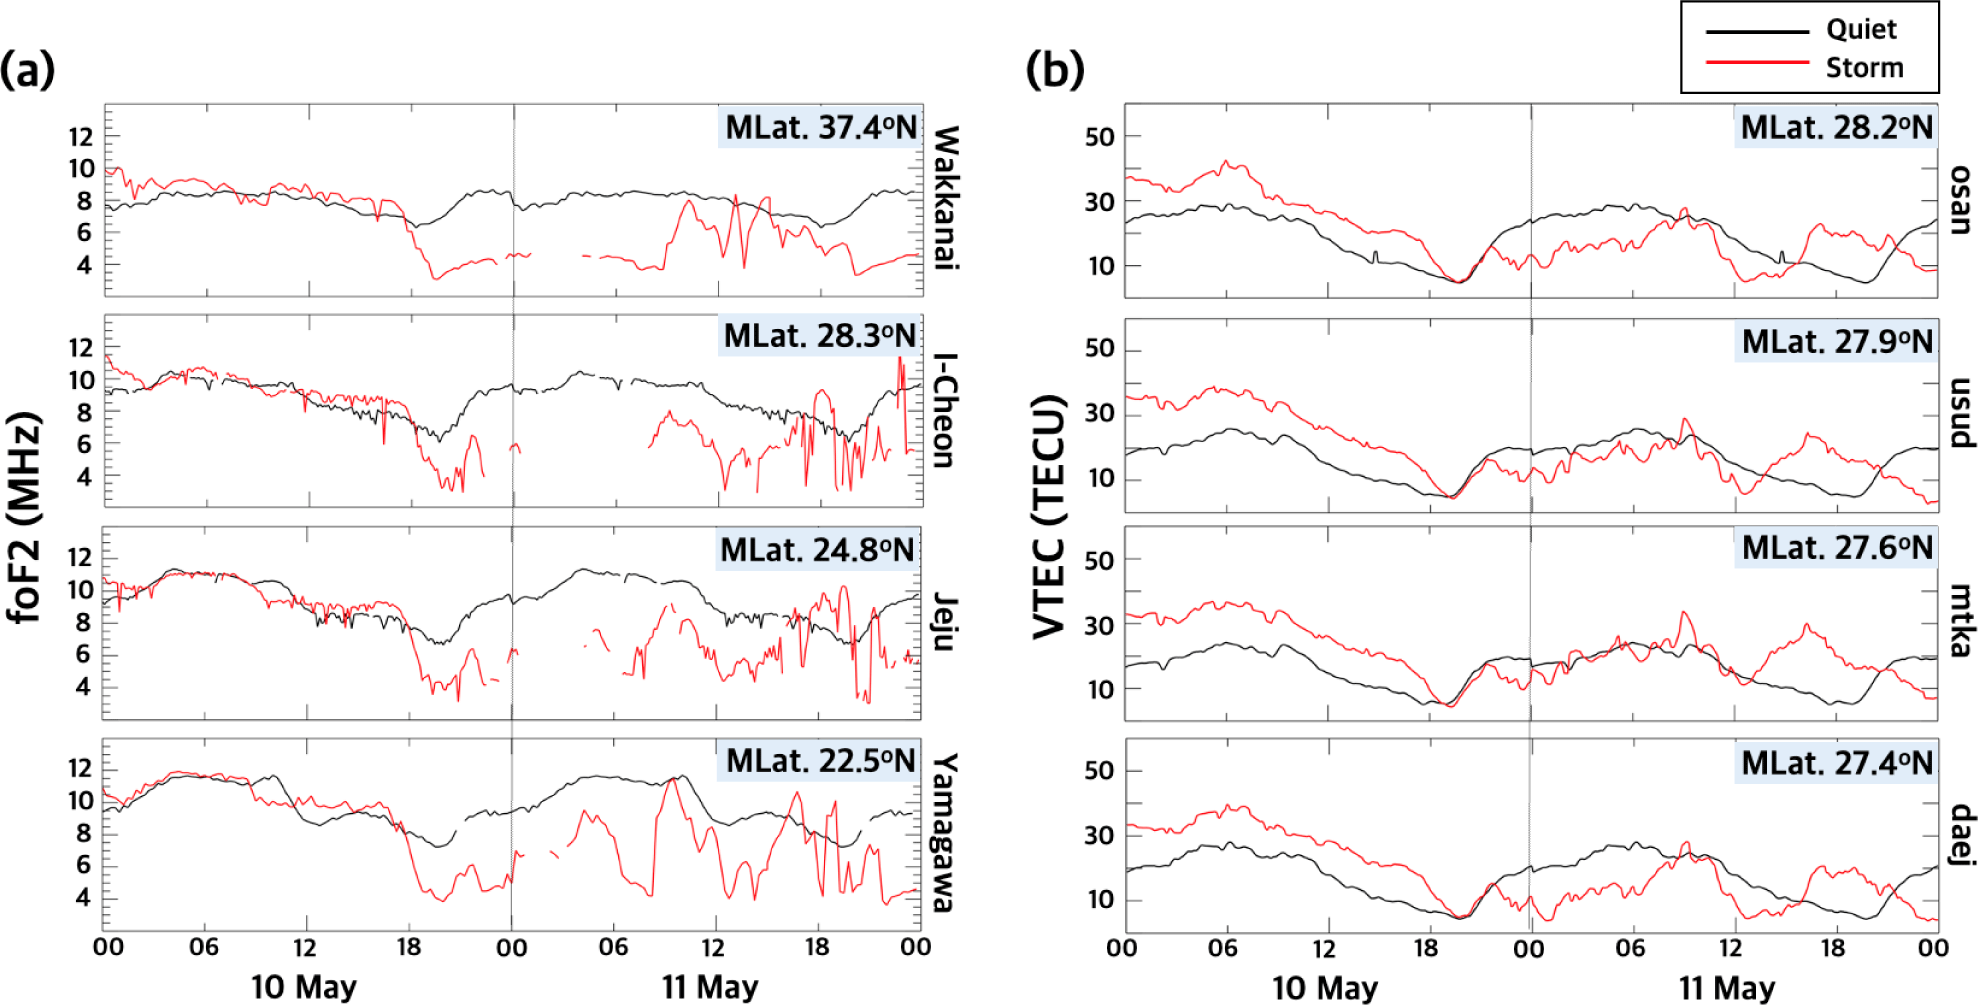
Interestingly, the VTEC data showed positive values higher than the quiet reference before the storm on May 10, indicating a need for further analysis. After 22:00 UT on May 10, significant fluctuations in foF2 occurred, likely residual effects from various wave-like perturbations caused by the geomagnetic storm, requiring more detailed future analysis. Additionally, the increase in VTEC observed on the nighttime of May 11 is a very unique phenomenon, and we plan to conduct a more thorough and additional study on this matter.
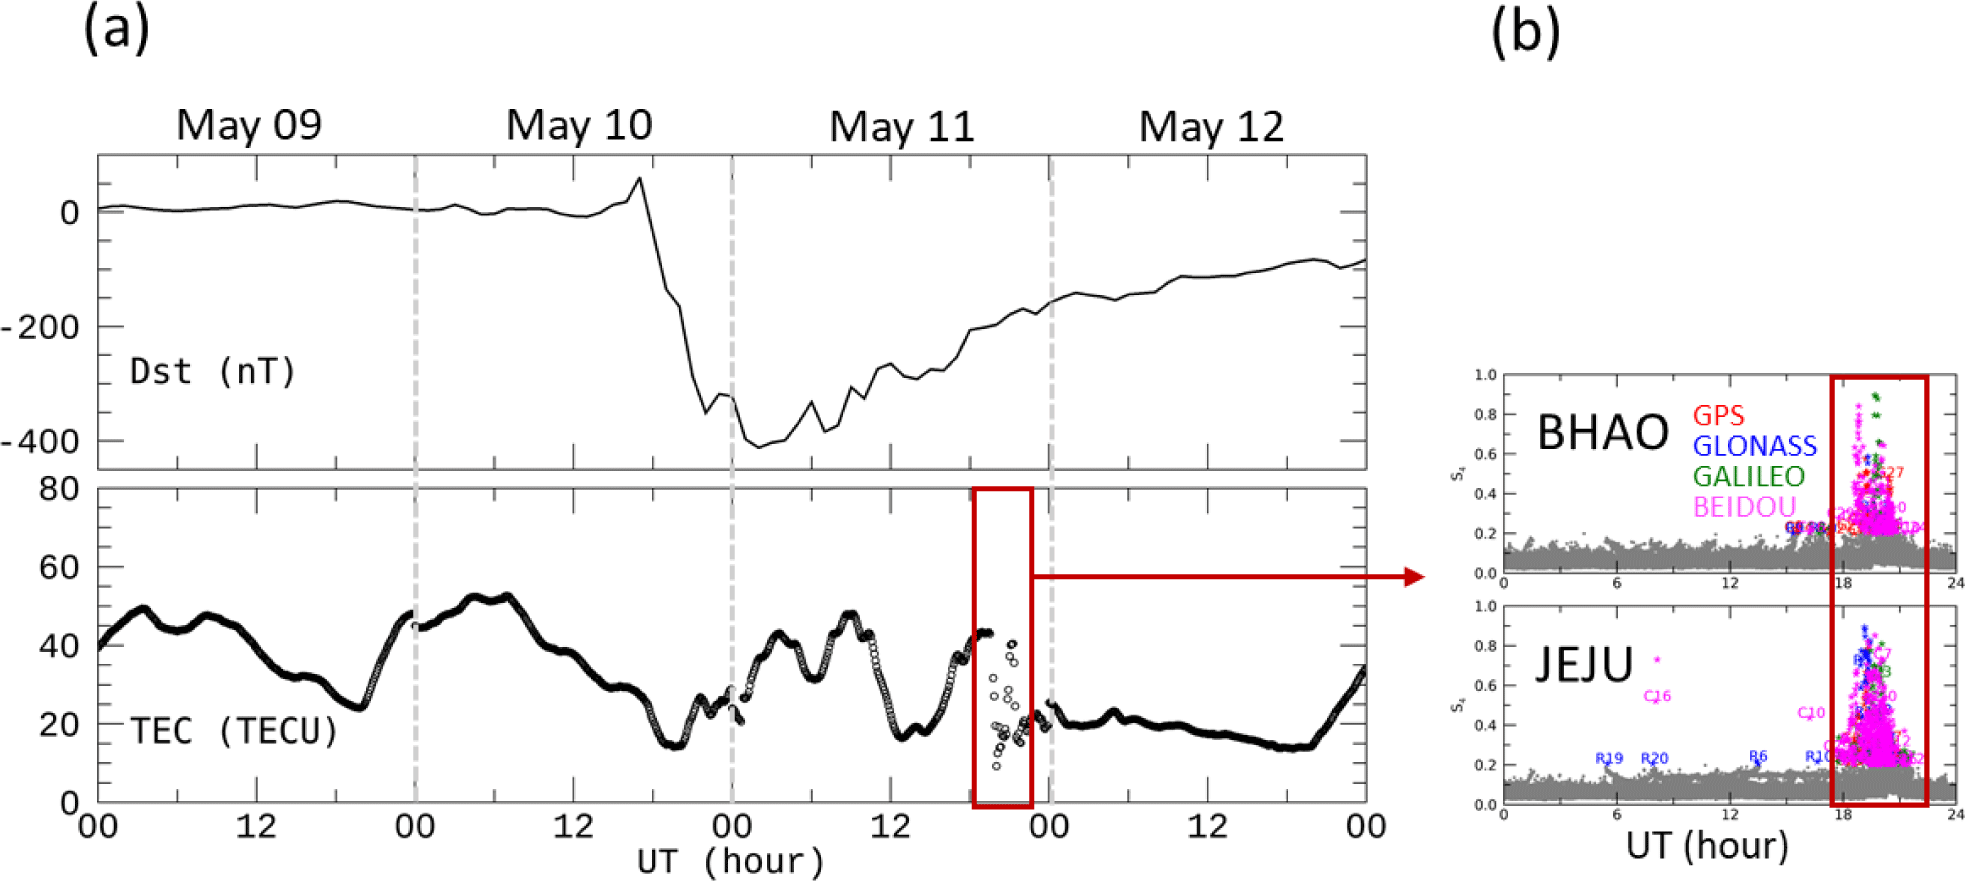
Lee et al. (2024) also identified significant TEC disturbances on May 11 and a subsequent decrease in TEC on May 12. Fig. 13 is a modified version of Fig. 3 in Lee et al. (2024). Fig. 3(a) depicts TEC variations from May 9 to May 12, along with the Dst index. TEC data were estimated from the Quasi-Zenith Satellite System (QZSS) geostationary satellite data at the Daejeon GNSS station. Because the ionospheric pierce point is consistent for geostationary satellites, this TEC variation reflects temporal TEC disturbances. Their study reports a sudden TEC increase beginning around 12 UT (21 LT) on May 11, with severe irregularities from 18 UT to 21 UT. This period of intense disturbances was accompanied by a marked rise in the amplitude scintillation (S4 index) of GNSS signals, as shown in Fig. 13(b). The causes of the sudden TEC increase during the night and the associated intense scintillation require further investigation.
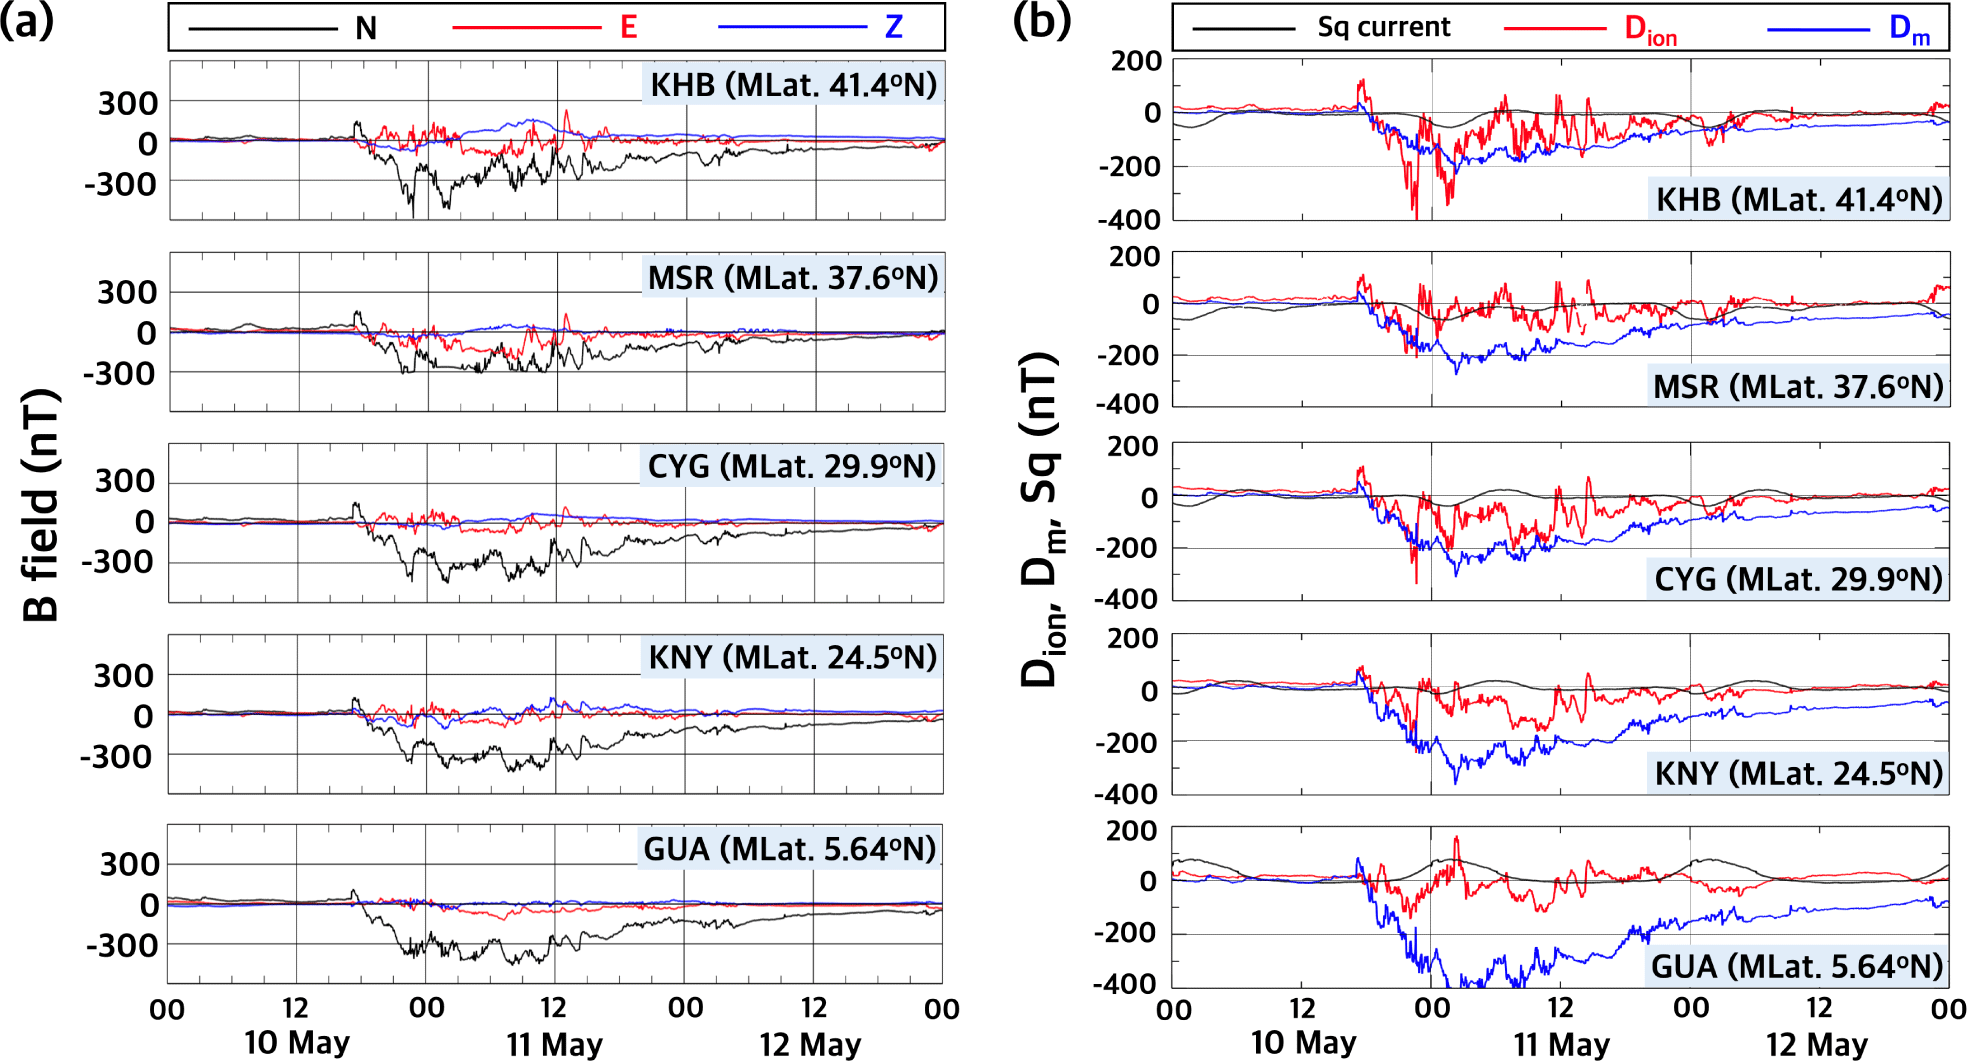
We examined the local magnetometer data along the longitudinal line near the Korean Peninsula. The purpose of this analysis is to infer the responses from the magnetosphere to the ionosphere. Specifically, the combination of solar wind speed and the IMF Bz component can form a strong dawn-to-dusk electric field in the magnetosphere. It can induce a globally projected PPEF that results in a strong eastward electric field on the dayside. As PPEF projects strongly and instantaneously, its effects can be observed simultaneously across various latitudes in magnetometer responses. We selected data from five magnetometers [Khabarovsk (KHB), Moshiri (MSR), Cheongyang (CYG), Kanoya (KNY), Guam (GUA)] around the Korean Peninsula from the SuperMAG network (https://supermag.jhuapl.edu/info/) (Gjerloev 2009; 2012), categorized by latitude. Details are provided in Table 2 and Fig. 11.
Fig. 14(a) presents the N, E, and Z components of the five magnetometers. As observed, around 18:00 UT on May 10th, the N component exhibits a slight increase due to the SSC, followed by negative values. This indicates a weakening of the northward component of the geomagnetic field after the SSC. Additionally, higher latitudes show significant changes in the E and Z components. This aligns well with the theoretical understanding that interactions between the solar wind and Earth’s magnetosphere result in strong current system changes, particularly at higher latitudes.
We can derive the H component of magnetometer data, and it can be expressed as a superposition of various components as shown in the following equation (Huy & Amory-Mazaudier 2005; Nava et al. 2016; Vankadara et al. 2022; Imtiaz et al. 2024).
Here, H0 represents the Earth’s core magnetic field, typically measured at midnight on quiet days. The Sq (Solar Quiet) current represents the diurnal variation in the magnetic field on quiet days, calculated as the difference between the average magnetic field (H) measured by the magnetometer on geomagnetically quiet days and the baseline magnetic field (H0). Consequently, Sq current is expressed in the same unit as the magnetometer data, which is nanoteslas (nT). The DM current indicates the disturbances caused by magnetospheric currents and is calculated using the dip angle of each magnetometer and the SYM-H index, which represents mainly the ring current. The ionospheric disturbance dynamo current, commonly called Dion, is a significant factor in studying geomagnetic disturbances. The calculation of Dion involves several key terms and steps, each contributing to the overall understanding of the ionospheric current system.
In Fig. 14(b), the Sq, DM (~DP2), and Dion current components calculated from the magnetometer N, E, and Z data are plotted. In the case of Dion current (red solid line), we note more active variations at high latitudes. This is because the geomagnetic storm-induced magnetosphere-ionosphere current system variations are more significant in high-latitude regions. Conversely, the DM current (blue solid line) is significantly influenced by mainly the variations in the ring current, thus showing greater variability in equatorial regions. The Sq current, which strengthens on the dayside, clearly illustrates the daily variation between day and night. On the dayside in the Northern Hemisphere, the Sq current forms in a counterclockwise direction. Therefore, at equatorial regions, as represented by the GUA magnetometer, a strong eastward current is formed, which appears as a positive value in the magnetometer data. At higher latitudes, the current direction shifts to the west, weakening the E component in the magnetometer data, resulting in negative values. This pattern is clearly depicted in Fig. 14(b), illustrating the changes with latitude. By distinguishing each component from the magnetometer data, we have identified which current system component had a more significant influence by latitude. The simultaneous onset of variability across all latitudes suggests that the PPEF effect spanned across all latitudes at the onset of the storm. Further detailed timing and analysis will be conducted in future studies.
KASI has been operating airglow all-sky cameras (ASCs) at Bohyun Mountain (36.21°N, 128.97°E) since 2012 and at the Jang Bogo Station, Antarctica (74.62°S, 164.23°E) since 2016. The ASC observes airglow emitted from specific altitudes to estimate the characteristics at those altitudes. The KASI ASC system observes emissions of the green line (OI-557.7 nm) and red line (OI-630.0 nm), originating from altitudes of 95 and 250 km respectively, able to detect not only the constant airglow but also auroral phenomena. During the May G5 storm, auroral emissions at both wavelengths were observed at the geomagnetic latitude of the Jang Bogo Station (Fig. 15(a)). Fig. 15(b) shows the total pixel intensity in the 5 × 5 pixel area at the zenith on ASC images for the red line and green line. This indicates the intensity of the aurora covering up to the zenith direction. The sharp increase and decrease in pixel intensity near 0 UT daily represent the changes in pixel values due to sunlight saturation during sunrise and sunset. The aurora observed on May 11 had approximately 30% of the saturated pixel intensity for the red line, and more than 60% for the green line, indicating a strong aurora.
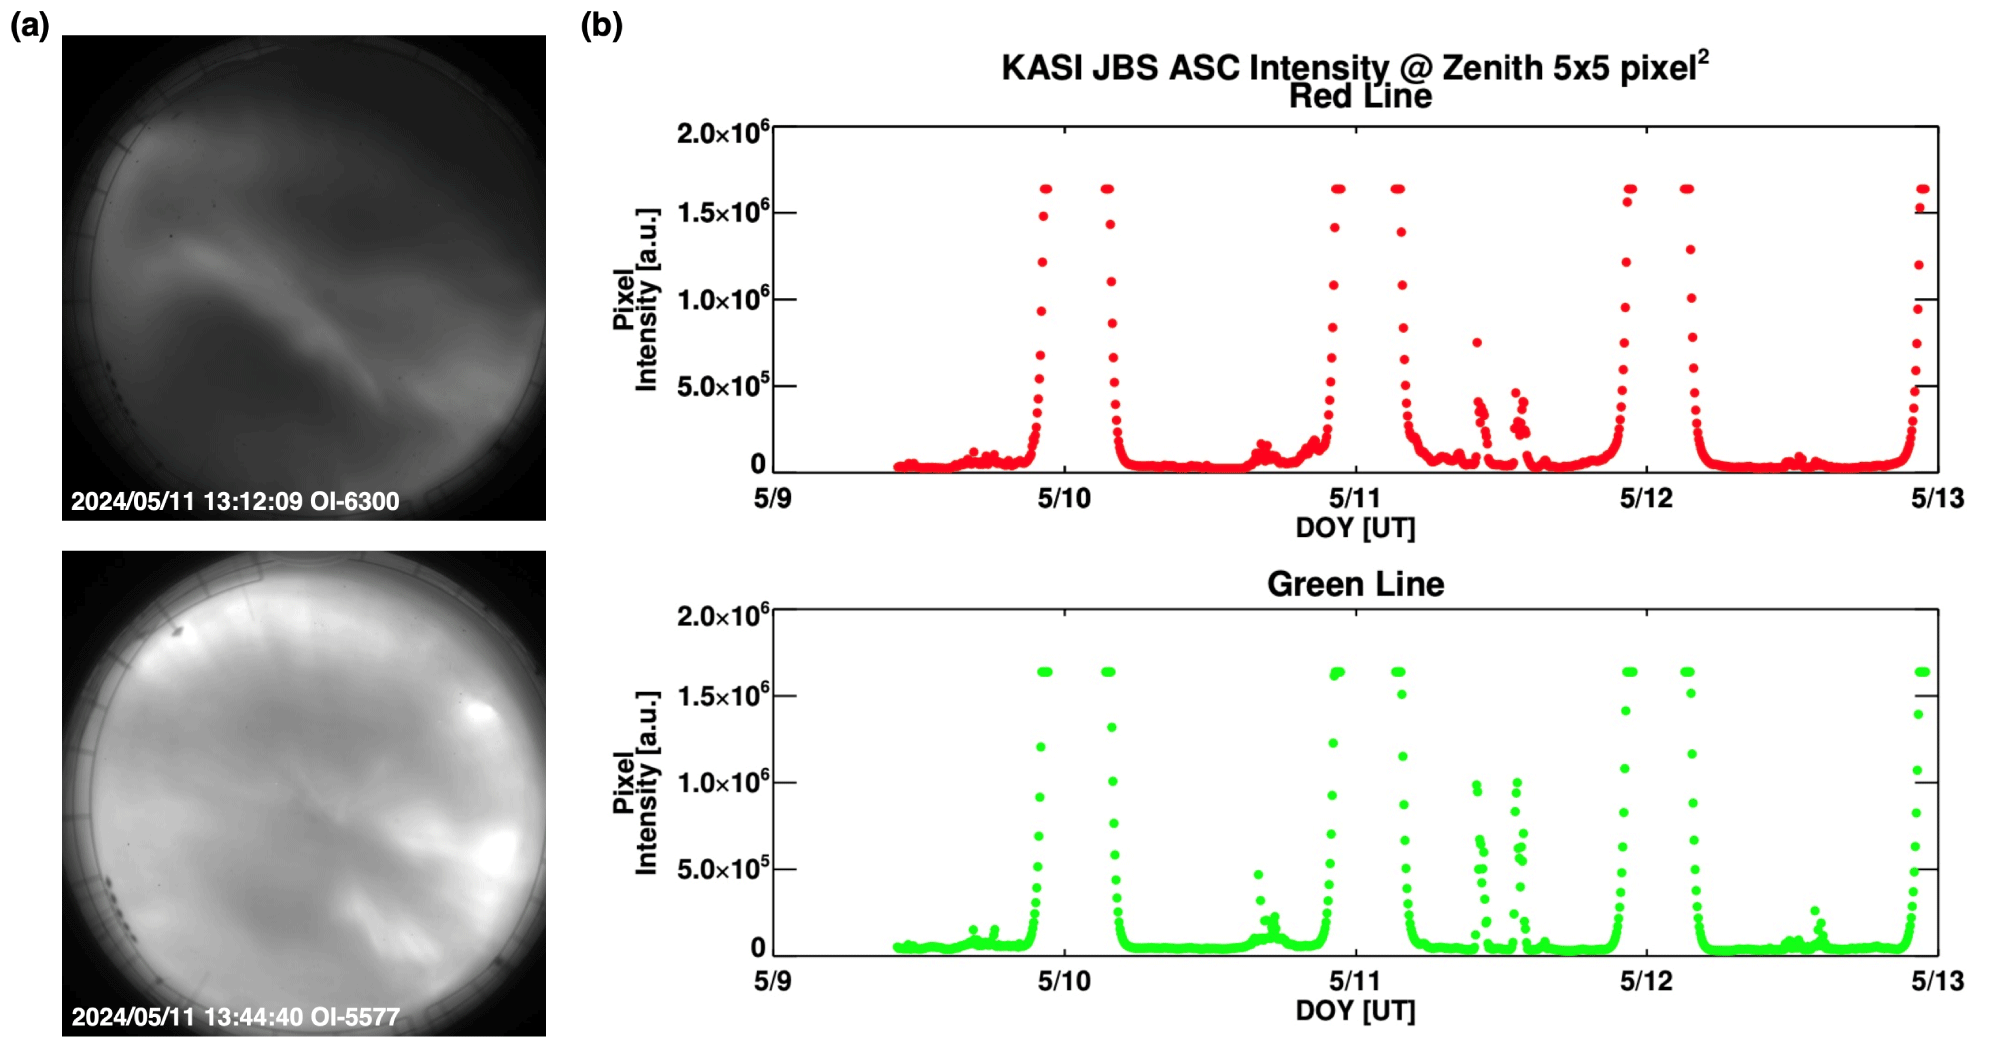
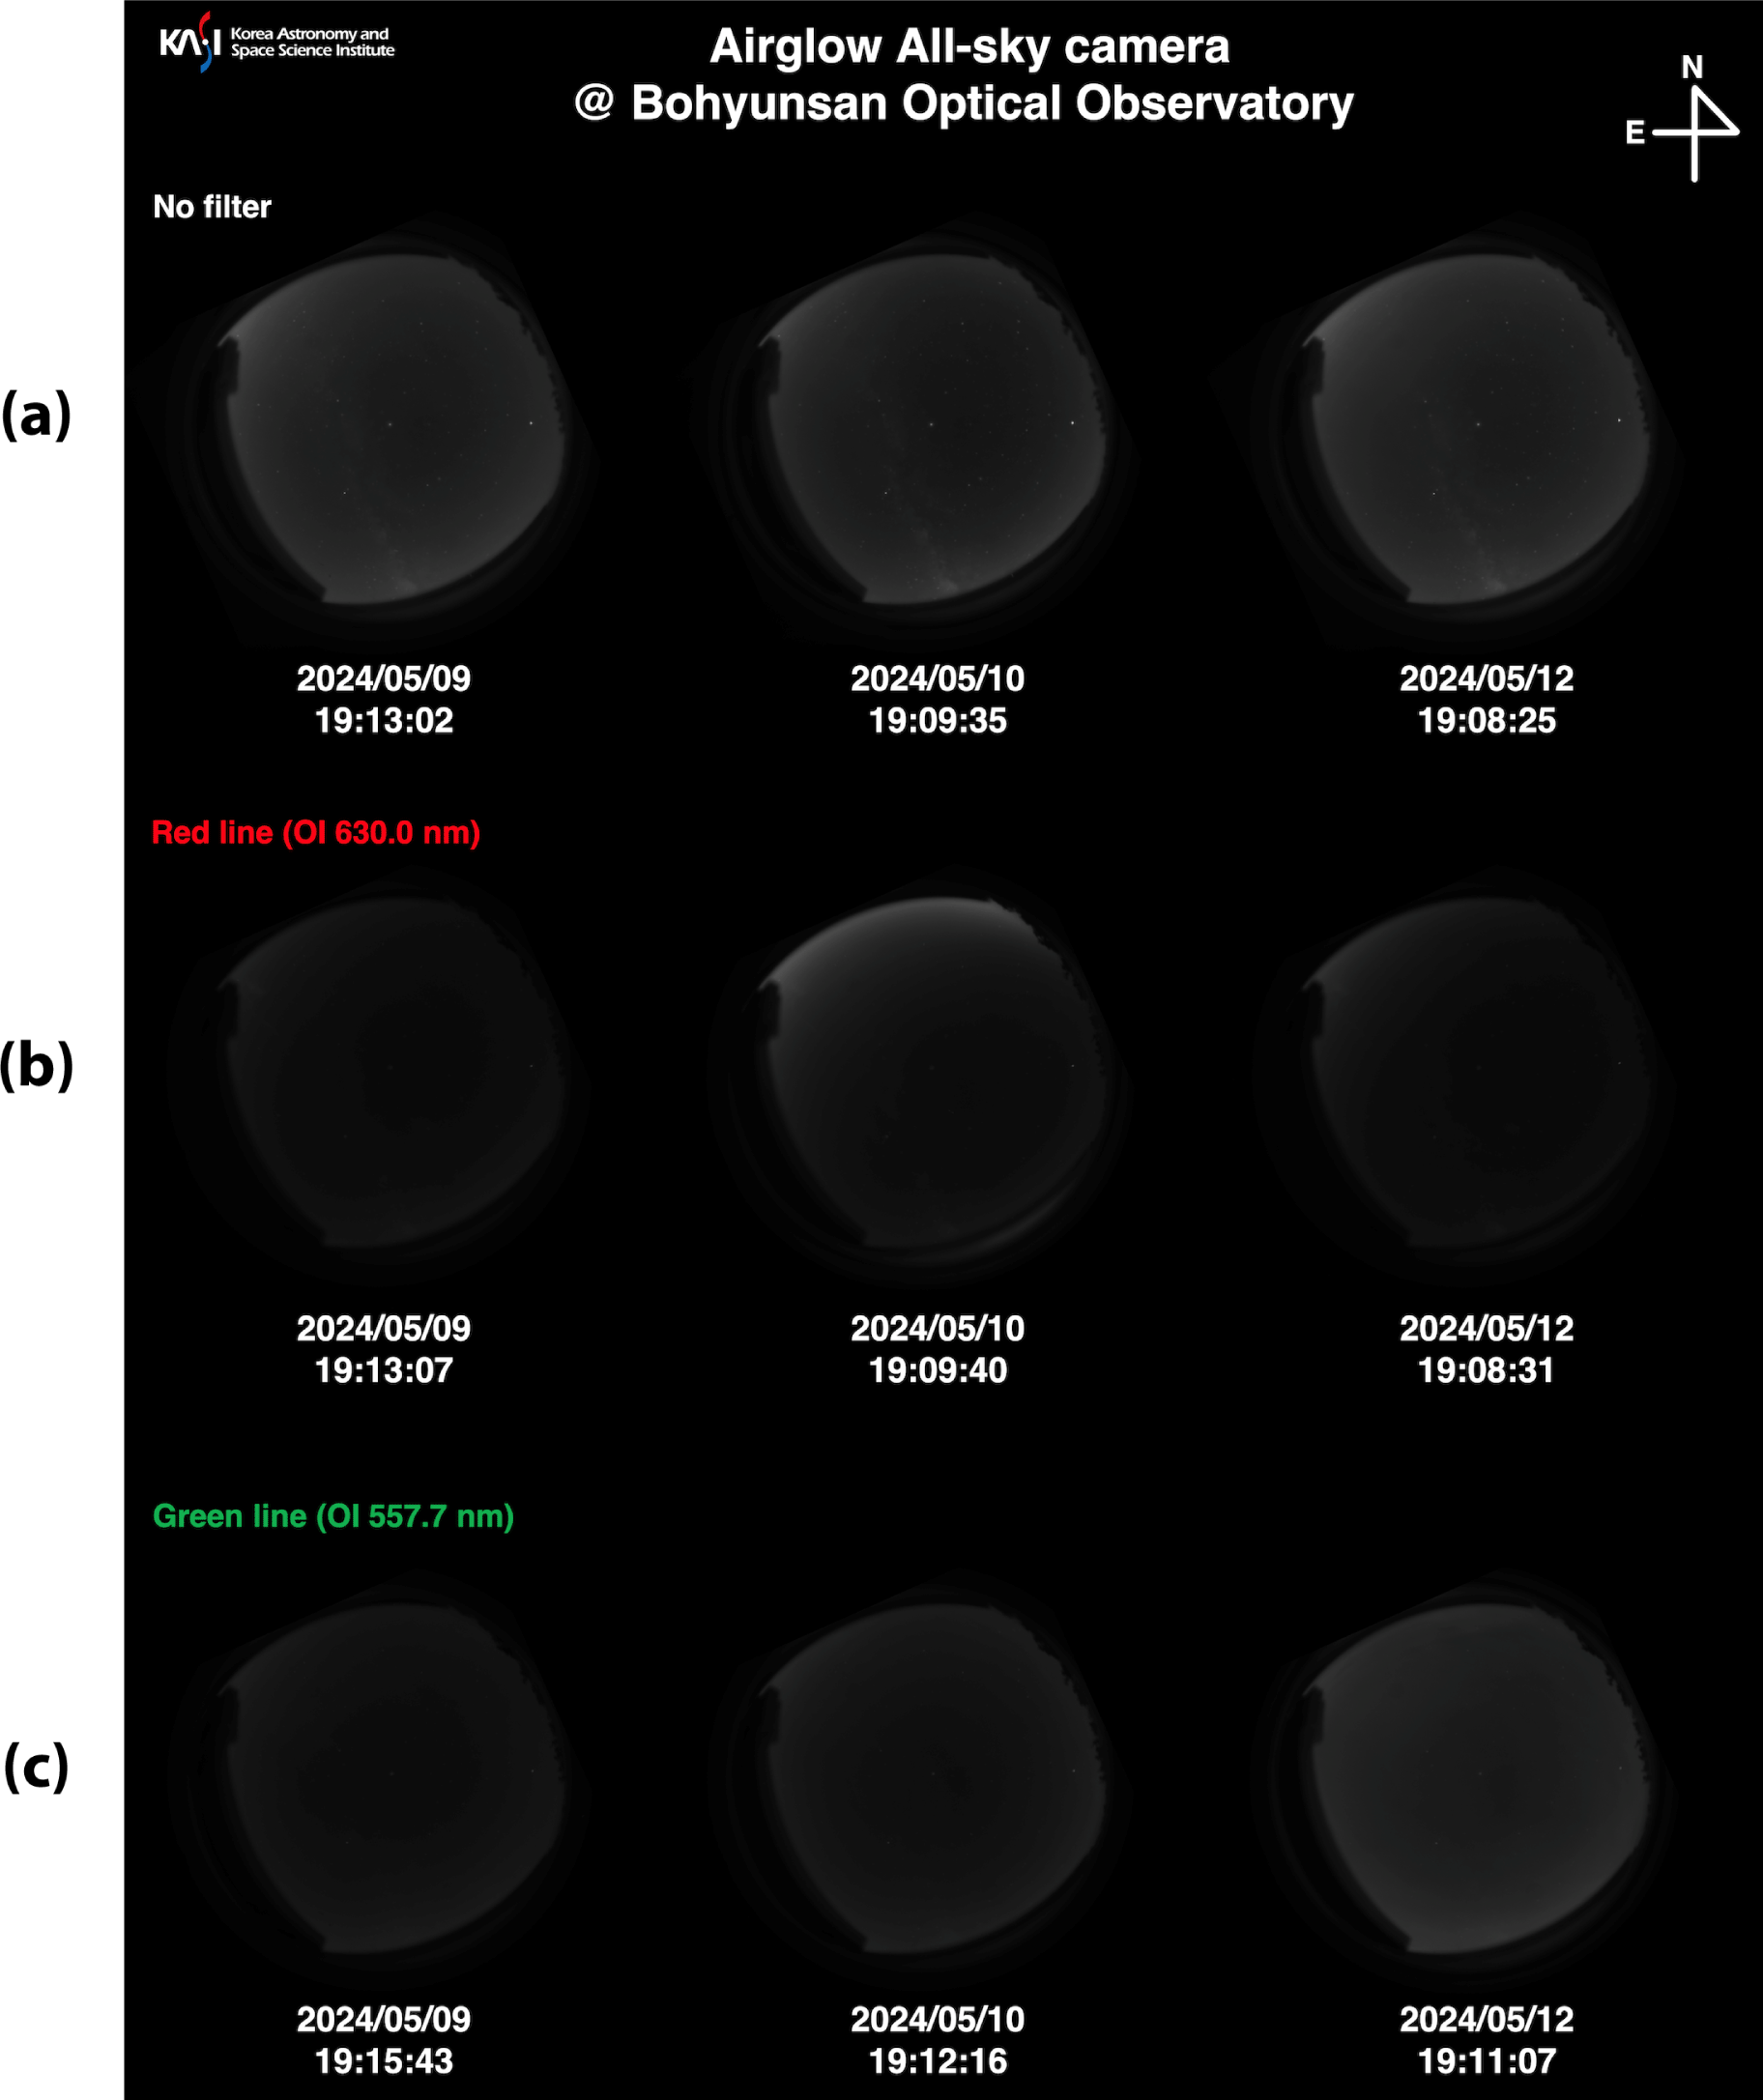
Fig. 16 shows the red line auroral images from the Bohyun Observatory ASC. Auroras observed at the Mt. Bohyun observatory were previously reported on October 29, 2003, during the Halloween Storm (Chung et al. 2007). The recent aurora was observed at 19 UT on May 10, and it was seen at a low elevation angle towards the north-northeast from Bohyun observatory. For comparison, images from a geomagnetically quiet day (the previous day) and the recovered day (May 12) were added. Due to the emission altitude characteristics, auroras above the Korean peninsula can be observed only in the red line, not in the green line, and the red line ASC image on May 11 shows bright features at low elevation in the northern direction.
A neutron monitor is a ground-based instrument that measures neutrons created from cosmic ray collision with the atmosphere. Since its invention by Simpson (1957), neutron monitors have been installed and operated at approximately 50 locations worldwide. We operates two neutron monitors. One has been installed at Jang Bogo station in Antarctica since 2015 (Jung et al. 2016), and the other was installed in Daejeon in 2011 (Kang et al. 2012) but has recently relocated to Mt. Gamak in Geochang (35.59°N, 127.92°E). The energy range of the neutron monitor is ~500 MeV to several GeV. The neutron flux on the ground varies with the solar and geomagnetic activity.
During the G5 storm event on May 11, 2024, our neutron monitors observed decreasing fluxes, which is certainly related to the G5 event. Fig. 17 shows the neutron monitor (NM) counts data (Fig. 16(a)), proton fluxes from GOES-16 (Fig. 16(b)), and radiation dose rates from the low earth orbit space radiation dosimeter (LEO-DOS; Nam et al. 2024) onboard the Next Generation small satellite-2 (NEXTSat-2) (Fig. 16(c)). The neutron monitor shows the decrease rate (%) of the counts using average count value from 6 hours before start time of event. In Fig. 17, the blue solid line represents the NM data installed at Mt. Gamak and the red solid line represents Jang Bogo station in Antarctica. Both NM stations show a Forbush decrease (FD) events in which the average cosmic ray counts rapidly decrease and then gradually recovers. The Jang Bogo neutron monitor began to show a decrease from 18:00 UT on May 10, reaching to the lowest count at 23:00 UT before transitioning to the recovery phase. The Mt. Gamak neutron monitor showed the count increased by about 2% from 18:00 UT to 20:00 UT, then began to decrease at 20:00 UT. The lowest count was reached at 23:00 UT like JBGO, after which it transitioned to the recovery phase. The neutron monitor counts at Mt. Gamak decreased by about 4%, while those at Jang Bogo station decreased by about 11%. Additionally, when the high-energy band of GOES proton flux was observed on May 11, ground level enhancement (GLE) 74 was also detected. The GLE refers to a sudden increase in the neutron counts detected by the neutron monitors. This phenomenon is associated with solar activities such as CMEs and flares. The GLE has been detected 74 times so far, and the number represents its sequence. The characteristics of the observed FD and GLE will be analyzed in future studies.
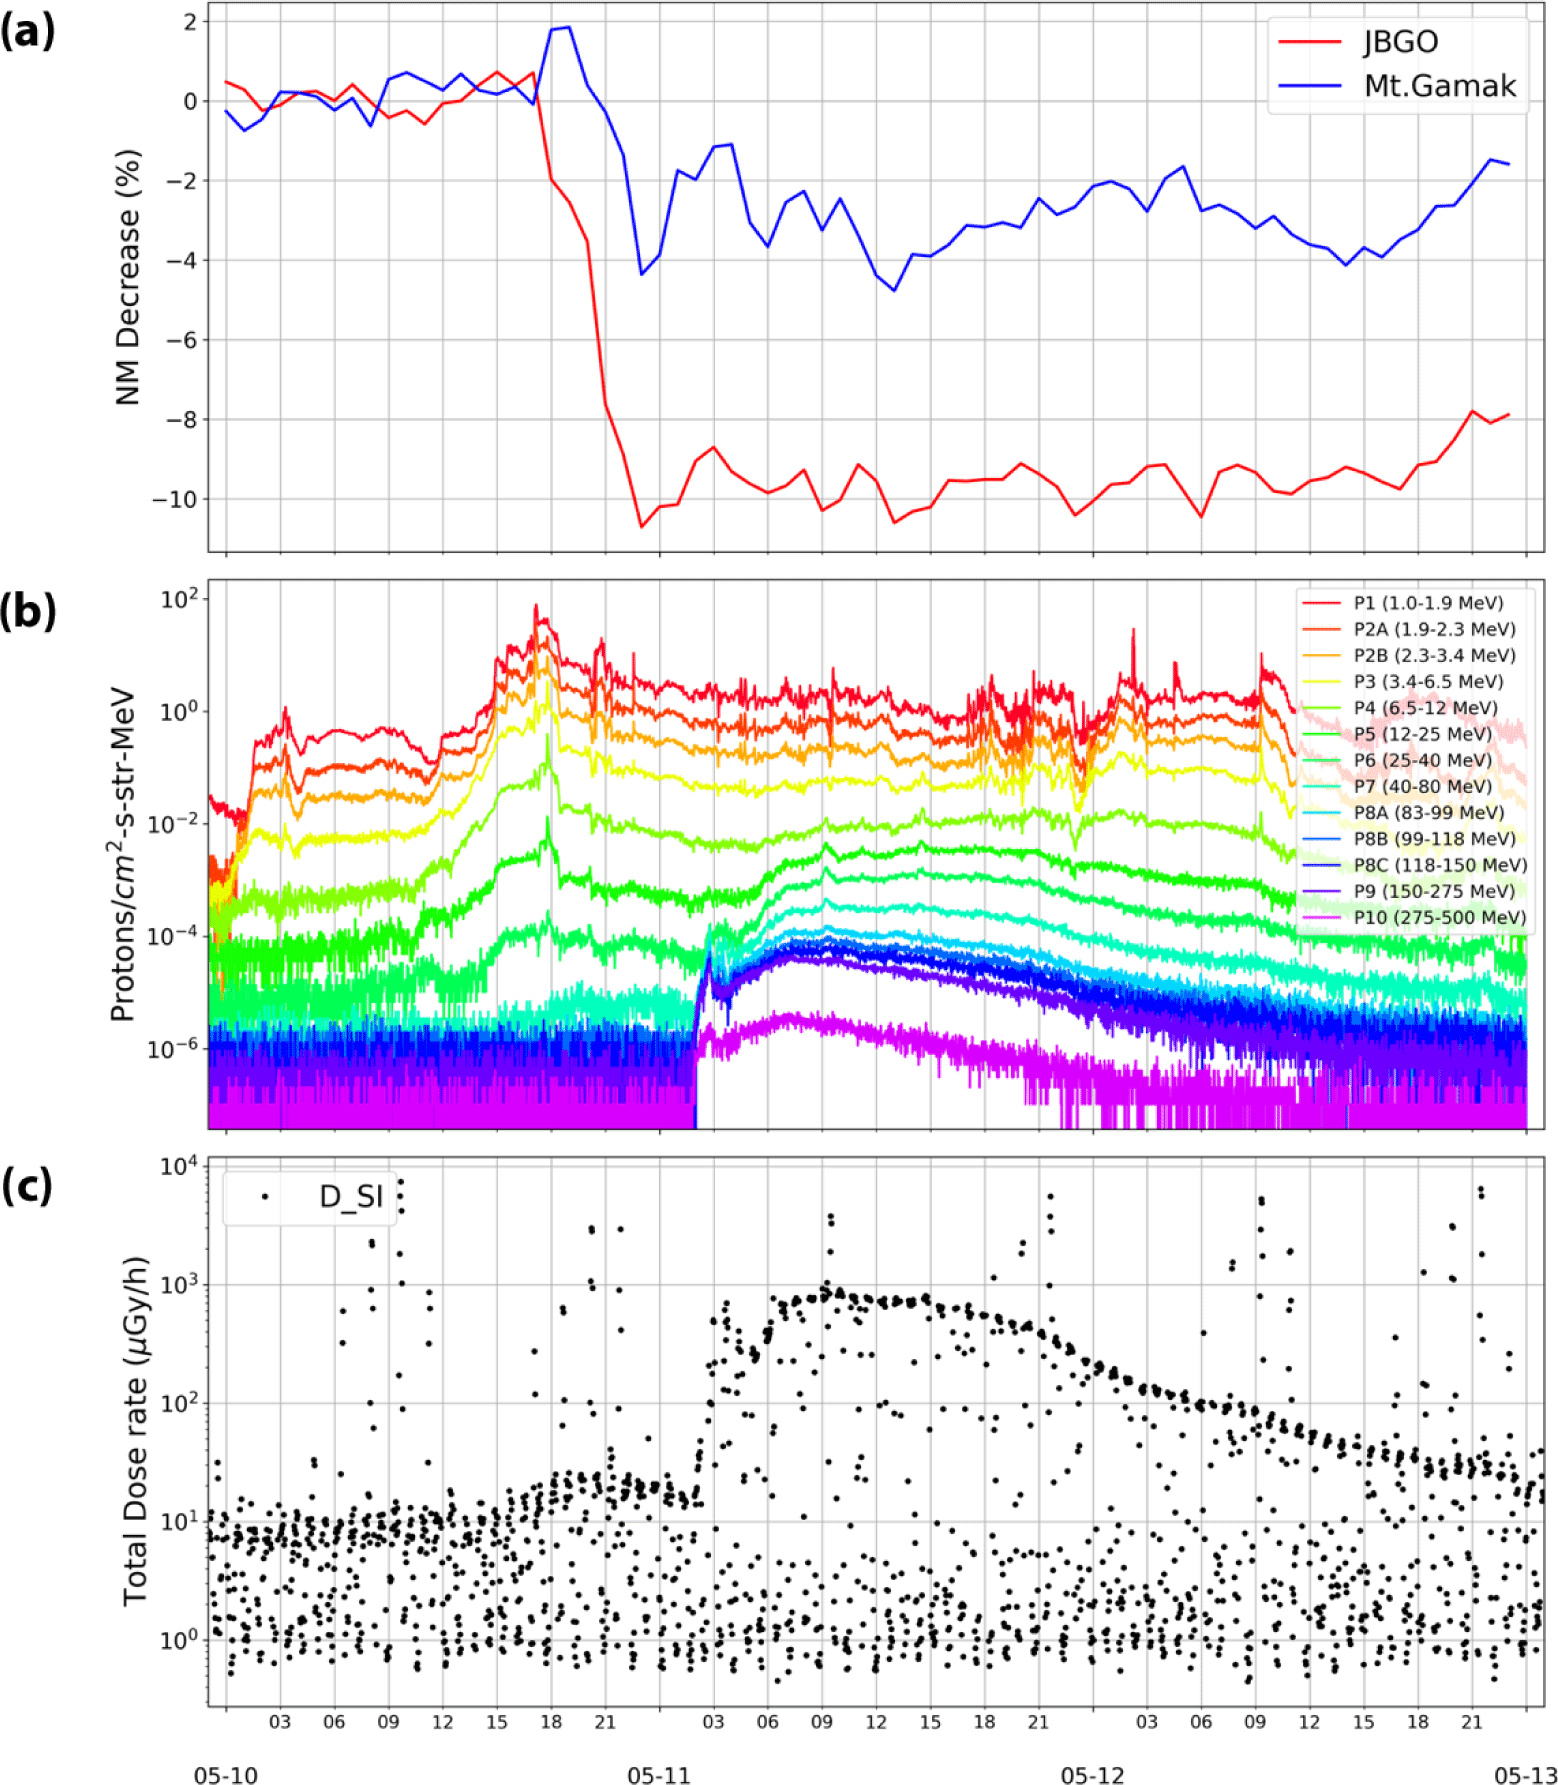
LEO-DOS data also confirmed the events that occurred on May 11. The silicon detector of the LEO-DOS detects protons with energies above approximately 40 MeV. The LEO-DOS data showed an increase in the total dose rate measured by the silicon detector (D_si) during the G5 storm event. This increase can be clearly observed when compared with the GOES proton flux in Fig. 17. The total dose rate gradually increased from 15:00 UT on May 10 and then rapidly increased from 02:00 UT on May 11. This is related to the increase in protons with energies above 40 MeV. Meanwhile, the periodic peaks with values exceeding 103 µGy/h in the LEO-DOS data represent the total dose rate measured as the satellite passes through the radiation belts.
6. SUMMARY
This study presents an observational overview of the G5-level geomagnetic storm that occurred in May 2024, the most intense event since the 2003 Halloween storm. Our study tracks the event from its solar origins to its impacts on Earth’s magnetosphere and upper atmosphere. The intense geomagnetic storm was triggered by a series of CMEs originating from solar active regions 13664 and 13668. As these two active regions merged together, they formed a large complex sunspot cluster, which became highly flare-productive and generated 11 X-class flares from May 8 to 14, 2024. These powerful X-class flares resulted in multiple fast and Earth-directed CMEs. The solar and interplanetary origins of the storm are traced to examine the interactions between the multiple CMEs as they approach Earth. The Wang-Sheeley-Arge–ENLIL+Cone model indicated that a fast CME, associated with an X2.2 flare on May 9, caught up with slower CMEs, also associated with X-class flares, and arrived at 1 AU simultaneously at the time of the storm, leading to an intense storm. This indicates that CME-CME interactions played a crucial role in enhancing the storm’s severity.
Observational data from geostationary satellites such as NOAA’s GOES and KMA’s GK2A, revealed changes in Earth’s magnetosphere due to solar wind impacts, increased fluxes of high-energy particles, and periodic magnetic field fluctuations accompanied by particle injections. Extreme geomagnetic storms resulting from the interaction of the solar wind with the Earth’s magnetosphere caused strong auroral activities, particularly in the polar regions, and led to changes in the thermosphere and ionosphere, with energy influxes into high-latitude regions. Our study highlighted the role of magnetosphere-ionosphere coupling, where energy from the solar wind was transferred into the Earth’s upper atmosphere over the polar regions, leading to thermospheric heating and changes in the global atmospheric composition and ionosphere.
During the storm, we observed significant disturbances in the upper atmosphere on both global and local scales, with a particular focus on the Far East Asian sector, using data from space and ground-based observations. Ionospheric plasma density decreases at high and mid-latitudes are linked to changes in neutral composition (O/N2), However, the mechanisms behind the sudden increase in plasma density at night and the related strong scintillations require further investigation. Global responses of storm-time PPEFs were also observed in magnetometer data across various latitudes over the Far East Asian longitudinal sector.
This study also used data from the KASI’s observational systems, such as ASCs and neutron monitors, to capture the storm’s impact on auroras and cosmic ray flux. The KASI all-sky camera captured auroras in Korea for the first time in 21 years since the Halloween Storm in 2003. During this May G5 storm, auroral emissions at both red and green wavelengths were observed over the Jang Bogo Station in Antarctica, while only the red line was observed over the Korean Peninsula. The neutron monitors operating at the Jang Bogo Station in Antarctica and the Korean Peninsula certainly observed decreasing fluxes related to the G5 storm event. The LEO-DOS onboard the NEXTSat-2 also observed an increase in the total dose rate related to the G5 storm event.
This study underscores the need for improved space weather forecasting models and response strategies to mitigate the adverse effects of such extreme geomagnetic storms on modern technological systems. The overviewing analysis of this G5-level storm provides critical insights into the Sun-Earth interaction during extreme space weather events, which may help establish better preparedness and resilience against future space weather challenges.


