1. INTRODUCTION
Transformational leaps forward in scientific discovery are often associated with advances in technology and instrumentation. This holds particularly true when it comes to the application of all-sky imagers to the mesoscale mapping of spatial brightness distributions of aurora and airglow. Previous imaging research efforts, as summarized in the reviews of Eather (1967, 1975, 1988), Bosqued (1985), Baumgardner et al. (1993, 2007), Galand (2001), Galand & Chakrabarti (2006), Frey (2007), Martinis et al. (2018), and others, demonstrate that imaging has been extremely useful as a tool for ground-based remote sensing of the geospace environment. The first imagers fielded in the 1960s and earlier were film-based. Eventually, these were replaced by imagers using image intensifier tubes (later versions incorporating GaAs photocathodes on microchannel plates) and then Si (silicon) detectors, such as the charge-coupled device (CCD). The increased sensitivity led to higher cadence while achieving excellent imaging of weak spectral emissions, such as the Hß emission. Thus, impactful auroral and airglow studies observing a wide range of atomic and molecular emissions within the visible to near-infrared range of 400–900 nm emerged.
The recent development of larger-area, deep-cooled InGaAs (indium gallium arsenide) focal-plane arrays presents a unique opportunity to expand geospace imaging science into the previously under-explored short-wave infrared (SWIR) spectral range of 900–1,700 nm. Keo Scientific Ltd. has recently developed and commercialized a state-of-the-art, compact SWIR imager, the Keo Sentry-SWIR, with the aim of engendering new aeronomy and auroral physics studies by exploration of the imaging of auroral and airglow emissions within the SWIR wavelength range. The instrument is described in more detail in Section 2.
The instrument has already been successfully deployed and utilized in the more specific application developed by Pautet et al. (2014). This is a technique designed to study mesosphere dynamics by measuring precise high-cadence maps of OH rotational temperatures and intensities using two selected OH emissions from the 3-1 OH P branch in the SWIR region near 1,500 nm. This wavelength range benefits from a lack of auroral contamination in the spectral regions sampled for polar observations, as well as by the much stronger OH intensities accessible in the SWIR region as compared with the OH emissions within the visible region of the spectrum commonly used in the past to observe OH rotational temperature (Meriwether 1975; Taylor et al. 2001). This paper briefly discusses the application of the Keo Sentry-SWIR to this technique while also proposing several other applications that warrant further investigation, viz.:
-
Studying the spatial morphology of the high latitude and cusp energetic particle deposition distributions with respect to helium (He) aurora, proton auroras, and electron auroras for quiet and active geomagnetic periods.
-
Searching for possible sub-auroral manifestations of energetic He, hydrogen (H), and electron phenomena associated with features known as “spot” aurora, detached sub-auroral forms, STEVE, SAR arcs, and proton flashes (e.g., Frey 2007; Gallardo-Lacourt et al. 2021).
-
Identifying the auroral morphology relating to Alfvénic auroras, i.e., auroras that have been created by electron acceleration through fast-moving Alfvén waves generated within the magnetosphere by geomagnetic field line oscillations. This approach would be based upon measurements of the N2+ Meinel rotational temperature obtained by measuring the “head” and “tail” brightnesses of the 0-0 Meinel band with origin at 1,105.0 nm. Comparing this temperature with the Mass-Spectrometer-Incoherent-Scatter (MSIS) model temperature profile would allow the determination of the altitude of the source auroral emission, and thus inferring the characteristic energy of electron precipitation creating the auroral emission, as pioneered by Hunten et al. (1963).
-
Determining the typical behavior of the He nightglow with respect to seasonal, nocturnal, and short-term 1,083 nm intensity variations. This would represent a new, novel approach to the study of He density variability and its sensitivity to changes in the total atmospheric density and global circulation dynamics across an extensive latitude range of ~12°.
Many other applications can be envisioned, but these ideas illustrate the possible scope of the applications that imaging the SWIR spectral emissions might provide.
In summary, the extension of geospace imaging science into the SWIR region of the electromagnetic spectrum has the potential to broaden the range of space weather explorations, with a promise of facilitating additional advancements in our understanding of the geospace environment as observed from the ground. Also, SWIR imaging might well enable improved diagnostic measurements in support of currently existing instrumentation and facilities (Beedle et al. 2022).
2. INSTRUMENTATION
The Keo Sentry-SWIR imager, with a cross-section diagram, is pictured in Fig. 1. The design of the imager is based on Keo Scientific’s traditional CCD all-sky imager, successfully employed for visible-range imaging by research groups world-wide since the early 1990s.
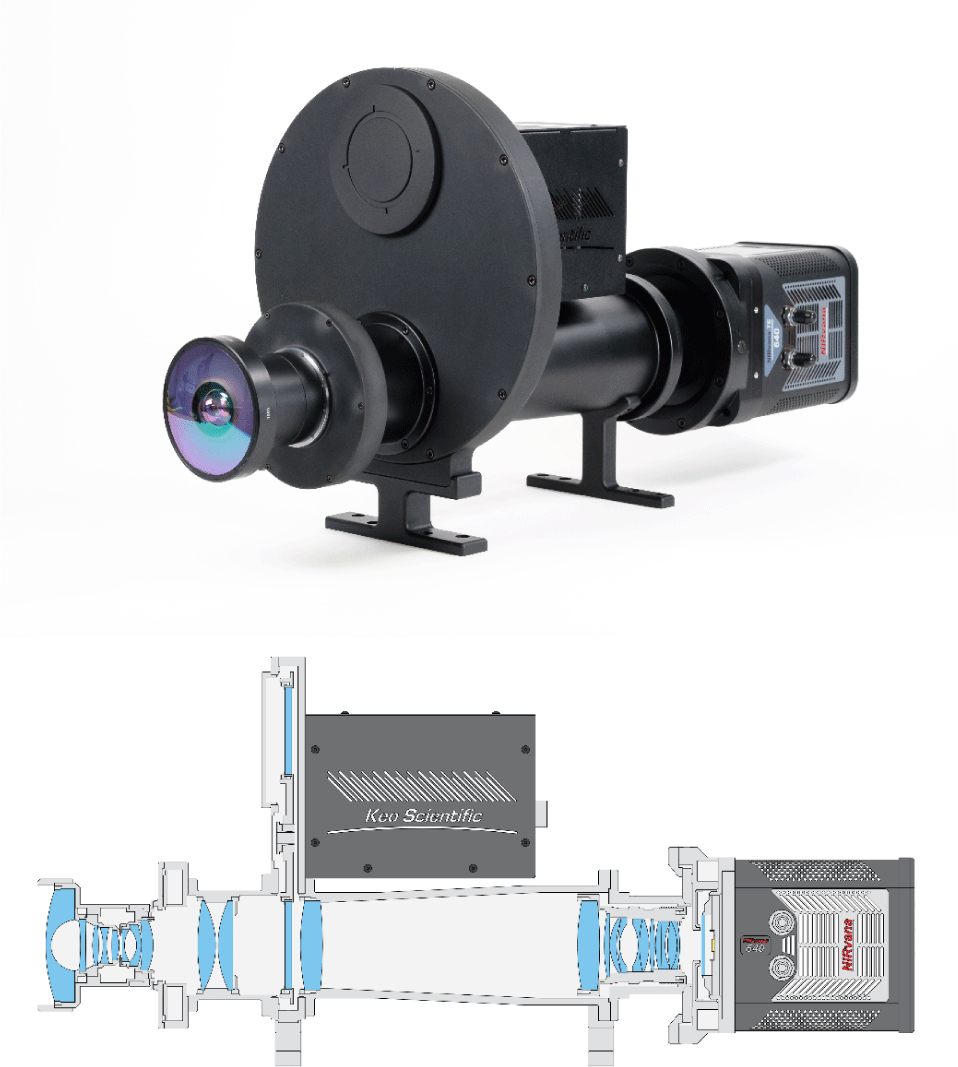
As there are no commercially available SWIR fisheye lenses with the characteristics required for the detection of low-light-level airglow and aurora emissions, the imager’s fisheye lens was custom-designed and manufactured by Keo Scientific specifically for this instrument (Trondsen et al. 2021). This primary lens is a 30 mm focal length, f/3.5 fisheye (180°) optimized and anti-reflection (AR) coated for the wavelength range of 1,000–1,700 nm.
The circular field of view (FoV) of the instrument is set to 120° at the primary image plane by means of a Lyot stop. The reason for limiting the field of view to 120° in this application is that, for a given sensor size and pixel pitch, there is always a tradeoff between spatial coverage and spatial resolution. This is particularly true for InGaAs sensors, which remain relatively small and have a limited number of pixels compared to CCD sensors. Data from the Advanced infrared Mesospheric Temperature Mapper (AMTM) of Pautet et al. (2014) have already shown 120° to be an acceptable compromise given the spatial scales of phenomena of interest, such a mesospheric gravity waves (GWs) and ripples. Additionally, the aperture of the primary lens is stopped down to f/5, which achieves the intended f/1 imaging at the sensor through preservation of the Lagrange Invariant (etendue).
The Lyot stop, in conjunction with specially applied internal paints, also plays a critical role in minimizing scattered light within the imager. The fisheye lens is followed by a capping shutter, closed during daytime to protect filters and sensor from direct exposure to the sun.
The optical design is image-space telecentric, ensuring that the principal ray of all image-forming cones across the field of view intersects the image plane parallel to the optical axis (Baumgardner et al. 1993). This characteristic allows for the utilization of interference filters as narrow as 1.0 nm FWHM, with the maximum ray angle through the filter depending only on the f-number of the fisheye lens. The cone angle of the AMTM of Pautet et al. (2014), is approximately f/11 whereas the cone angle of the Keo Sentry-SWIR is f/5, resulting in a significantly more compact instrument size. Interference filters are essentially etalons and ray-angles and thermal environment must therefore be carefully controlled. The filter wheel is thermally stabilized to ± 0.1℃ and accepts up to eight 3-inch diameter filters. In SWIR imaging systems, signal contribution from thermal photons emitted by internal imager components (such as the shutter that is closed during dark-frame acquisition) cannot be ignored. To address this, Keo Scientific devised a custom filter with zero transmission, yet possessing the same effective emissivity as the filters used during sky imaging. This filter is rotated into the optical path during the acquisition of images later used for dark-frame subtraction.
Next, the large primary image at the filter plane is reimaged at a fast speed of f/1.0 onto a state-of-the-art, 640 × 512 pixels (12.8 mm × 10.24 mm, 20 µm pixel pitch) InGaAs focal-plane array. InGaAs sensors, which have a hybrid structure consisting of back-illuminated InGaAs photodiodes and a complementary metal-oxide semiconductor (CMOS) readout circuit, are noisy compared to CCDs, but have an acceptable dark current performance when deep-cooled. The Keo Sentry-SWIR leverages a Teledyne Princeton Instruments NIRvana 640, which is thermoelectrically cooled to –80℃.
An absolute calibration of the imager is performed by Keo Scientific personnel to establish a relationship between arbitrary, instrument-dependent raw pixel values (counts) and photon flux (apparent emission rate) in physical units of rayleighs (R). Absolute calibration of the imager is a multi-stage process: First, filter bandpass curves are established by using a tunable SWIR laser. Then, on-axis broadband sensitivity is established for each filter by imaging the output of a calibrated, NIST-traceable integrating sphere through the imager, including the filter, and onto the InGaAs sensor. Additionally, an on-axis ‘at-wavelength’ sensitivity is measured for each filter using a collimated laser beam calibrated with a NIST-traceable optical power meter through the imager, including the filter, and onto the InGaAs array. This all results in the final Absolute Calibration Coefficients, valid on-axis. Finally, a flat-field correction procedure is performed to compensate for off-axis vignetting, resulting in Uniformity Coefficients, one for each filter, allowing one to apply on-axis Absolute Calibration Coefficients to any pixel in the image.
3. CANDIDATE SWIR EMISSIONS FOR AURORA/AIRGLOW STUDIES
The successful application of any SWIR imager to specific problems hinges on a thorough understanding of the wavelengths and anticipated brightness levels of potential emissions. Saum & Benesch (1970a, b) published SWIR laboratory spectra for N and O and molecular band systems of N2+ (Meinel) and N2 1PG. Examples of SWIR auroral spectra were obtained by Vallance Jones & Gattinger (1976) and Gattinger & Vallance Jones (1981). High-resolution SWIR spectra were published by Baker et al. (1977) and by Baker et al. (1985), providing wavelengths of auroral emissions and their surface brightness. Also useful are the SWIR astronomical high-resolution nightglow spectra published by Rousselot et al. (2000). Baker et al. (1977) investigated the potential impact of water vapor absorption and concluded that it posed no significant concerns for the SWIR region.
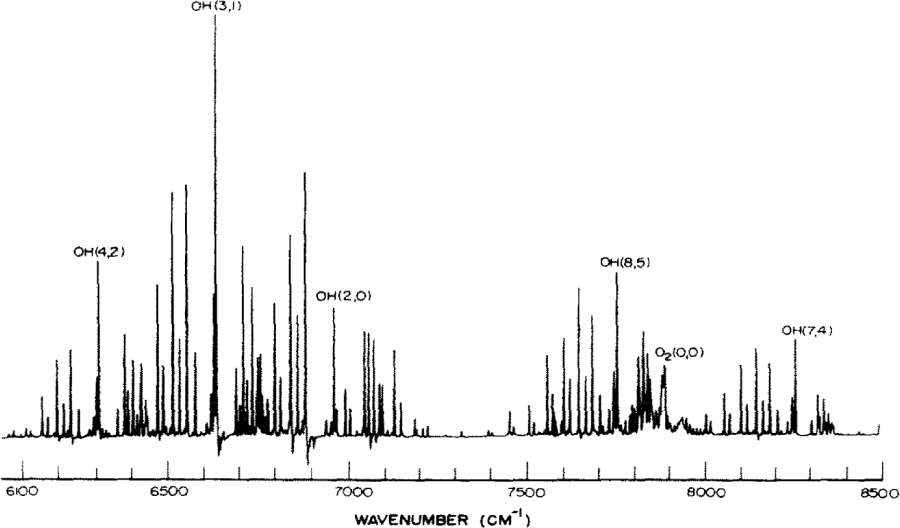
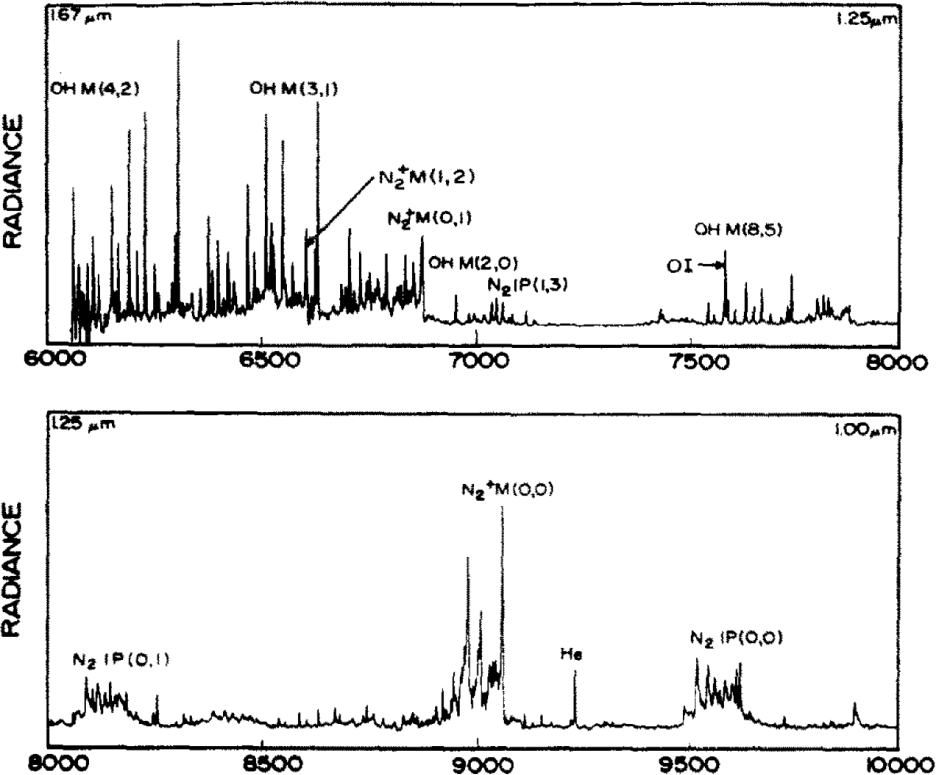
Figs. 2 and 3 exhibit auroral and airglow spectra seen in the SWIR region for the spectral range of 880–1,650 nm (Baker et al. 1985). These spectra exhibit a variety of interesting atomic and molecular emissions. Table 1 presents some selected auroral and airglow emissions that may be of particular interest in SWIR imaging applications. The two Paschen H lines have not yet been identified in auroral or nightglow spectra. However, existing SWIR auroral spectra have all been collected in bright IBC III electron aurora, a scenario where the likelihood of detecting these hydrogen emissions would be low. Special attention is required when measuring the metastable He 1,083 nm multiplet, and this is the topic of the next section.
| Emission ID | Species | Wavelength [nm]-air | Contamination | Notes |
|---|---|---|---|---|
| He (3S 3P-3S) | He | 1,083.0 | 3 lines multiplet, contamination from four OH Q branch components | Charge exchange of He++, He+; excitation by photo-electrons and energetic electrons; Shefov et al. (2009) indicated typical aurora He brightness of ~10 kR |
| Pβ (3-5) | H | 1,281.81 | Not seen in Vallance Jones & Gattinger (1976) or Baker et al. (1985) auroral spectra, but likely in proton aurora | Charge exchange of H+; typical brightness unknown |
| Pγ (3-6) | H | 1,093.82 | Not seen in any published spectra | Charge exchange of H+ |
| NI 7 | N | 939.3 | Contamination from N2+ Meinel (2-1) | Permitted 3s2P-3p2 D0 No nightglow seen; auroral brightness ~200 R |
| NI 18 | N | 1,011.5 | No auroral contamination | Permitted 3p4 D0-3d4F; 5.0 kR in Vallance Jones & Gattinger (1976) |
| NI 3F | N | 1,038.55 | Slight contamination from N2 1P (5,6) but otherwise clear of OH or auroral molecular bands | Forbidden (N2D-N2P); No nightglow seen; auroral 20 kR in Vallance Jones & Gattinger (1976) |
| O2 IR A-band | O | 1,268.7 | - | ~94 km altitude |
| NI | N | 1,342.96 | Clear of OH or auroral molecular bands | 1 kR in Baker et al. (1977); 0.5 kR, Gattinger & Vallance Jones (1981) |
| OI | O | 1,316.486 | No auroral molecular contamination | Permitted 3p 3P-4s 3S0; 2.3 kR in Baker et al. (1977) |
| N2+ meinel 0-0 | N2 | 1,103.65 band origin | No OH contamination | Auroral activity; 212 kR in Baker et al. (1985) |
| N2 1 positive 0-0 | N2 | 1,051.00 band origin | No OH contamination | Auroral activity; 77.1 kR in Baker et al. (1985) |
| OH 3-1 band P1 (2) | OH | 1,523.68 | Little auroral contamination | Rotational temperature and intensity maps; 5–10 kR brightness |
| OH 3-1 band P1 (4) | OH | 1,542.79 | Rotational temperature and intensity maps; 5–10 kR brightness |
Typical auroral brightness are indicated relative to an IBC III aurora. The terms VJ & G and G & VJ refer to Vallance Jones & Gattinger (1976) and Gattinger & Vallance Jones (1981), respectively. These are all Air wavelengths. The phrase “Band Origin” does not denote a specific wavelength feature within a molecular band; rather, it denotes a numerical value representing the extrapolation to the minimum of the potential well.
The accurate measurement of the He 1,083 nm multiplet intensity is challenging. Fig. 4 illustrates the spectral structure of the three He 1,083 nm multiplet lines and the four Q branch OH emissions from the 5–2 band that are all located within a narrow range of 0.2 nm near 1,083 nm (Shefov et al. 2009). This example shows the He multiplet intensity as being comparable to the OH Q branch intensities (~1 kR). However, Shefov & Semenov (2011) cited several references indicating that a more typical brightness for the metastable He 1,083 nm multiplet aurora is ~10 kR.
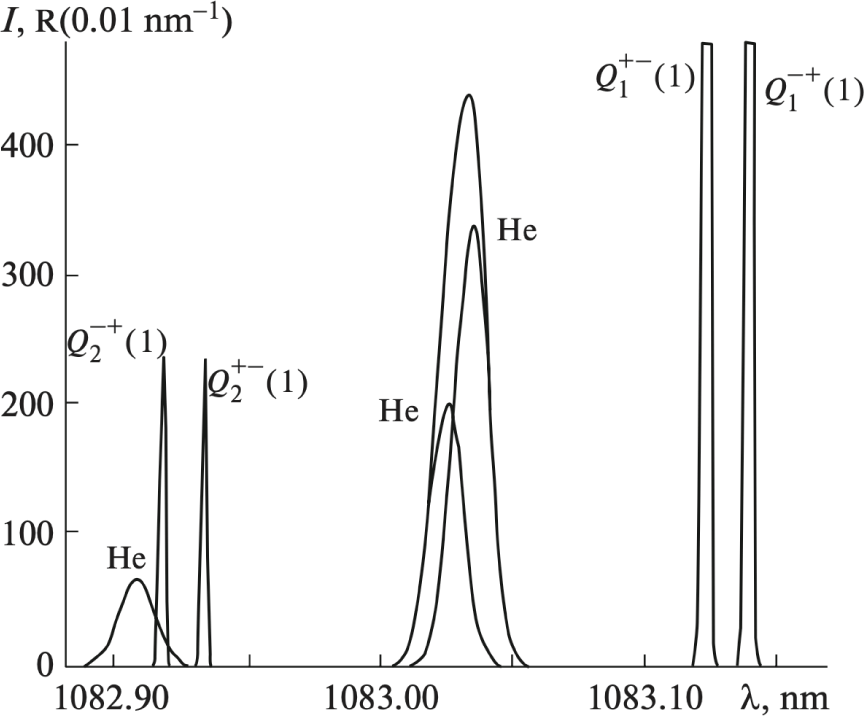
To effectively isolate the spectral features situated within this narrow (0.2 nm) region, high resolution spectrographic or interferometric techniques are usually required. This is because all these features manifest simultaneously within the ~1.0 nm minimum practically feasible filter bandwidth of a telecentric imager so that the intensities for the He 1,083 nm emission and the two Q1 and Q2 OH emissions are not separated but blended together. However, we suggest that estimating the metastable He 1,083 nm multiplet intensity by means of an imager is possible by using a novel analysis procedure that is based upon using the intensity data for the P1(3) images (1,097.5 nm) to compute Q1 and Q2 images at 1,083 nm that can be used to correct the observed He 1,083 image.
One approach to achieving this is to compute the Q branch OH intensity contributions to the composite (helium plus the Q1 and Q2 Q-components) 1,083 nm image through the application of a rotational temperature. Knowledge of the OH 5-2 band profile from a synthetic spectra model combined with precise measurements of the rotational temperature or using a value taken from the MSIS-00 model would enable the Q1 and Q2 branch brightnesses to be estimated based on the observed P1(3) brightness. This approach is based upon the application of a P/Q branching ratio to yield the Q1 and Q2 images that can both be applied to the composite 1,083 nm image for the purpose of removing the OH contamination, leaving only the He contribution.
First, the data for both He 1,083 and the OH 1,097.5 filters would be treated to subtract the continuum background measured at 1,080 nm. In this step, we account for the subtle variations in the transmission profiles of the three filters, which are practically identical with peak transmissions of ~92%–93% (private communication, Alluxa, Inc.). These two treated images are then subtracted from the He 1,083 images after application of the P/Q branching ratios to determine the Q1 and Q2 images. A value for the 5–2 rotational temperature taken from the MSIS 00 model for a height of 87 km height (taken to be the peak height of the OH airglow profile) is used to determine the P/Q branching ratio for both Q1 and Q2 branch emissions. For a temperature of 180 K the P1(3)/Q1 and the P1(3)/Q2 ratios are ~0.7 and ~7.1, respectively. A synthetic spectra analysis (carried out by Dr. Charles Mutiso) shows that these two ratios are not sensitive to a change in the OH rotational temperature, with only a 2% increase and 8.9 % decrease seen for a 50 K shift in the temperature from 180 K to 230 K, respectively. The selection of this P1(3) OH emission line was based on the absence of any auroral contamination from molecular or atomic emissions.
An alternative approach relies on observing the combined 1,083 nm emissions near or past midnight when the He nightglow caused by resonance scattering is known to be weak (< 50 R). This ensures that the observed 1,083 nm signal (~1 kR) is dominated by the Q branch OH emissions. Simultaneous intensity measurement of the OH P1(3) and the composite 1,083 nm emissions will then enable the calculation of the desired ratios that can be used to correct and analyze He images collected earlier in the night.
These analysis approaches, which to our knowledge has not been previously described in imaging science literature, would need to be modeled and tested with pseudo-data to determine the range of error for both methods. The first approach featuring the use of an OH filter is preferred as it relies on data to determine the separation of the He and OH emissions. The other approach is less preferable as it assumes that the He nightglow is non-existent at high solar zenith angles. Auroral spectra for this region found in Baker et al. (1977) and in Vallance Jones & Gattinger (1976) show that there is no significant auroral contamination from nitrogen band emissions.
To help evaluate the sensitivity of a SWIR imager like the Keo Sentry-SWIR to the emissions of Table 1, a forward model was developed to calculate the expected SWIR imager response. The quantum efficiency (QE) of an InGaAs sensor is nearly constant within the range of 80% to 85% across the spectral interval of 900–1,600 nm. The calculation of the signal-to-noise ratio (SNR), for each pixel is (Baumgardner et al. 2007):
where IS is the incoming radiance (photons/μm2/s), Ib is the background irradiance (photons/μm2/s), texp is the exposure time (seconds), dpixel is the pixel size (μm), σd is the dark current (electrons/pixel/s) and σr is the read noise (electrons/s/pixel). NIRvana dark current is specified by Teledyne Princeton Instruments as being 150 electrons/pixel/s when the sensor is cooled to –80℃ and staring at a cold target held at –174℃. In the current use-case of looking at the sky through an observing dome, the actual dark current is found to be closer to 500 electrons/pixel/s. The readout noise is specified as 120 electrons/pixel. The spectral background signal is assumed to be 10 R/nm. The results are plotted in Fig. 5. The SNR determined for each emission of Table 1 was found to be greater than 20 for an exposure of 300 s, assuming a 100 R source brightness.
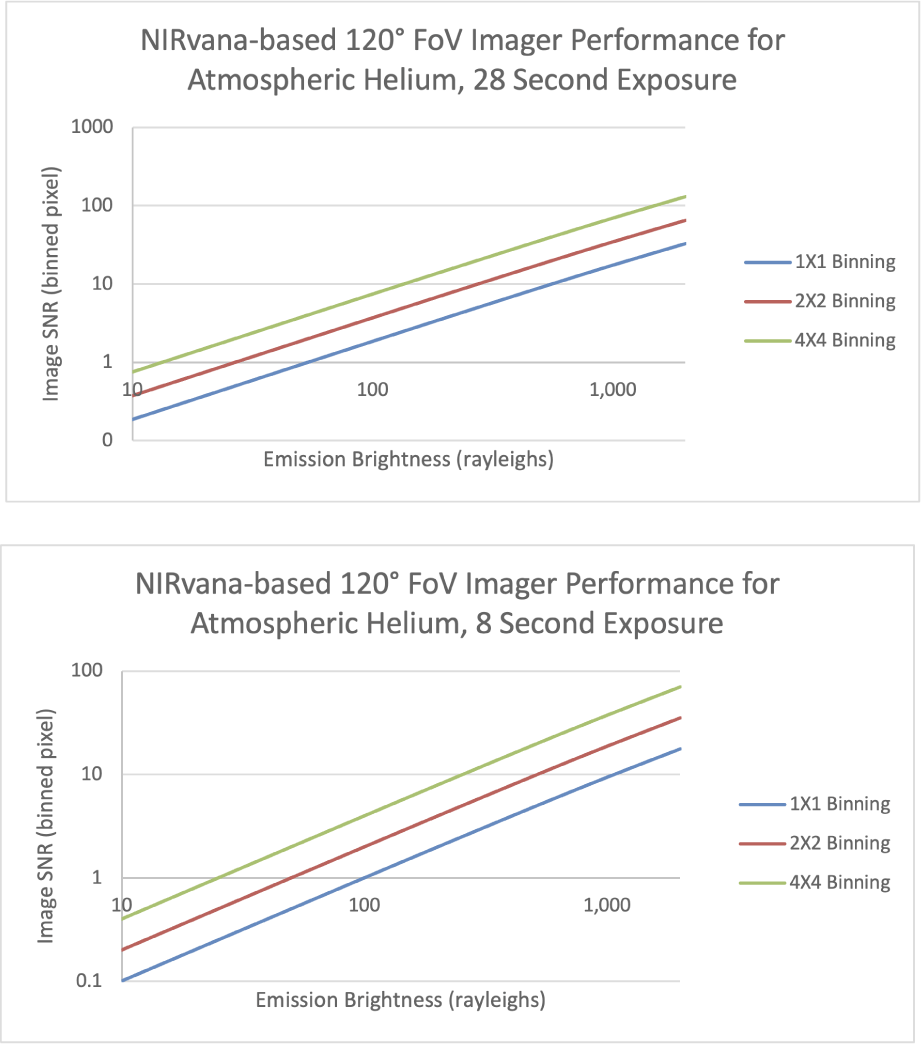
This model calculation demonstrates the feasibility of obtaining images of the spatial distribution of He, H, N, O, and N2+ atomic and molecular emissions seen in aurora and the He nightglow across a spatial extent of ~415 km for electron aurora at 120 km height, ~775 km for He aurora and proton aurora at ~225 km, and ~1,750 km for He nightglow at ~500 km. For He this corresponds to a latitudinal extent of ~12°, with a longitudinal extent of ~15° at 40° mid-latitude and ~27° at 65° high latitude. For nightglow observations of the OH layer at 87 km, this span would be ~300 km. In this spectral region, it is likely that imagery can be collected without significant contamination from OH in the case of auroral emissions, and without significant contamination from auroral emissions in the case of OH nightglow.
4. POTENTIAL SWIR IMAGER SCIENCE APPLICATIONS: AURORAL STUDIES
The following sections discuss the potential application of the Keo Sentry-SWIR – or any SWIR imager with comparable performance characteristics – to three distinct potential auroral research topics.
Section 4.1 deals with the topic of comparing the spatial morphology of helium, proton and electron auroras. The ability to study the spatial overlaps of these types of auroras promises to have implications regarding the evaluation of space weather effects in the thermosphere and exosphere. Section 4.2 suggests a method of searching for possible sub-auroral auroral forms such as STEVE, SAR-arcs and proton flashes (see reviews by Frey 2007; Gallardo-Lacourt et al. 2021). Finally, in Section 4.3, a method for searching for evidence of Alfvénic auroral activity is proposed. These examples are meant to illustrate the broad range of new science studies that are made possible through the recent availability of deep-cooled SWIR imaging technology.
With reference to Table 1, the following list can be regarded as a proposed preliminary assortment of eight filters specifically targeted at studying SWIR auroras:
-
Three filters to measure the He multiplet auroral emission at 1,083 nm, as described in Section 3.2.
-
One filter to chase the proton auroral emission at the 1,281.8 nm Paschen β line.
-
Two filters to measure the electron auroral emissions at the 0–0 “head” and “tail” of the N2+ Meinel system. See Section 4.3.
-
One filter to measure the permitted transition emission of O at 1,316.5 nm, excited by energetic electron impact.
-
One ‘background continuum’ filter centered on a region devoid of airglow/aurora emissions.
This proposed filter set, fully populating an 8-position filter wheel, provides the capability to observe images associated with three distinct types of auroras: (a) the electron aurora (the O permitted transition, and the two N2+ Meinel band emissions), (b) the proton aurora (the Paschen β emission), and (c) the helium aurora with the He auroral multiplet emission at 1,083 nm. The total time required to acquire these images is estimated to be between 5 to 10 minutes. As the Paschen β emission has never been detected before, nothing is known about its expected brightness, and thus required exposure times.
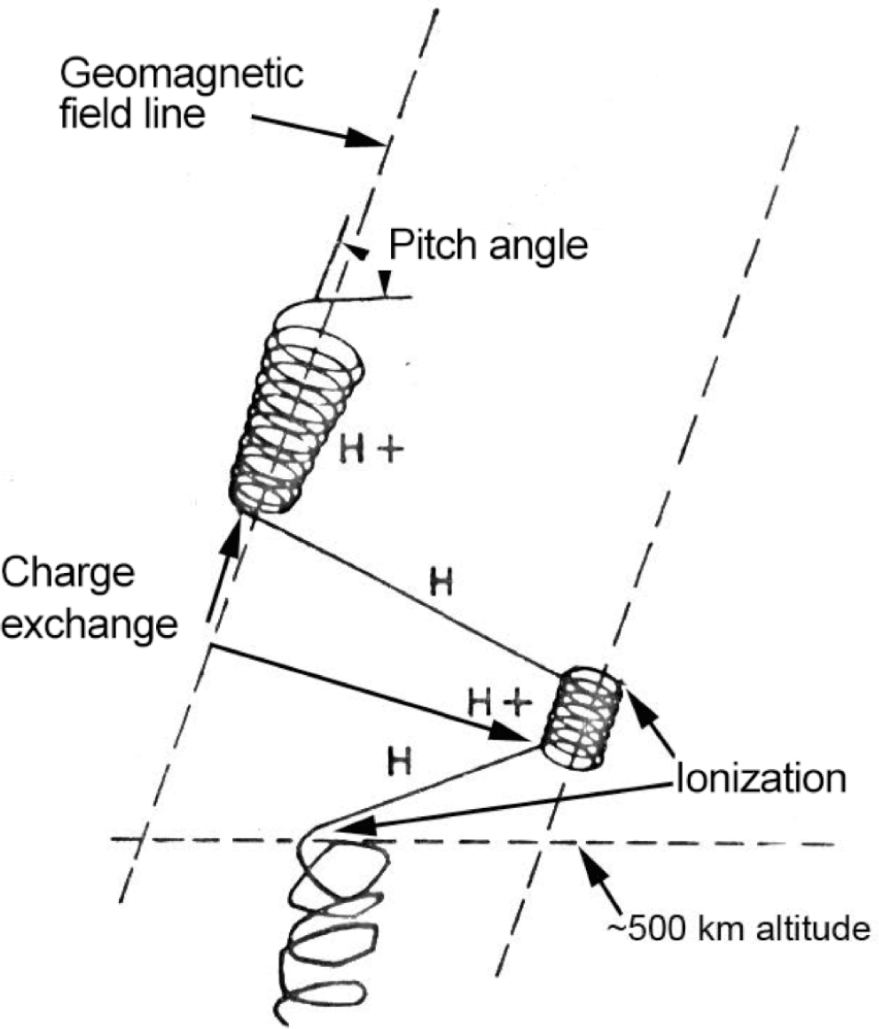
Overlapping beams of incoming electrons and ions (He++, He+, H+) into the upper atmosphere above the charge exchange region, see Fig. 6, can be expected to have different spatial footprint distributions. Unlike electrons, the incident proton beam is affected by lateral spreading due to the production of energetic neutral H atoms (Lorentzen & Moen 2000; Fang et al. 2005) within the region of charge exchange (~300–400 km). Lateral spreading should also apply to incoming streams of He++ and He+, but to a lesser extent due to the greater mass of He relative to H. Also implied is that, given the same energy, He atoms would move more slowly than H. We note that ionization and stripping collisions caused by energetic He or H atoms impacting atmospheric neutral species would lead to emissions that are also caused by incoming electrons. The review papers by Reasoner (1973) and Prange (1978) both discuss the issue of the origin of energetic ions such as He+ and He++ entering into the ionosphere. Reasoner found in a rocket ion mass spectrometer experiment that the observed He++/H+ ratio was indeed similar to that observed in the solar wind. Prange’s review suggested that the underlying physics as to how the He++ and He+ particles are transferred from the solar wind to the ionosphere are quite complex. Clearly, this area of auroral physics deserves much more attention and extensive study. An imager observing at 1,083 nm offers an opportunity for ground-based studies to determine the spatial footprint of the energetic He++/He+/He particle precipitation that is likely linked to the magnetotail origin where these particles are transferred from the solar wind into the ionosphere after acceleration by the local auroral acceleration region.
An ability to distinguish between the electron and proton components of auroral precipitation is essential to achieving a correct interpretation of auroral brightness in terms of ionospheric parameters such as ionization rate and conductivity (Galand et al. 2002; Galand & Lummerzheim 2004; Galand et al. 2004; Lanchester et al. 2011). Observations have shown that energetic electrons and protons do not interact with the upper atmosphere in the same way. Data from satellite-borne sensors show the existence of regions in the magnetosphere, conjugate to nightside proton aurorae, where a favorable environment for breaking the first adiabatic invariant allows keV protons to precipitate through the continual refilling of atmospheric loss cones. Moreover, space-borne imagers also show the appearance of dayside hydrogen emissions in response to changes in either the solar wind’s dynamic pressure or the interplanetary magnetic field’s north–south component. It is thus necessary to carefully separate the electron and proton components of auroral particle precipitation to be able to correctly assess important space weather related ionospheric parameters such as conductivities, Joule heating, and changes in composition.
Fig. 7 illustrates an example of evening and morning latitudinal regions identified with proton precipitation relative to the nighttime electron auroral oval. In addition, as protons retain the large-scale structure more efficiently than electrons, imaging the proton aurora is an excellent probe for investigating magnetospheric sub-storms and magnetosphere-ionosphere coupling processes (e.g., Deehr & Lummerzheim 2001; Immel et al. 2002; Mende et al. 2003; Zhang et al. 2005; Lanchester et al. 2011). Moreover, protons can be the dominant energy source in the cusp and at the equatorward boundary of the dusk-side auroral oval (Creutzberg et al. 1988; Hardy et al. 1989; Galand et al. 2001). A recent review by Gallardo-Lacourt et al. (2021) presents an extended discussion regarding the magnetospheric physics underlying the separation of the electron and proton aurora morphology.
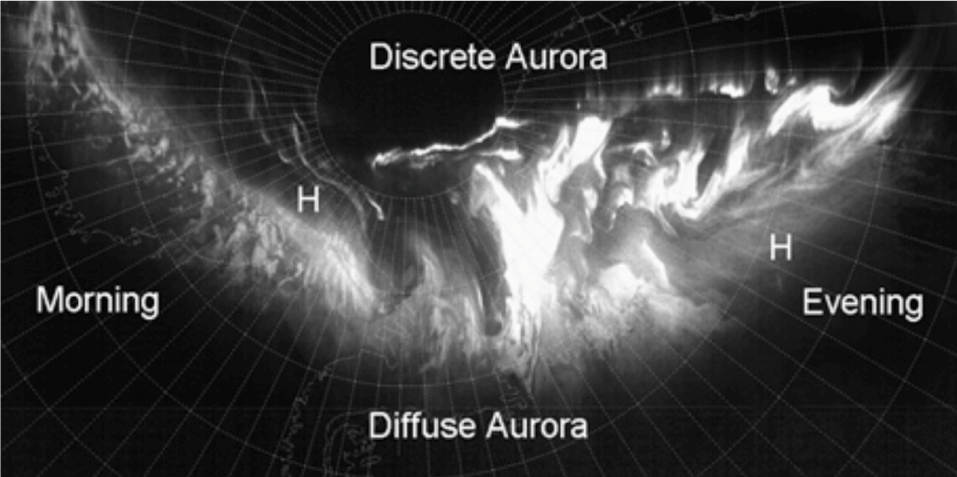
The conventional wisdom, as illustrated in Fig. 7, was that the proton aurora is located equatorward of electron aurora in the dusk-side of the auroral oval and poleward of electron aurora on the dawn-side. This view is incomplete, however, as shown by Zou et al. (2012), who found that the relative position of the electron and proton auroral boundaries depends significantly on the level of geomagnetic activity. The electron and proton boundaries were established by observing the 630 nm and Hß emissions using meridian-scanning photometers. Their results showed that during moderate and active periods, the electron aurora tended to lie equatorward of the proton aurora throughout the nightside region (20–03 MLT).
The interpretation of these findings provided by Zou et al. (2012) was that there is a dawn-dusk offset in the location of the auroral oval, with the proton aurora shifting toward pre-midnight and the electron aurora toward post-midnight. The penetration of the electron boundary equatorward of the proton precipitation across this magnetic local time (MLT) range had not been previously recognized. On the nightside, the proton aurora forms a band of diffuse aurora near the equatorward boundary of the electron auroral oval. This proton aurora is generally understood to be the projection of the central plasma sheet onto the ionosphere. Particles here have sufficient energy to cause enhanced luminosity in proton aurora following strong pitch angle scattering (likely caused by field-line curvature).
The contribution of helium to these spatial distributions of auroral forms within the auroral oval is still unknown, as ground-based all-sky imaging of auroral forms identified with He++ or He+ ion precipitation has not yet been achieved due to the lack of sensitivity (QE) of traditional silicon sensor technology (such as, CCDs) at the relevant wavelengths.
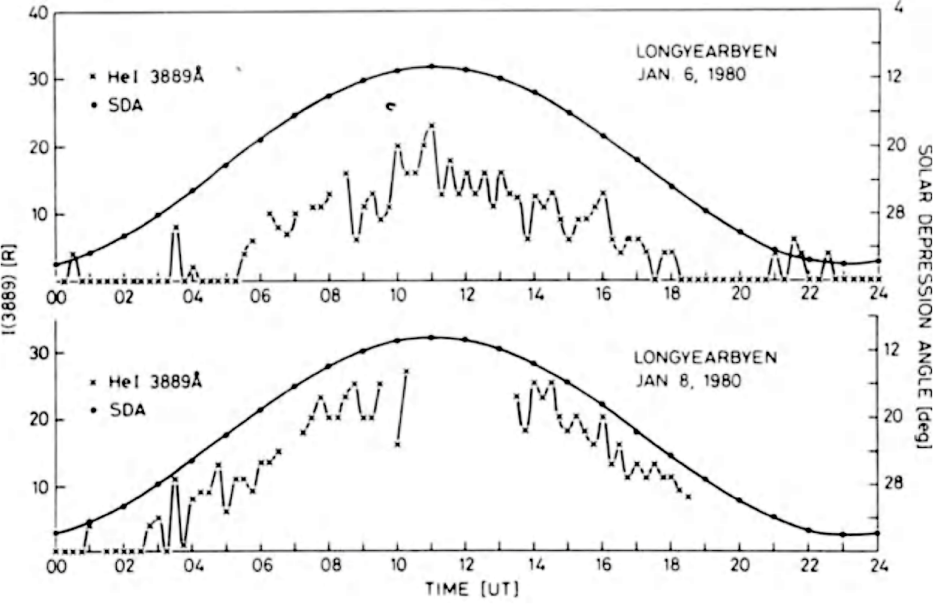
Some additional information is known regarding the role of energetic He+ and He++ particles in the cusp region. Henriksen et al. (1985) published the data for two sets of “daytime” 388.9 nm He spectra. These results, displayed in Fig. 8, showed that the behavior of this He emission brightness followed a bell-shaped curve that was anti-correlated with solar depression angle. The peak of this curve was seen during the noon period at the minimum solar depression angle of ~12°. Superimposed upon this smooth variation were occasional spikes of enhanced brightness of a few rayleighs lasting a few minutes for each spike. These results were interpreted to suggest that the smooth variation was a result of resonance scattering because the He 2S layer at 500 km was illuminated by the Sun. After considering several mechanisms, the authors claimed that the spikes were produced by incoming alpha particles that were transported into the cusp region by the solar wind. The analysis of polar cusp He images acquired in the SWIR spectral region would thus be of significant interest.
Adjacent to the auroral oval, there are often found against a background of diffuse auroral activity medium-scale auroral forms, 200 to 500 km in spatial extent. The appearance of these forms varies from spots to patches to elongated arcs of light emission. This phenomenology is summarized in the reviews by Frey (2007) and by Gallardo-Lacourt et al. (2021). Because these features are found poleward or equatorward of the oval, they are unlikely to be linked to the global auroral current system associated with the region of auroral activity. Accordingly, it is expected that such forms would have a different physical cause providing the increased flux or energy of precipitating electrons or ions. Some of these forms were first described using observations from the ISIS 2 and Viking satellites. The current availability of coincident solar wind data enables the integration of ground-based observations with a comprehensive perspective on solar wind-magnetosphere-ionosphere interactions, a synergy which has resulted in statistical investigations of large numbers of events and helped determine the external conditions that favored or suppressed a particular auroral form.
The application of a SWIR imager, such as the Keo Sentry-SWIR, to observe activity during geomagnetic storms at sub-auroral locations promises to enable the detection of SWIR emissions from these kinds of features during geomagnetic storm events, thus adding new insight into the underlying plasma physics.
This section describes a potential SWIR imager application that may well have a transformative outcome relating to ground-based optical studies of magnetospheric dynamics. Recently (cf. review by Keiling 2021), it has become evident that there are two distinct types of electron auroras: (1) direct precipitation of plasma sheet electrons that are accelerated by quasi-DC electric fields created by magnetic reconnection, and (2) ionospheric electrons that are accelerated by Alfvén waves. These two mechanisms are illustrated in Fig. 9.
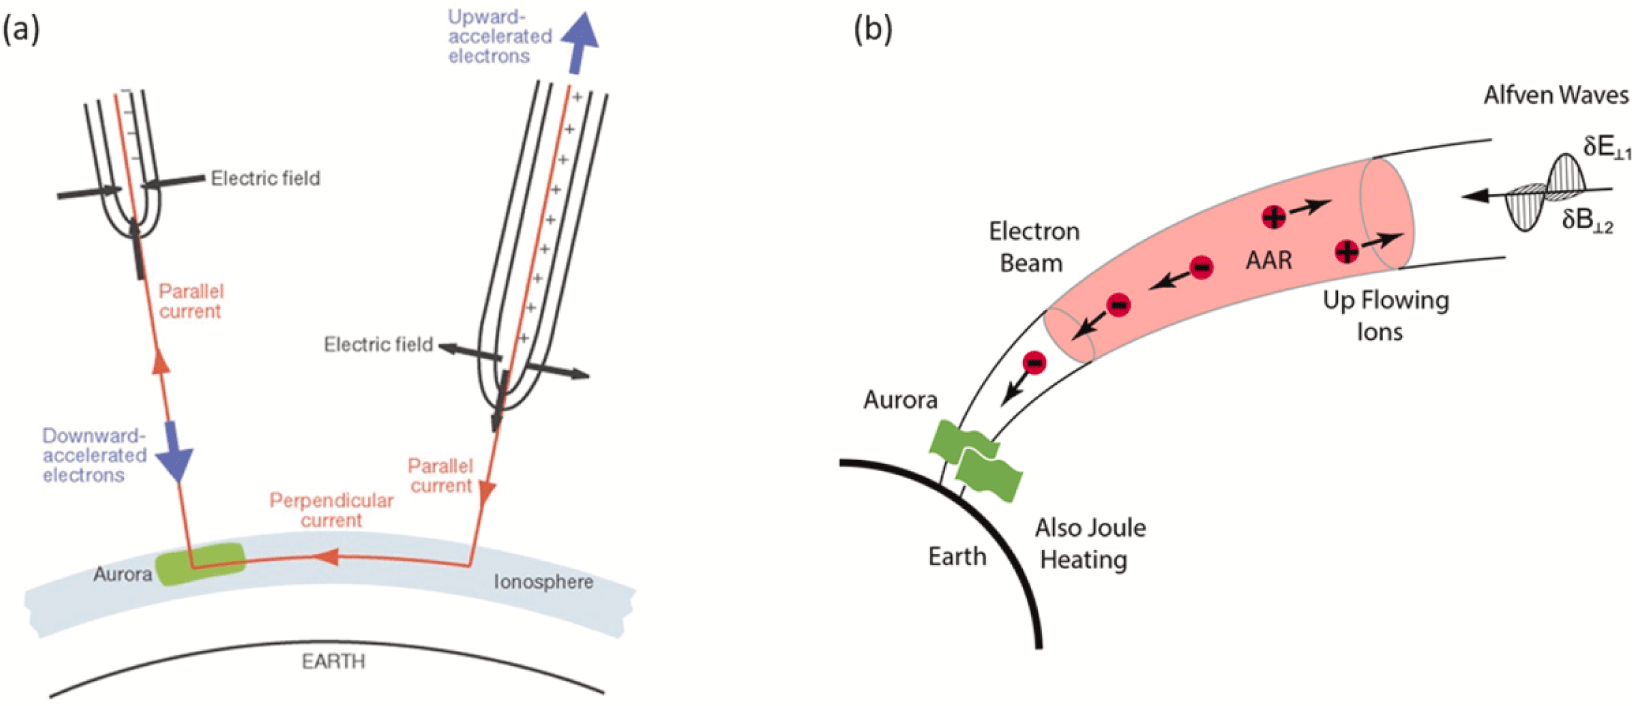
In the former case, the auroral electron beams are mono-energetic with characteristic energies above 2 keV and have the relatively low fluxes and densities that are typical of the plasma sheet. In the latter case, ionospheric electrons are accelerated by Alfvén waves that are propagated from deep within the magnetosphere. The resultant auroral electrons in this case are of low energy, less than 2 keV, and with the high fluxes that are characteristic of ionospheric plasma densities. Thus, if there is a method of determining the penetration height of precipitating particles, then a distinction between these two auroral types may be made.
An approach to the problem of distinguishing between these two types of auroras has recently been discussed in the literature (Mutiso et al. 2013; Mende 2016a, b). Alfvénic auroras have been identified in regions where magnetospheric reconfigurations take place, which might be the auroras associated with the auroral substorm onset, or with the auroral forms associated with poleward-expanding surges and boundary intensifications, or with dayside auroras [see reviews by Mende (2016a) and Keiling (2021)]. If Alfvénic auroras could be imaged and distinguished from other types of auroras, then it should be possible to apply ground-based optical imaging to map and monitor regions of significant magnetospheric dynamical activity. Thus, auroral imaging capable of distinguishing these two forms of dynamic electron auroras would be of great value in magnetospheric diagnostics.
As discussed in the review by Mende (2016b), these two types of electron auroras can be distinguished based on their electron energy spectra. Traditionally, remote sensing using optical measurement of electron energies was based on sensing the altitude of the aurora and comparing the intensity ratios of various spectral features emitted with different parent state lifetimes. Longer lifetime parent states have emissions that are attenuated by quenching in the lower atmosphere. Theoretically, from the ratio of spectral components of different quenching rates, the quenching altitude, and hence, the depth of particle penetration into the atmosphere, can be obtained. Unfortunately, this method is closely linked to the temporal response of the emissions. Thus, trying to use this method for studying highly dynamic electron auroras is intrinsically problematic, and the traditional methods of auroral energy discrimination applied to observations of electron aurora emissions are ineffective.
Measuring the rotational temperature, Tr, of the emitting species provides a means for making auroral height/electron characteristic energy measurements (Hunten et al. 1963; Jokiaho et al. 2008; Mutiso et al. 2013; Mende 2016b; Nishiyama et al. 2021). The temperature of the atmosphere at 100 km altitude is about 200 K, while at 200 km it might be ~800 K or higher. Therefore, the Tr measurement of a molecular auroral emission band combined with the MSIS 2.0 empirical model should be able to provide measurements of the auroral height, and thereby an estimate of the electron penetration depth. This concept is discussed in detail by Hunten et al. (1963) with an updated version presented by Mende (2016b), who applied this technique to the 0–1 band of the First Negative System of N2+ at 427.8 nm. Fig. 10 illustrates the wavelength positions chosen relative to the molecular band structure for two filter passbands for three Tr values. It can be seen how the intensity ratio would increase with an increase in Tr. In this work as well as that of Hunten et al. (1963), who observed the 0-0 band emission of N2+ at 391.4 nm, the ratio of measured photometer signals for auroral observations is obtained using two filters with wavelengths isolating the “head” and “tail” emissions. The observed ratio is compared with the set of predicted ratios for a range of Tr values computed from synthetic spectral analysis of the 0–1 band spectral profile convolved with measured filter transmission profiles for the two wavelengths. The interpolation of the observed ratio to the range of calculated ratios provides a reasonably accurate estimate of Tr.
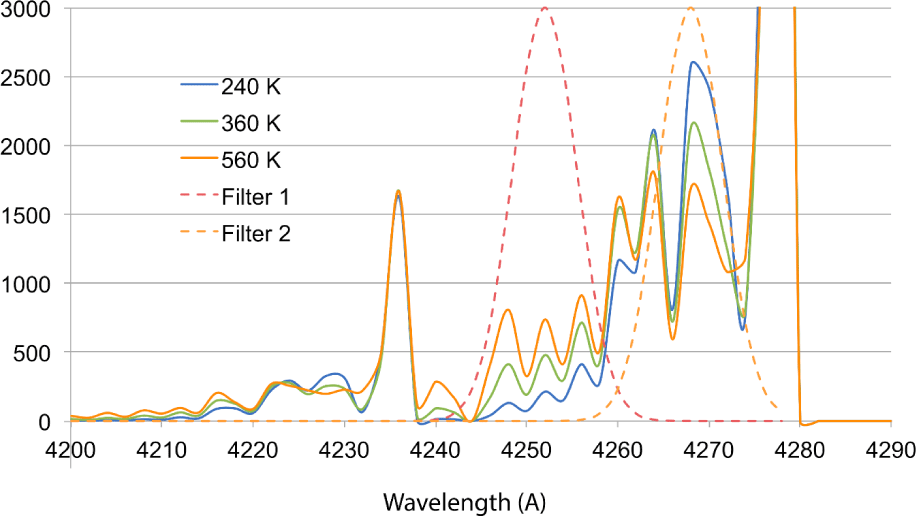
Comparing the inferred 0–1 N2+ rotational temperature to the MSIS temperature profile for the range between 100 and 200 km would extract an altitude for which the auroral penetration depth and precipitating particle characteristic energy can be inferred. In the case of the 0–0 N2+ Meinel band at 1,103.0 nm, the two head and tail emissions selected would be very bright (typically greater than 20 kR). Contamination by other nightglow or auroral emission sources would be minimal in this spectral range. Thus, each of the two images required for a SWIR imaging application could be observed with a fairly short exposure time of a few seconds.
It is important that the imager be fielded near an existing incoherent scatter radar (ISR) for the purposes of testing and calibrating the technique. The ISR generates ionization height profiles that can be directly compared to the height derived from the optical Meinel band emission ratios as observed by the SWIR imager. Previous efforts by Mutiso et al. (2013) using this technique combined with radar measurements were quite successful.
In conclusion, using one pair of (temporally and spectrally close) images and the model of calculated ratios, based upon synthetic spectra for a range of rotational temperatures, the auroral height and characteristic energy of precipitating electrons may be mapped across the observed spatial region (300 to 500 km in horizontal extent, with a horizontal resolution of tens of km depending upon the pixel binning strategy employed). Such a SWIR optical imaging technique should enable one to, e.g., quantify the role of Alfvén waves in creating phenomena such as poleward boundary intensification, substorm onset, and poleward expanding surges. Other examples include rays (Ivchenko et al. 2005), vortices (Chaston et al. 2010), poleward boundary intensifications (Mella et al. 2011), field line resonances (Liou & Takahashi 2013), and the poleward border of auroral surges (Mende et al. 2003). These features taken together are defined by Keiling to make up the Alfvén auroral oval.
5. POTENTIAL SWIR IMAGER SCIENCE APPLICATIONS: AIRGLOW STUDIES
The following subsections discuss the application of the Keo Sentry-SWIR – or any imager with similar performance characteristics – to two distinct potential airglow research topics.
Section 5.1 delves into the study of mesosphere dynamics by means of generating thermal maps and observing OH intensity distributions. The instrument has already been successfully applied to this application (Dalin et al. 2024). Section 5.2 proposes studying the short-term (hours) and long-term (seasonal) variability behavior of He and OH nightglow.
With reference to Table 1, the following is a suggested provisional selection of eight filters suitable for SWIR airglow studies:
-
Three filters for measuring the OH rotational temperature and OH intensities. The two filters sample the P1(2) and P1(4) brightness of the 4–1 band, and the third filter sample the background continuum. This application is described in Section 5.1.
-
Three filters to measure the He nightglow multiplet at 1,083 nm, using the technique described in Section 3.2. One suggested airglow application is described below, in Section 5.2.
-
One (1) 1,268.7 nm O2 airglow filter.
-
One (1) low-emissivity filter, described in Section 2.1, used to obtain a measurement of the infrared radiation produced by the instrument itself, and its environment.
The cadence is expected to be ~10 minutes for the full filter set. The instrument can be outfitted with other filters in the future, enabling “discovery science” as scientific understanding advances.
GWs in the Earth’s atmosphere are launched from many sources such as wind flow over mountains and jet stream adjustments (Xu et al. 2021, and references therein) as well as by tropospheric deep convection such as thunderstorms and tropical cyclones (Alexander et al. 1995; Fritts & Joan Alexander 2003; Alexander et al. 2010; Hoffmann & Alexander 2010). These waves tend to break at the turbopause altitude of ~105 km. For altitudes within the OH volume emission profiles most GW events are just beginning to undergo dissipation near the 85–87 km peak altitude of the OH nightglow. Clearly, obtaining a two-dimensional map of temperature and images of intensity wave structures with such a large field of view, covering 300 km, and high cadence would represent a powerful tool for studying mesosphere dynamics. An overview of the results that might be obtained from such maps of rotational temperatures and OH band intensities can be found in the work by Schmidt et al. (2013) and Wachter et al. (2015). These papers examined the statistics of the 61 wave events identified over the course of six months of observations. GW periodicities for the mesosphere region were found to be typically within the range of 2 to 4 hours. Inertial GWs and long period GWs showed much longer periods, perhaps 7 to 9 hours.
Nighttime imaging of SWIR OH emission in the upper mesosphere/lower thermosphere region around 87 km altitude have proven useful over the past decade in providing large-area remote sensing of mesospheric temperatures, as well as intensity maps showing the propagation and dissipation of atmospheric GWs and small-scale features known as ripples. The intensity ratio of OH rotational emissions of P1(2) at 1,523.68 nm to P1(4) at 1,542.79 nm is central to the measurement of mesospheric temperature. These two emissions display substantial luminosity, with a brightness ranging from 5 to 10 kR (Nishiyama et al. 2021), allowing a SWIR imager to capture mesoscale imagery at a high ratio of signal to noise.
The technique of comparing the brightness of two or more emission lines from hydroxyl in the region around 87 km altitude was pioneered by Meriwether (1975) and is the basis for the Mesospheric Temperature Mapper (MTM) (Taylor et al. 2001) and the AMTM (Pautet et al. 2014). Other optical methods for determining the temperature of this region of the atmosphere are presented in a comparison table by Pautet et al. (2014), and have similar measurement errors, but significantly smaller fields of view. These instruments include a Fourier spectrometer, a Fourier transform spectrometer, a Michelson interferometer, and a more traditional spectrometer.
Fig. 11 (adapted from Trondsen et al. 2021) shows the filter functions of the two OH channels and the 1,521.0 nm background continuum, channel, superposed on a synthetic spectrum (courtesy of Philippe Rousselot, University of Franche-Comté). Filter bandwidths are 1.0 nm FWHM.
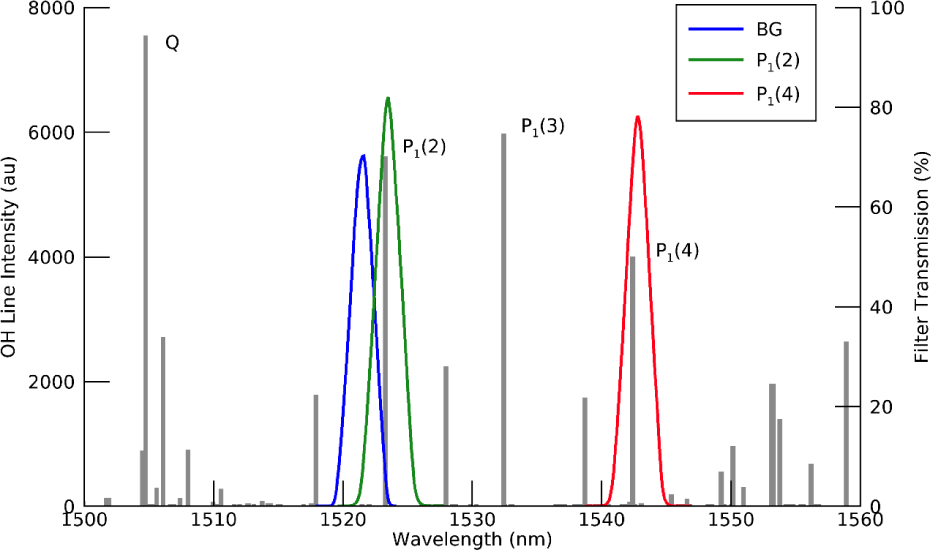
Fig. 12 shows raw images acquired using a Keo Sentry-SWIR (Trondsen et al. 2021). The images presented here have 10 second integration periods for the three sky channels (and the dark frame, not shown). Note that the background channel exhibits minimal sky emission within its spectral bandwidth.
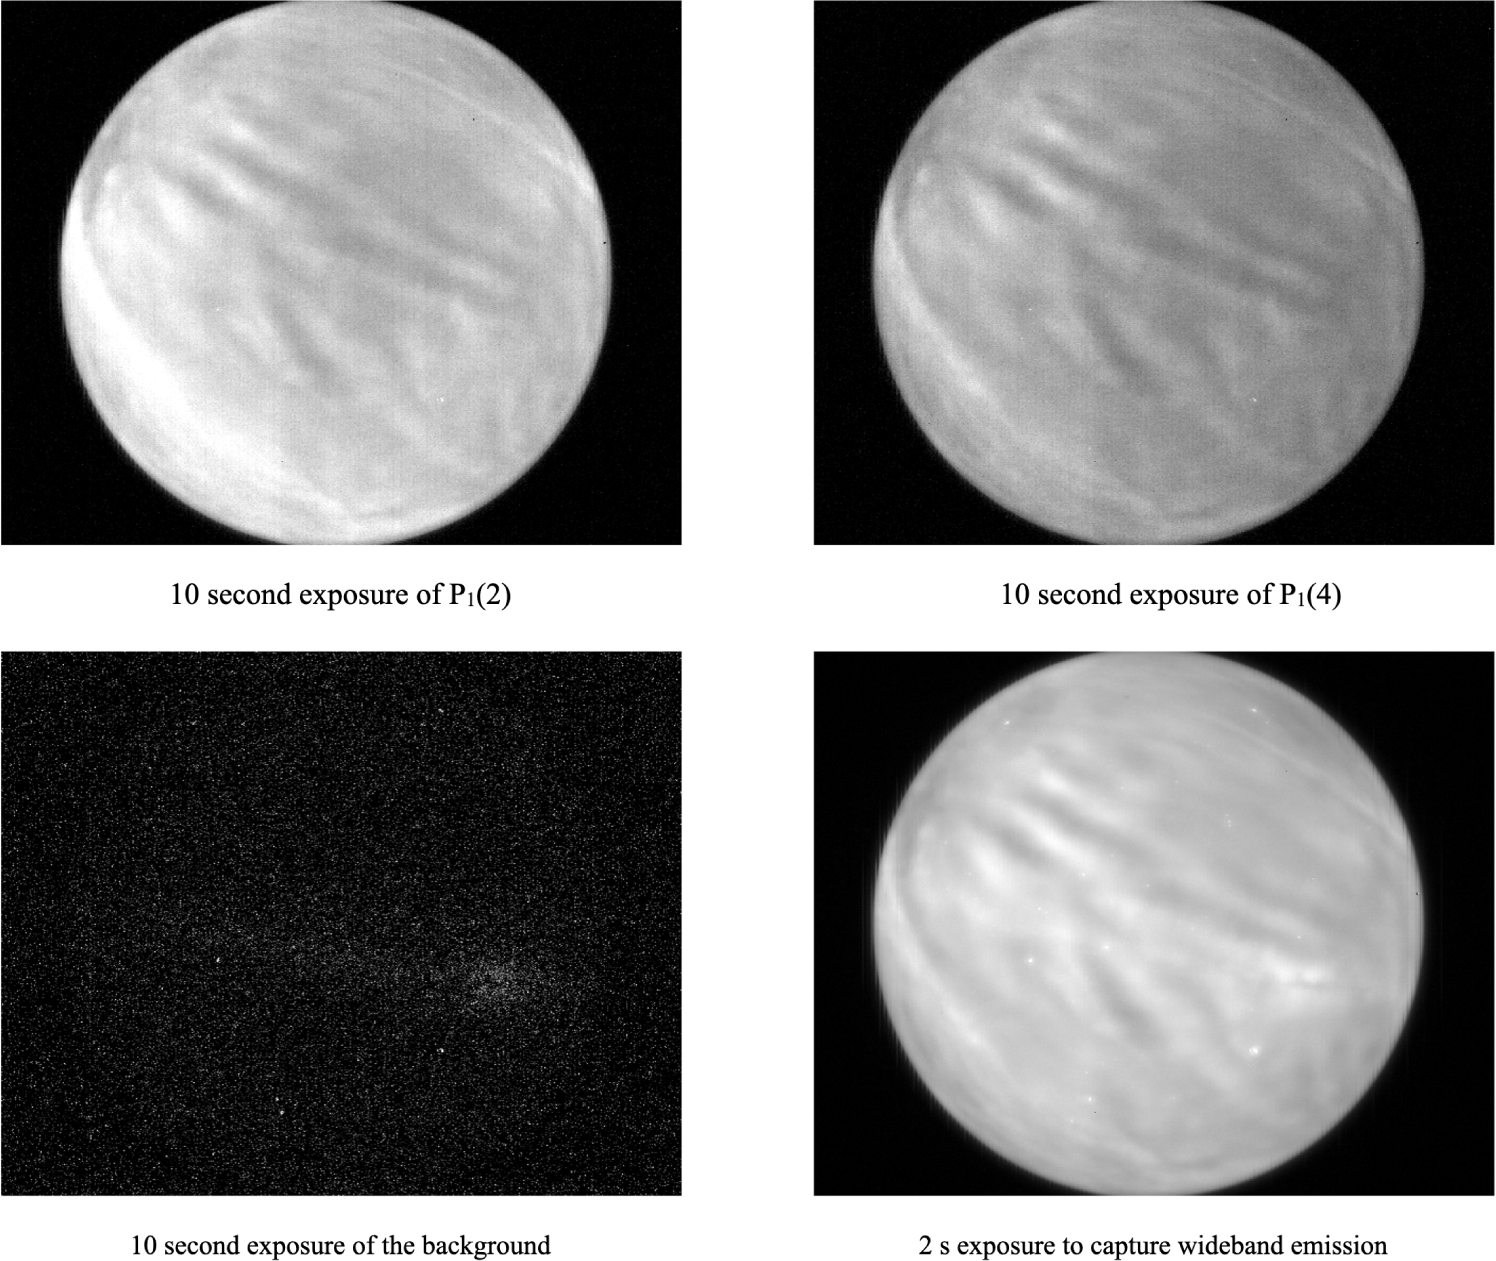
Data inversion from these raw images to the creation of a temperature map is a multi-step process involving dark subtraction, background subtraction, field flattening, conversion to absolute brightness and finally calculation of the sky temperature from the brightness ratio. The process of dark-frame subtraction involves capturing dark frames, which are subsequently used to eliminate both the fixed pattern noise of the InGaAs photodiode array (manifesting as vertical streaks, as seen in the raw data of Fig. 12) and other non-signal counts present in the pixels. The process of background subtraction, performed in spectral density space, is used to remove the broadband continuum emission present within the spectral passband of the OH filters. The field flattening step is required to account for vignetting and intra-filter variation in transmission across the surface of narrowband filters at the OH emission wavelengths. The process of converting to absolute units can subsequently be carried out, followed by the calculation of the ratio of hydroxyl line emission intensities, and finally the temperature of the OH layer can be estimated using the following equation (from Pautet et al. 2014):
where R is the brightness ratio of P1(2) to P1(4).
Note that Dalin et al. (2024) uses a factor of 2.658 instead of 2.644, as they corrected the equation for newly estimated Einstein A-coefficients for the OH(3-1) band at P1(2) and P1(4) lines, as calculated by Brooke et al. (2016). This results in a 0.7 K–1.5 K temperature difference between Pautet et al. (2014) and Dalin et al. (2024) temperature estimations, for a typical range of winter temperatures in the mesopause.
Fig. 13, from Dalin et al. (2024) shows an example of the resulting corrected temperature map, capturing spatial scales on the order of kilometers.
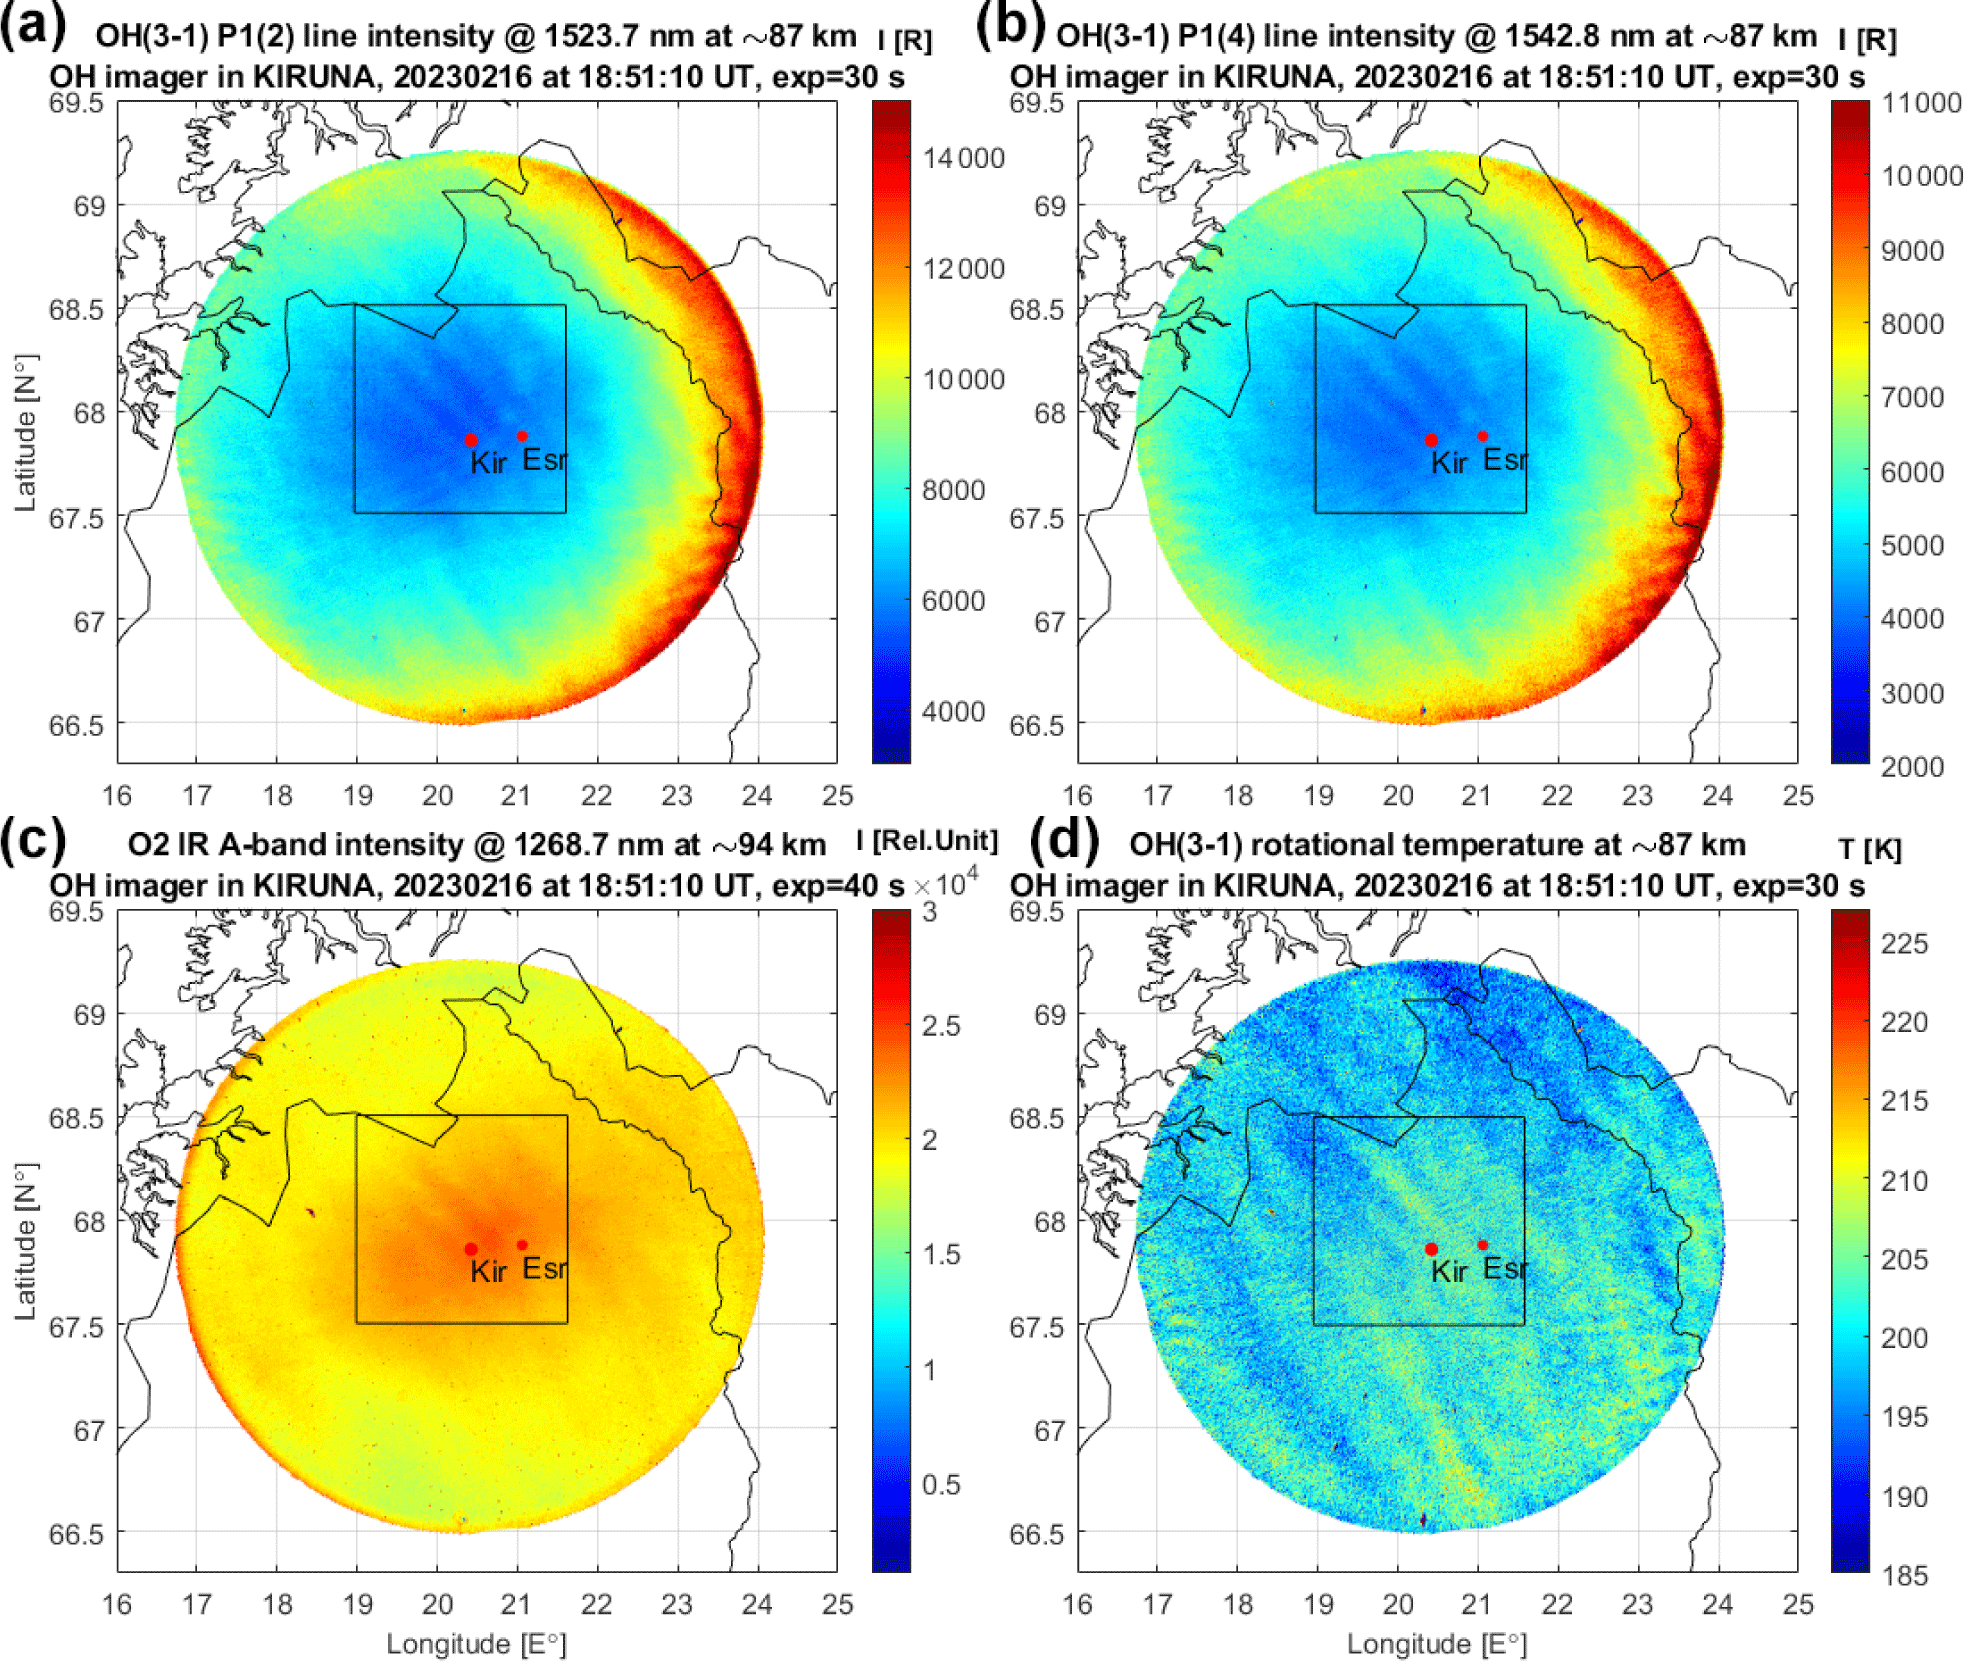
Dalin et al. (2024) also employed a 1,268.7 nm filter to measure airglow emissions from the O2 IR A-band, originating at the slightly higher altitude of ~94 km. This technique allows mapping GW disturbances in the horizontal as well as the vertical dimension in the mesopause region.
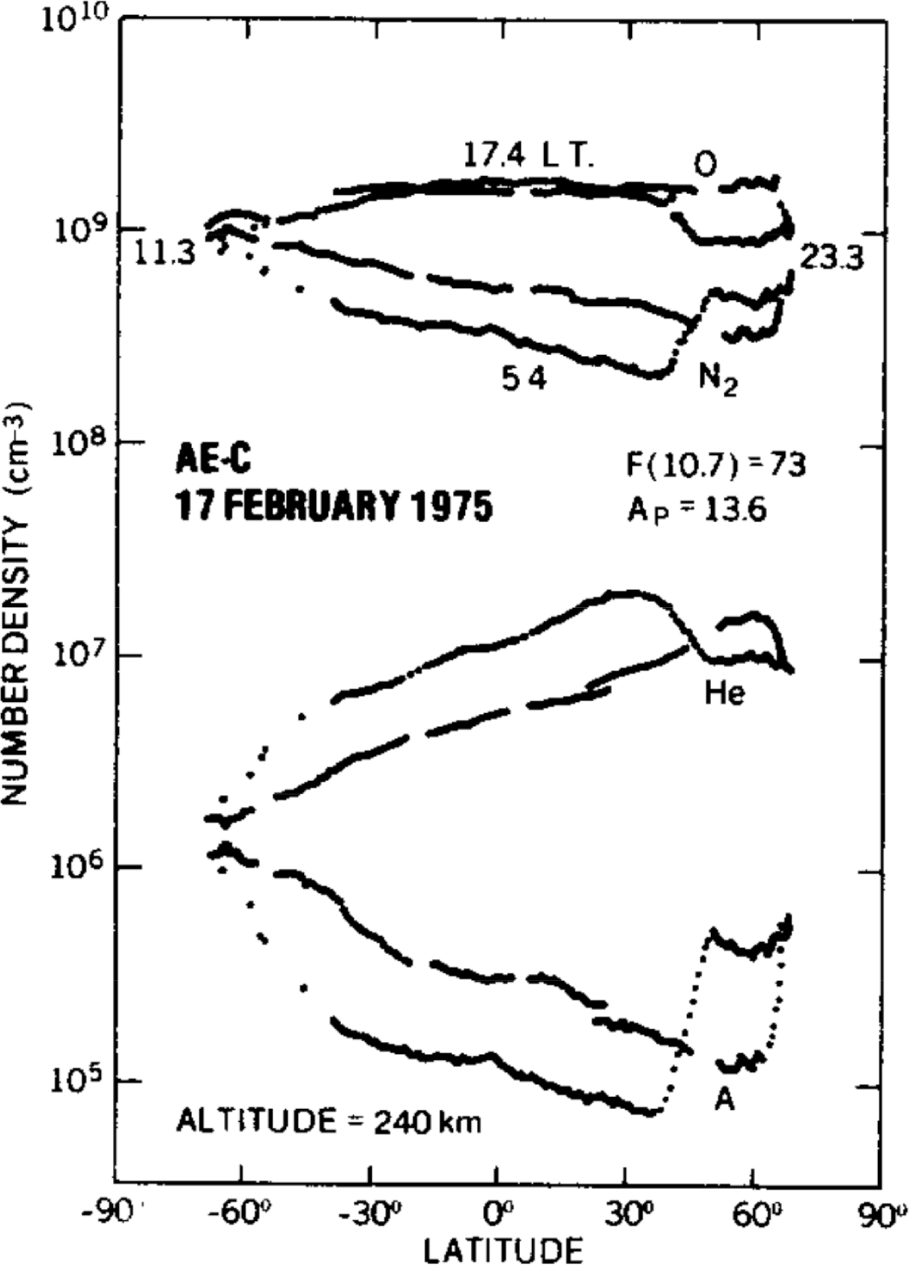
The question of the He composition distribution at low Earth orbit (LEO) altitudes has attracted considerable attention in recent years (Thayer et al. 2012; Sutton et al. 2015). This renewed attention can be attributed in part to the fact that the production of the He winter bulge contributes substantially toward the uncertainty in total atmospheric density estimates for LEO altitudes in the polar regions. Fig. 14 illustrates an example of the winter He bulge seen in OGO-6 data obtained at 240 km, in contrast to N2, O, and Ar densities (Reber 1976). The variation in He density from the summer pole to the winter pole is about an order of magnitude. Also of interest in this figure is the sharp reduction of the He density resulting from a moderate geomagnetic disturbance. The origin of the He winter bulge has been attributed to a global circulation cellular system featuring upwelling in the central polar region in the winter hemisphere and downwelling in the summer hemisphere (Reber & Hays 1973; Reber 1976; Sutton et al. 2015).
Waldrop et al. (2005), using Arecibo ISR composition data and models for the topside photochemistry and production by photoelectron impact, calculated the metastable He(23S) density profile for morning twilight at a solar zenith angle of 110°. These calculations also compensated for losses caused by the processes of radiative decay, photoionization, and Penning ionization. It was found that the He(23S) vertical distribution has a broad peak within the height range of 400–800 km. The nightglow 1,083 nm He triplet emissions are generated by resonant scattering of the 1,083 nm solar photons by the metastable He atoms within this layer.
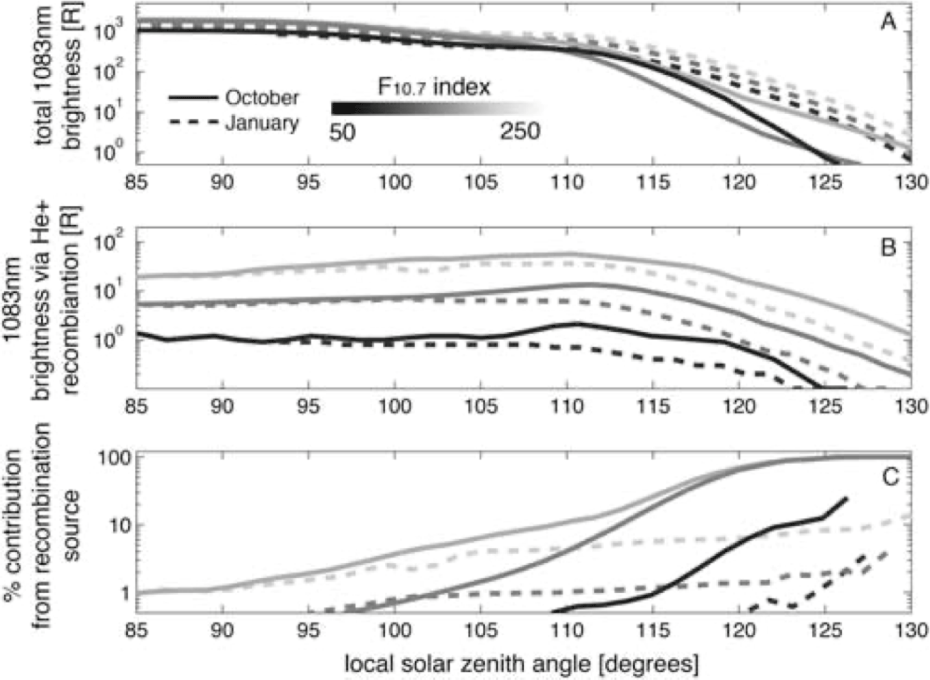
The He 1,083 nm nighttime brightness variation is key to the proposed SWIR measurements. It is well known that there is likely to be – especially for the solar maximum period – continual excitation of this helium 1,083 nm emission throughout the night, but with enhanced brightness near twilight caused by photoelectron impact (as also used in Gerrard et al. (1997) for He-LIDAR calculations). The intensity variation found in these calculations for a 85°–130° range of solar zenith angles was typically from 1,500 to 2,000 R in twilight to 30 to 50 R near midnight, as shown in the top panel of Fig. 15 (Waldrop et al. 2005). The bottom panel in Fig. 15 shows the variation of the production by the recombination and photoelectron impact sources, including the flux from the conjugate hemisphere.
The span of the He nightglow images of 1,750 km, as acquired by a SWIR imager with 120° field of view, would correspond to a fairly large range of about 12° in latitude. This implies that the SWIR imager should be able to observe variations in the meridional gradient in the exospheric He brightness over a period of hours to several nights. Interpretation of these results will likely require comparisons of TIEGCM model predictions with case studies of He brightness data for a range of F10.7 and Kp indices.
In summary, imaging the He airglow during twilight for solar zenith angles within the range of 100°–130° promises to enable the determination of the He winter bulge dynamics with potentially high precision at LEO heights, of particular interest to space weather studies as applied to orbital drag considerations.
6. CONCLUSIONS
The extension of geospace imaging into the SWIR portion of the spectrum (1.0–1.7 µm) offers new avenues for space weather exploration and holds the potential to contribute to a deeper understanding of the geospace environment. The versatility of SWIR imaging may also improve diagnostic measurements in support of existing instrumentation and facilities.
This paper specifically introduces the Keo Sentry-SWIR imager and its successful deployment in studying mesosphere dynamics, emphasizing the potential of SWIR imagers in general for a wide range of applications, including exploring energetic particle deposition distributions, identifying sub-auroral phenomena, investigating Alfvénic auroras, and exploring helium nightglow brightness variability.
It should be noted that the emission intensity of helium is closely tied to the level of solar activity (Shefov et al. 2009). Currently, solar activity is increasing, and there is a projected peak expected later this year. This makes the years 2024/2025 particularly favorable for helium brightness studies.


