1. INTRODUCTION
The role of lasers in the utilization of space is gaining prominence in today’s context. Lasers can enable various applications such as satellite laser ranging (SLR) and laser communication. Laser communication, in particular, offers faster data transmission speeds compared to traditional RF communication methods, features a smaller beam footprint and enhanced security, and is characterized by a reduced size, weight, and power (SWaP) profile. As a result, it is being considered as a potential replacement for RF communication in future space communication. However, unlike RF communication, laser communication necessitates precise directional operations between the satellite and the ground station, namely PAT (Abdelfatah et al. 2022). During the PAT operations, atmospheric effects, present between the ground and space, inevitably cannot be excluded when performing coarse acquisition. Consequently, various studies have been carried out to correct for atmospheric effects in order to maximize the effectiveness of space lasers from the ground (Tyson 1996; Yang et al. 2006; Shamsipour et al. 2018).
To correct for these atmospheric effects, an adaptive optics system is required. The simplest form of adaptive optics is tip/tilt correction, which is akin to correcting the tilt of the wavefront in two dimensions. In this type of adaptive optics, the tip/tilt mirror is an important component. It is installed in the optical path, and by tilting the mirror, it corrects distorted beams, particularly with the inclusion of a fast steering mirror (FSM). By compensating for optical axis misalignment, it prevents image degradation, retains the intensity of the target source, and maintains optical characteristics. Many of the aberrations induced by the atmosphere can be mitigated using this approach. Additionally, it not only is cost-effective but also provides a low SWaP in terms of the design engineering. Therefore, we utilize an adaptive optics system employing tip/tilt correction to mitigate the atmospheric turbulence. In addition, various factors such as satellite orbit, communication modulation, transmitter beam performance, and receiving aperture can affect the downlink channel performance in turbulent conditions (Lim et al. 2020a, b). However, to assess the effect of tip/tilt correction, we keep the impact of other factors fixed.
We are planning to establish a ground station for future laser communication with satellites. This ground station will utilize the existing infrastructure of the GEOL station (at Geochang, Korea; Lim et al. 2018), which is currently used for SLR, with the goal of constructing a PAT system for laser communication. In this paper, we simulate the angle-of-arrival (AoA) fluctuation caused by atmospheric turbulence for the purpose of building the ground station. We also analyze the intensity fluctuation of the beam detected by the detector. Furthermore, we present the effects of coarse acquisition based on the results obtained using tip/tilt mirrors. It is important to note that the results we present focus solely on scintillation due to pointing error and are intended to verify the correction effects of tip/tilt compensation.
2. METHODS
Our simulation utilizes the infrastructure of the GEOL SLR station. We employ a 1m telescope and use a laser with a signal wavelength of λ = 1,550 nm for laser communication. Additionally, we introduce a beacon beam to measure atmospheric effects, assuming that it resolves the isoplanatism angle issue resulting from different propagation paths compared to the signal beam, as seen in conventional applications such as laser guide stars. Table 1 provides details of the parameters for the proposed system.
Due to temperature gradients in the atmosphere, turbulent spatial fluctuations cause refraction of the laser propagation direction, simultaneously affecting the wavefront phase. The refractive index structure parameter, known as , characterizes the refractivity of atmospheric turbulence, which is also referred to as optical turbulence. Numerous models for representing this parameter have been developed. In our research, we employ the Hufnagel-Valley (H–V) model, which is expressed as follows (Andrews, 2019):
where w is root-mean-square(rms) wind speed in m/s, A is the nominal value of at the ground in m–2/3, and h is the height above sea level in m.
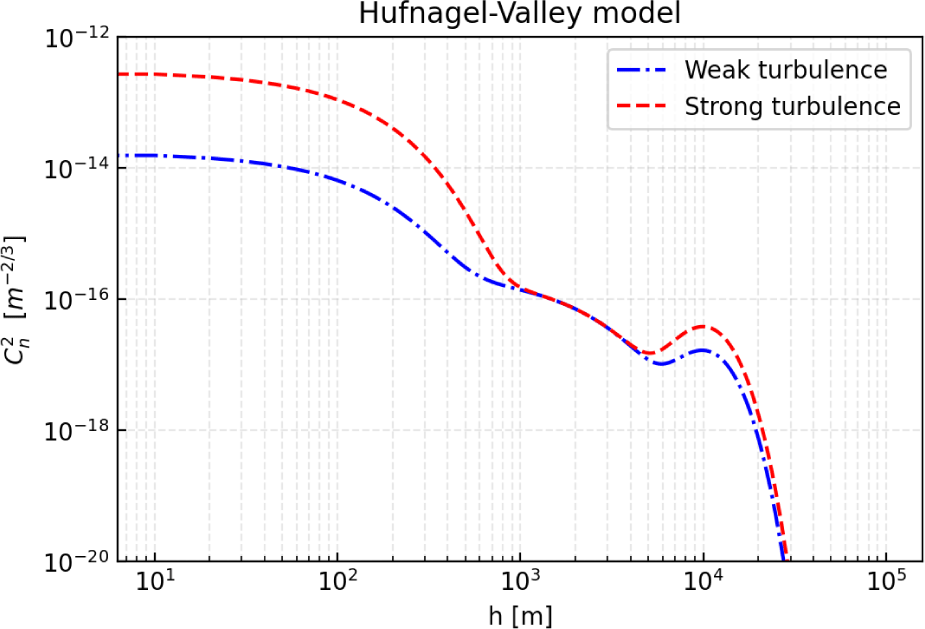
As evident from this model, the refractive-index structure profile with respect to altitude is determined by the values of w and A, which can be considered as a measure of turbulence strength. In this paper, we consider the profile known as the H–V5/7 model (w = 21 m/s, A = 1.7×10⁻¹⁴m–2/3) for weak turbulence and substitute w = 32 m/s, A = 3.0×10⁻¹³m–2/3 into the H–V model for strong turbulence. Fig. 1 depicts the refractive index values at different altitudes calculated based on the conditions determined above for both weak and strong turbulence.
The wavefront of the laser beam arriving at the receiver is distorted and refracted due to atmospheric turbulence, ultimately reaching the receiver. This causes the beam’s center to deviate from the on-axis at the receiver’s focal plane, resulting in spot motion. In addition, jitter from both the transmitter (satellite) and the receiver (ground station) contributes to image dancing. These effects are referred to as AoA fluctuations and occur randomly depending on turbulent conditions. The variance of random AoA fluctuations is denoted as and can be expressed as follows (Andrews & Phillips, 2005):
where ζ is the zenith angle and D is the receiver’s (telescope) aperture diameter.
In this case, the AoA fluctuation results in the displacement from the center at the focal plane. The variance of this displacement is expressed Eq. (3) as rms (Fernandez et al. 2018), and it is known to follow a Rayleigh distribution.
where, f is focal length of the receiver.
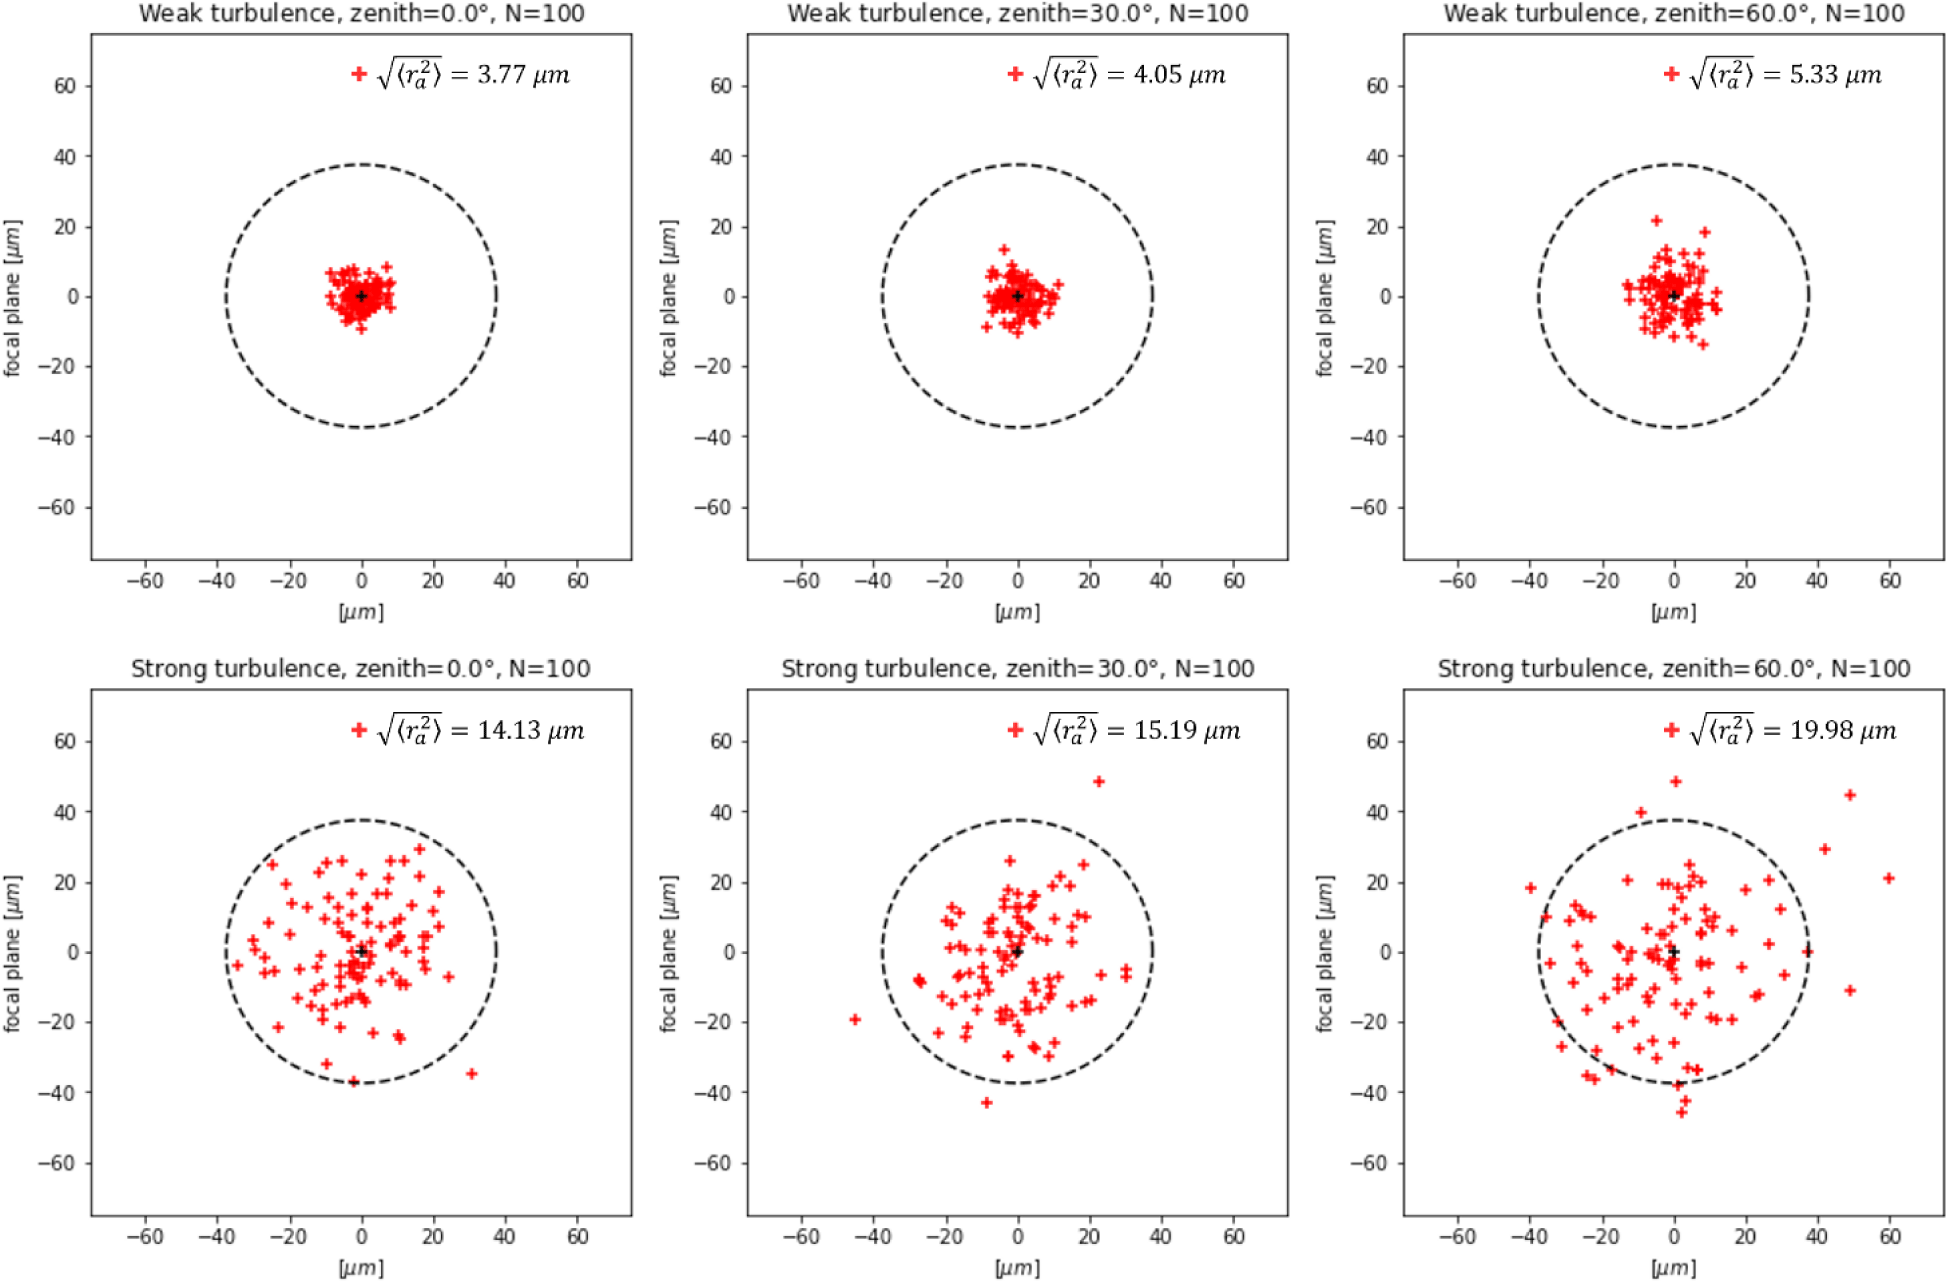
Fig. 2 illustrates how the center of the beam reaches the focal plane due to AoA fluctuations caused by atmospheric turbulence. The dashed black circles in each figure represent the area where the detector detects the beam. In the case of weak turbulence, most of the beam is concentrated within the detector’s area and at its center. In contrast, for strong turbulence, the beam is more dispersed from the center and, in severe cases, it can be observed that it extends beyond the detector’s area. Such errors from the center are one of the factors degrading the power collected by the detector, but they can be compensated for using a tip/tilt mirror.
When a beam reaches the focal plane, it is well-known that the intensity of the beam follows a distribution called the Airy disk. As shown in Fig. 2, the center of the beam at the focal plane is offset from the center of the detector. The intensity of the beam that reaches the focal plane forms an Airy disk centered on the beam’s center. As a result, a portion of the beam’s intensity distribution extends beyond the area that the detector can capture. Only the portion of the beam within the detector’s detectable area is received, allowing us to calculate the received beam’s power. For the sake of convenience in our calculations, we approximated the beam’s Airy disk distribution as a Gaussian distribution. The following equation can be used to approximate the Airy function as a Gaussian function (Cheon & Muschinski 2007; Fig. 3):
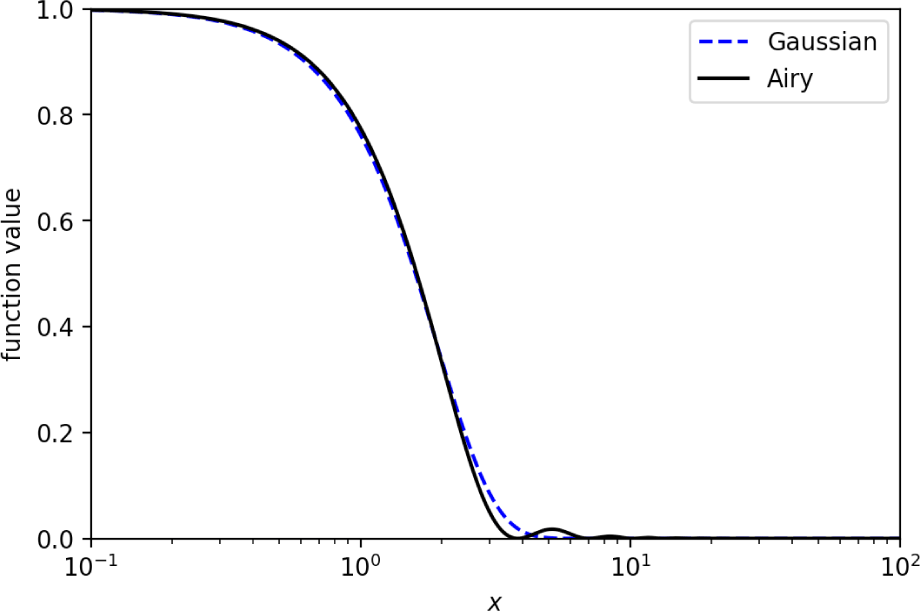
where is the first-order Bessel function and x = kRsinθ consisting of the wave number k, the aperture radius R, and the observation angle θ.
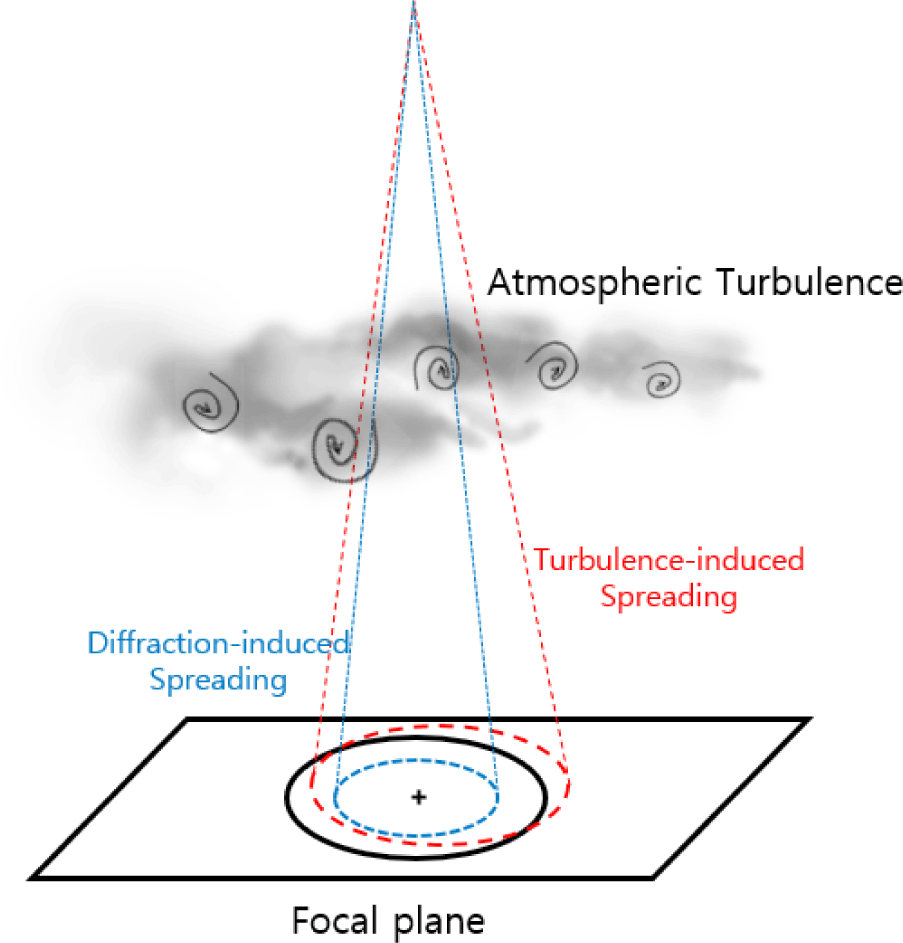
Furthermore, when the beam reaches the focal plane, it not only moves away from the center but also experiences spreading of intensity profile from the beam’s center due to diffraction and turbulence. As shown in Fig. 4, atmospheric turbulence exacerbates this spreading, causing the radius of the beam reaching the focal plane to increase further. The full width half maximum (FWHM) of the beam due to diffraction and turbulence is expressed as follows:
The beam’s FWHM due to turbulence is characterized through a metric known as the Fried parameter, denoted as r0, which represents the optical system’s ability to withstand the influence of atmospheric turbulence to some extent. The FWHM of the beam at the focal plane can be calculated by consolidating Eqs. (5) and (6) as follows (Robbe et al. 1997):
However, in a Gaussian distribution beam profile, the FWHM represents the diameter at which the beam’s intensity becomes 1/2 of its maximum intensity, which does not fully characterize the beam size. The beam radius corresponds to the point where the beam’s intensity drops to 1/e2 of its maximum intensity. Using this relationship, we calculate the beam radius as follows:
In this way, we obtain a Gaussian distribution-approximated beam intensity profile through the beam radius, and this in turn allows us to calculate the power of the beam received by the detector. The results of these calculations are presented in Section 3.
Several factors, including atmospheric turbulence-induced AoA fluctuation, contribute to the tilt error (σtilt). It can also be calculated through FSM control as follows (Olivier et al. 1993) :
Here, σSNR arises due to the finite signal-to-noise ratio (SNR), and σTA is induced by finite angular separation between an astronomical object (or guide object) and a reference object, referred to as tilt anisoplanatism. σBW represents the error resulting from the finite closed-loop bandwidth of the tip/tilt compensation system while σHO denotes the error in the wavefront tilt estimate due to centroid anisoplanatism and uncorrected high-order aberrations expressible by Zernike polynomials. The tilt error before compensation is equivalent to the previously mentioned AoA fluctuation.
Looking at each of the errors, first, σSNR can be expressed as follows:
Here, fc is the tip/tilt system’s closed-loop bandwidth, and fs is the sampling frequency. fs should have a value faster than the tilt Greenwood frequency to track AoA fluctuations caused by atmospheric turbulence, and fc should be at least four times the Greenwood frequency to design an appropriate adaptive optics system (Hemmati 2020).
σTA represents the error that occurs when using different optical paths, such as when employing a laser guide star or an astronomical object for atmospheric correction, that are distinct from the signal laser. In this study, using a beacon beam aligns with the same optical path as the signal beam, and therefore, σTA is considered to be 0.
σBW is the error that arises because the atmosphere changes during the finite time that the FSM’s closed-loop corrects the wavefront tilt induced by the atmosphere. During this time, the object and the reference wavefront tilt change, leading to an error. This error is a dominant factor affecting the tip/tilt adaptive optics system.
Here, fT represents the tilt Greenwood frequency that describes the minimum closed-loop bandwidth required for tilt compensation, which tracks the changes in tilt due to turbulence in the continuously mixed air, depending on the state of atmospheric turbulence (Tyson 2000). The performance of the closed-loop bandwidth determines the adaptive optics performance for tilt based on how much faster it can move compared to the Greenwood frequency.
Finally, σHO arises from high-order aberrations in the wavefront. The wavefront distorted by turbulence includes not only tilt aberration but also all higher-order aberrations. σHO represents only the error resulting from the remaining high-order aberrations, excluding tilt aberration.
To correct the σHO term, the wavefront distortion caused by turbulence can be analyzed for high-order wavefront aberrations represented in Zernike polynomials using equipment such as Shack-Hartmann sensors. Compensation can be achieved by controlling a deformable mirror. However, we only focus on the effects caused by low-order (tip/tilt), and therefore, we do not consider high-order compensation.
In Table 2, both the uncompensated σtilt and the compensated σtilt for strong turbulence are presented.
| Weak turbulence | Strong turbulence | |||||
|---|---|---|---|---|---|---|
| Zenith angle [deg] | 0 | 30 | 60 | 0 | 30 | 60 |
| Uncompensated [arcsec] | 0.52 | 0.56 | 0.73 | 1.94 | 2.09 | 2.75 |
| Compensated [arcsec] | 0.07 | 0.07 | 0.09 | 0.25 | 0.27 | 0.36 |
The compensated σtilt for each zenith angle decreased approximately by 87% (86.9% in the weak turbulence and by 87.1% in the strong turbulence) compared to before compensation, and the remaining 13% of the compensated σtilt appears to be dominated by uncompensated σHO. This suggests that to achieve more precise beam center correction, compensation of high-order aberrations is also necessary.
3. RESULTS
For the convenience of calculation, in Section 2.4, we looked into a method of approximating the intensity of the beam reaching the detector as a Gaussian distribution. If, as shown in Fig. 5, the beam’s center reaches a point ra away from the center of the detector due to AoA fluctuation, the detector will only capture a portion of the beam. In this case, the collected power of the beam at the detector can be approximated as follows (Yang et al. 2014) :
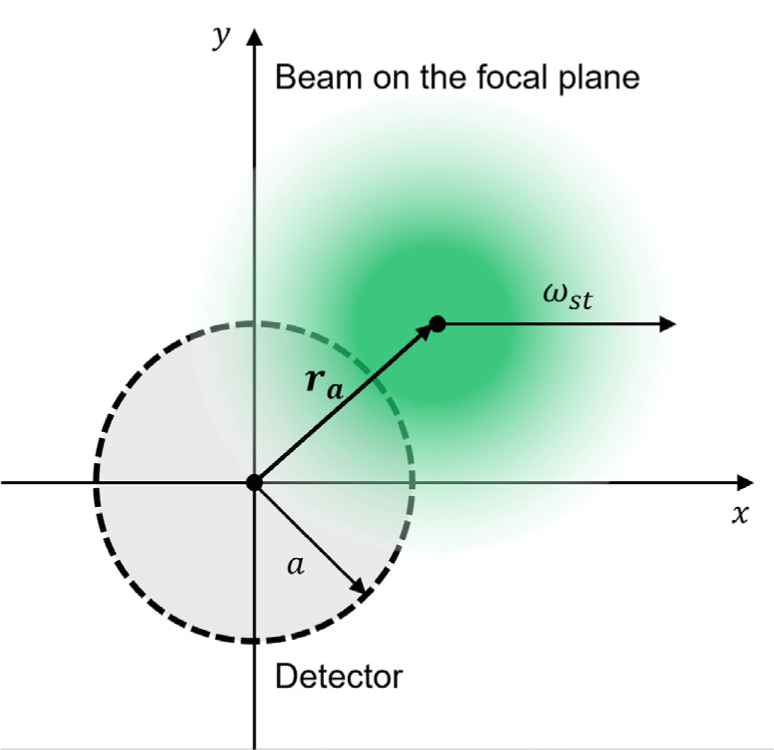
Here, A0 is the fraction of collected power at ra = 0 and ωeq represents the equivalent beam width. The beam’s size is determined by the intensity of turbulence. Depending on the beam’s size, even if the beam’s center reaches beyond the detector, power can still be detected. Conversely, when the beam arrives at the center of the detector (where the detectable power is maximum), any part of the beam extending beyond the detector’s size will result in loss. Such loss cannot be compensated for by tip/tilt alone. In weak turbulence, nearly all of the beam is collected by the detector, while in strong turbulence, the collected beam is significantly reduced, as seen in Fig. 6.
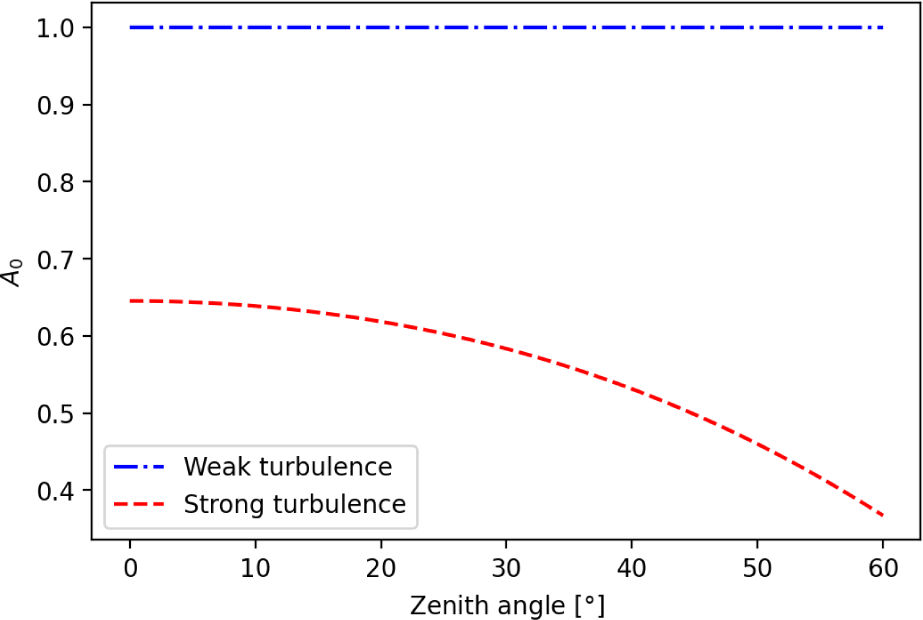
In weak turbulence, since the size of the beam is smaller or similar to the size of the detector, the on-axis beam can be fully collected at the detector. Conversely, in strong turbulence, because the beam’s size exceeds the detector’s size, it is confirmed that a significant portion of the beam entering the detector can be lost even in the absence of pointing error.
Through simulations, we created 1,000 samples for each zenith angle, normalized the ratio of collected beams at the detector, and examined them. Additionally, we compared the collected beams at the detector under reduced tilt error achieved through tip/tilt mirror control. The comparison is presented in Fig. 7.
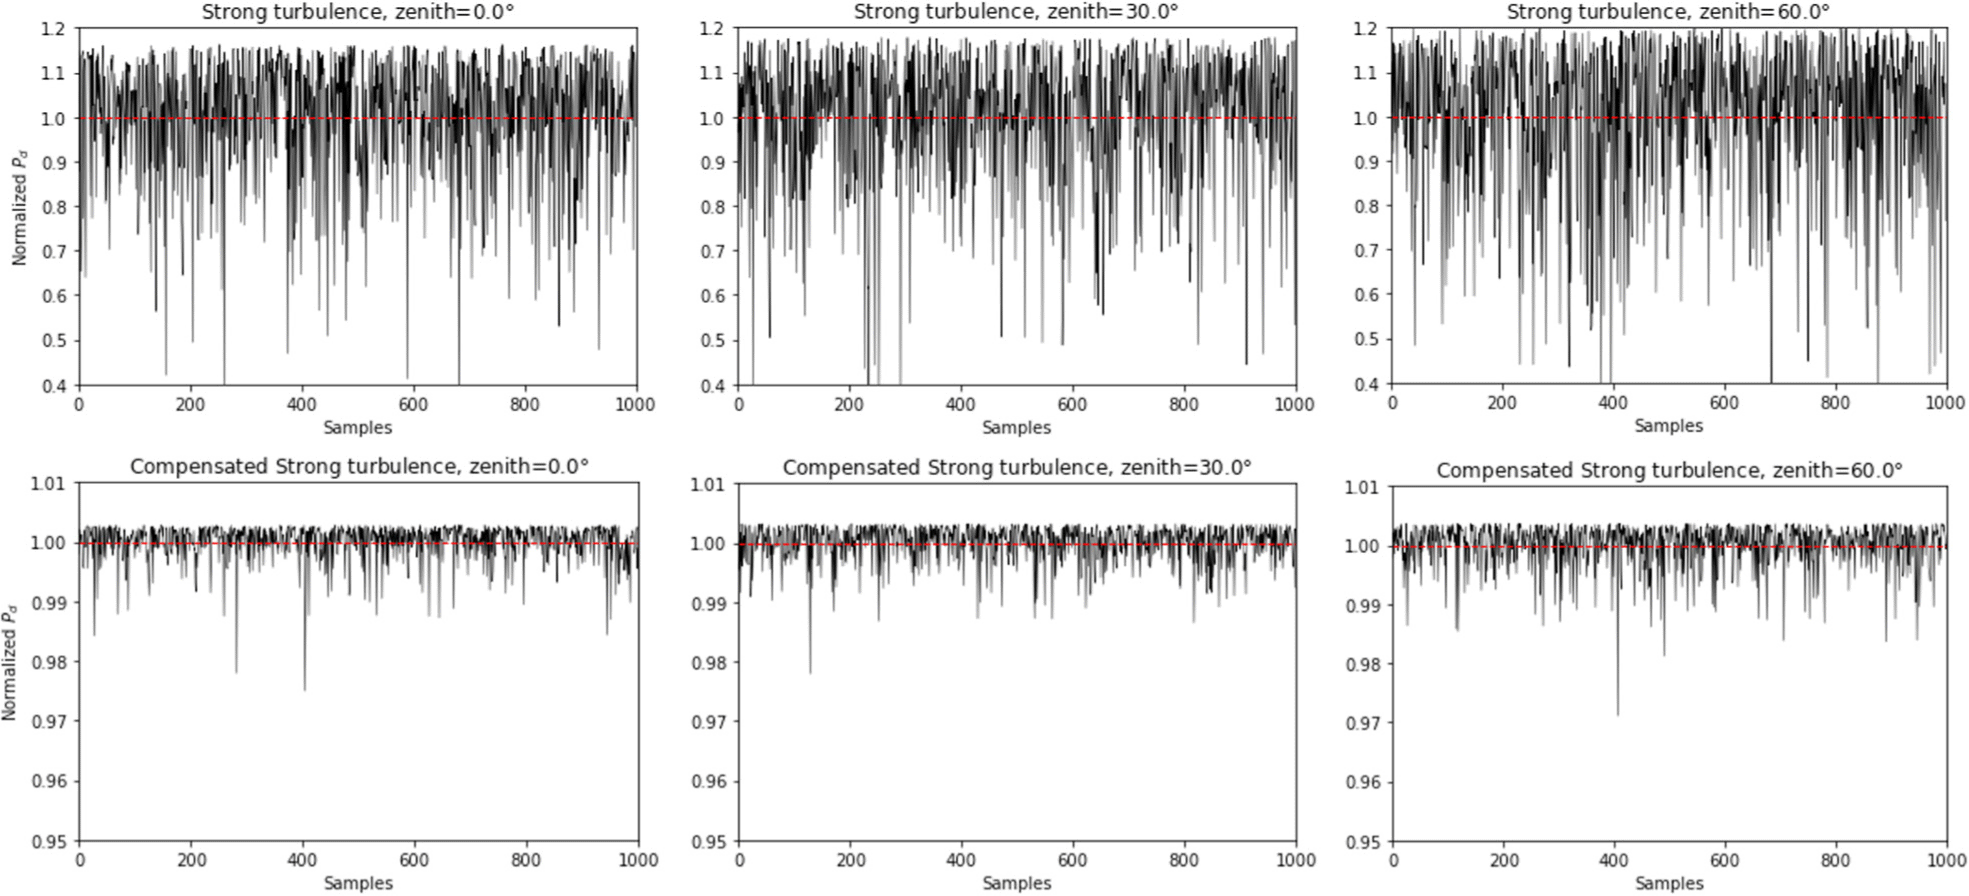
Tip/tilt compensation demonstrates a noticeable reduction in the fluctuation of the collected signal power at the detector. The upper limit of each fluctuation indicates the value of A0, which is affected by the increased ωst due to turbulence.
The received power at the detector is determined by the distance between the center of the detector and the center of the beam, ra, as well as the beam size at the focal plane, ωst. Moreover, the random distribution of ra follows a Rayleigh distribution. The probability density function of the Rayleigh distribution is as follows:
where, is jitter variance at the receiver. The probability density function for the received power Pd at the detector is derived by combining Eqs. (15) and (16) (Farid & Hranilovic 2007).
The collected power is normalized, and the power before and after tip/tilt compensation is compared. In the case of weak turbulence, it was confirmed that even without tip/tilt compensation, most of the beam profiles are already collectable within the detector region. The comparison results for strong turbulence are shown in Fig. 8.
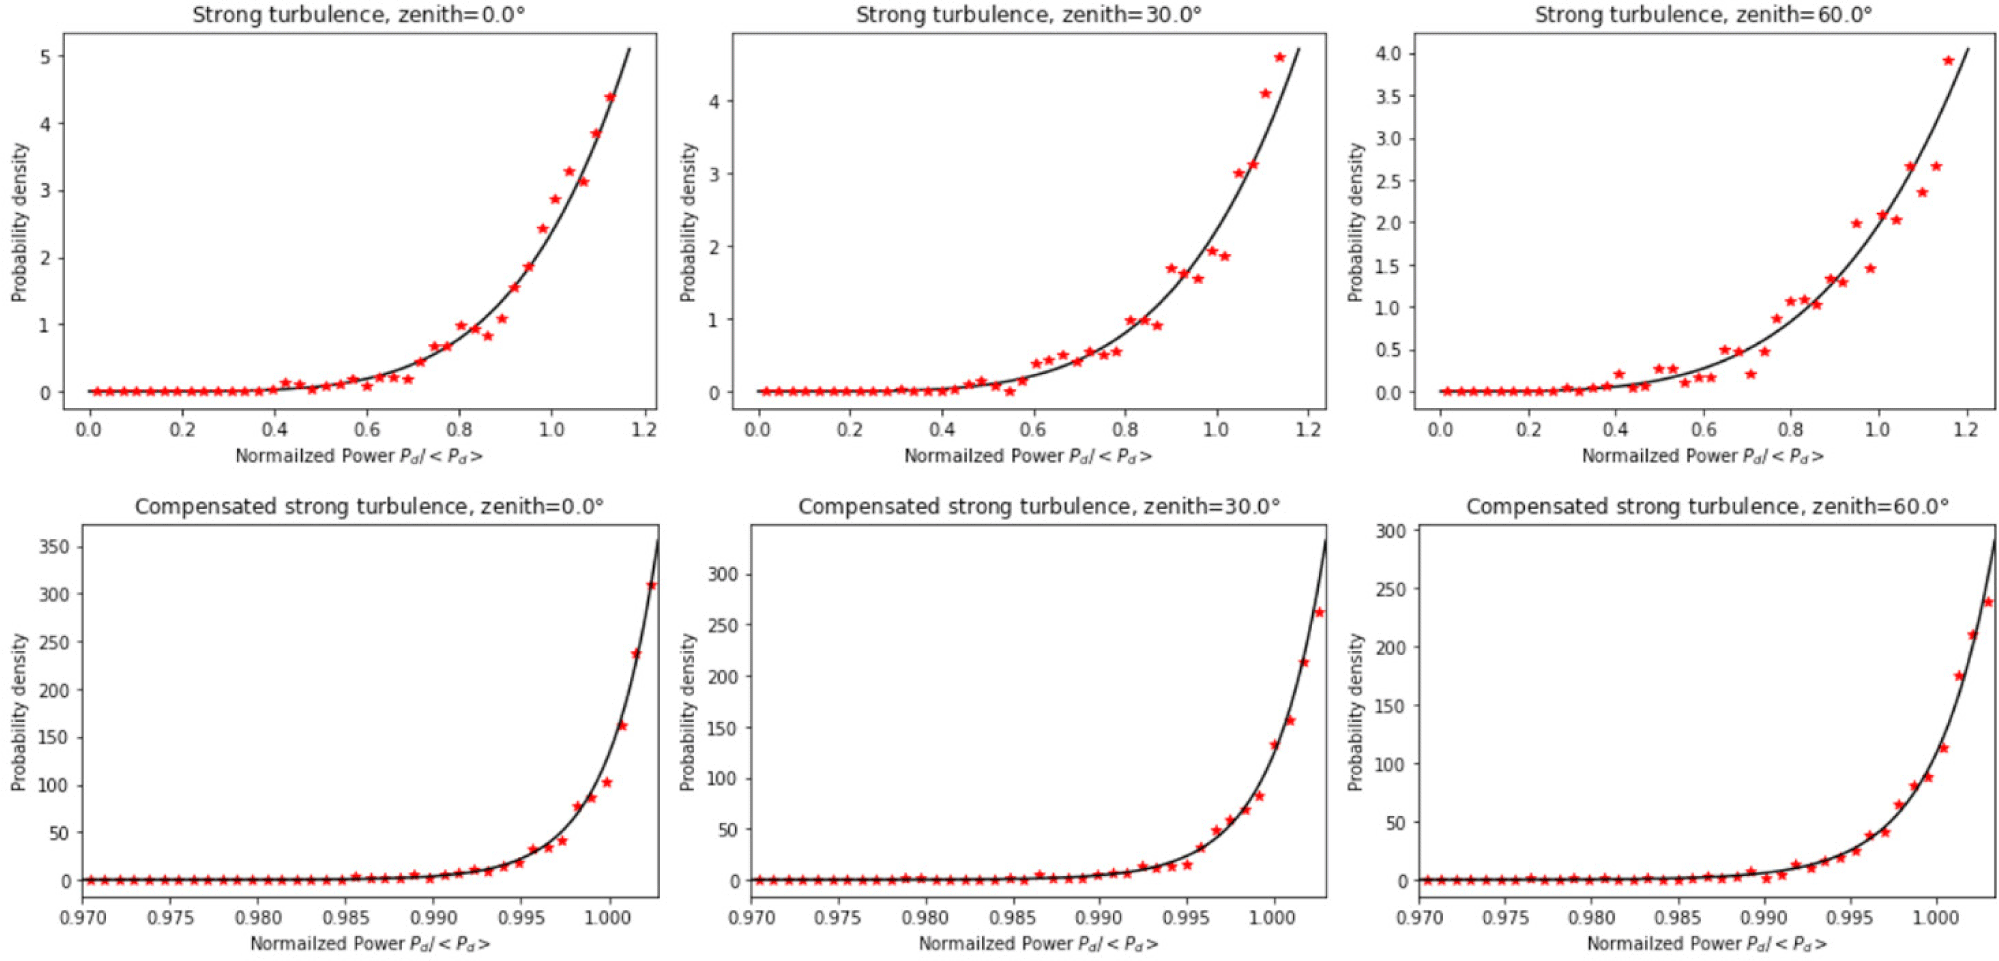
In Fig. 8, the solid black line represents the Rayleigh probability density for normalized power, and the red star-shaped points indicate the distribution from simulated results of normalized power fluctuation. The probability density distribution also confirms that significant reduction in the loss of the collected signal beam at the detector can be achieved through tip/tilt compensation.
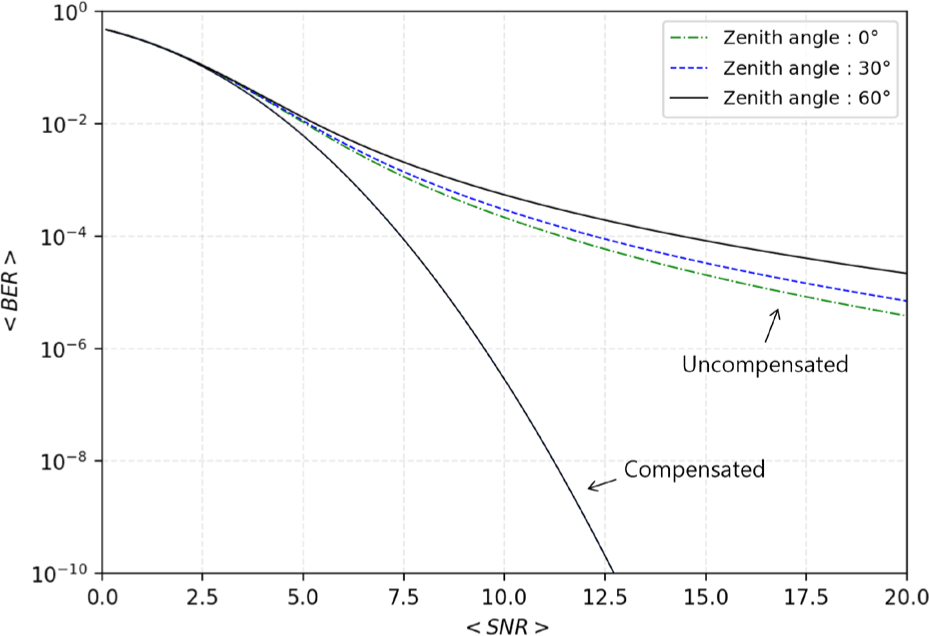
The performance of communication is quantified by the BER, which represents the ratio of error bits to the total transmitted bits. The BER depends not only on the modulation scheme used in communication but also on the received signal power. We have confirmed that tip/tilt compensation increases the probability of collecting power at the detector. This increase in received power for the beam can enhance the BER performance in communication systems using modulation schemes like on-off keying (OOK). The formula for calculating the average BER is as follows (Arpali et al. 2008):
where p(u) is the probability density of normalized received power u and erfc(·) is the complementary error function.
As seen in Fig. 9, it is evident that tip/tilt compensation alone significantly improves the average BER. The uncompensated results show, as expected, that the lower the zenith angle is, the better the average BER is. The compensated results exhibit consistent improvement in terms of average BER regardless of zenith angle variations. This appears to be a limitation of tip/tilt compensation, and to achieve even better results, the correction of factors not considered in this study may be required.
4. SUMMARY AND DISCUSIONS
In this study, we analyzed the effect of tip/tilt compensation in terms of the intensity of atmospheric turbulence. Laser beams propagating through the Earth’s atmosphere experience refraction due to atmospheric turbulence, resulting in AoA fluctuations at the receiver. This effect is more pronounced in the uplink scenario compared to the downlink. Furthermore, AoA fluctuations, along with the influence of receiver and transmitter jitter, contribute to image dancing on the focal plane. The effect of atmospheric turbulence was simulated for situations of weak turbulence and strong turbulence using the Hufnagel-Valley model, allowing us to estimate the displacement of beams on the focal plane. Additionally, we analyzed the variance of tip/tilt compensation, σtilt, to ascertain how effectively atmospheric turbulence can be compensated by using a tip/tilt mirror. It is shown that the tip/tilt compensation reduced significantly the tip/tilt error caused by atmospheric turbulence, approximately by 86.9% in the weak turbulence and by 87.1% in the strong turbulence. The remaining errors is analyzed to be resulted from the uncompensated terms of high-order aberrations in the wavefront.
Furthermore, we probabilistically calculated and simulated the power received by the detector both before and after tip/tilt compensation. We confirmed that the tip/tilt compensation increases the probability of power collected at the detector and also leads to improvements in the average BER.
We considered only the effect of beam wandering causing the AoA fluctuation to analyze the intensity variation affecting on the BER. But it is necessary to include the atmospheric attenuation and scintillation as well as high-order aberrations to analyze the performance of communication channel in the presence of atmospheric turbulence. The results obtained from this study will be utilized in establishing the PAT system at the GEOL station, for the satellite-to-ground laser communication.


