1. INTRODUCTION
In areas of low elevation near the lunar poles, known as permanently shadowed regions (PSRs), there is no direct sunlight due to the Moon’s low obliquity. Instead, these regions only receive indirect light reflected from the surrounding topography, which is much weaker (about two to three orders of magnitude less) than direct sunlight (Lucey et al. 2021). Secondary illumination (first reflection) is the main component of the indirect light (although there are higher-order components from multiple reflections) that lights up the interiors of PSRs and strongly moderates the local thermal balance. Because PSRs have very low temperatures (Paige et al. 2010), they are of great interest for scientific research and exploration as volatile molecules deposited from various sources (e.g., exogenic and endogenic) can remain cold-trapped over geologic time (Watson et al. 1961; Arnold 1979). High-resolution and high signal-to-noise ratio images of PSRs can be paramount in testing volatile sequestration hypotheses and planning future missions. PSR images depict morphology and the nature of the dynamic secondary illumination. Little is known about the meter or decimeter scale interaction of secondary illumination and morphology within PSRs, and the lack of high-resolution images hinders our ability to draw firm conclusions about the nature and distribution of polar volatiles.
The Shackleton crater PSR is a prime example of a region where high-resolution images may lead to a better understanding of the PSR surface conditions and the dynamic nature of secondary illumination that dictates the thermal conditions within the PSR. The south pole is located on the rim of Shackleton crater, and due to its location and depth (~4.2 km), the floor and most of Shackleton’s inner walls are in permanent shadow, resulting in temperatures constantly below 120K (summer high) and reaching as low as 40K (winter low). The Shackleton PSR satisfies the temperature conditions required for a cold trap. While average temperatures below 90K are conducive for volatile retention, albedo signatures obtained at Shackleton PSR (wall and floor) from prior missions are not conclusive for exposed ice (Haruyama et al. 2008; Zuber et al. 2012), although the interior of Shackleton has a higher normal albedo than its surrounding non-PSR terrain and interior of non-PSR craters. When jointly analyzed with topography, the Lunar Orbiter Laser Altimeter (LOLA) 1,064 nm measurements indicate that the floor of Shackelton has higher normal albedo that is typical of PSRs with high slopes (Lucey et al. 2014).
Before 2022, only a few images of the Shackleton PSR existed, including Lunar Reconnaissance Orbiter Camera Narrow Angle Camera (LROC NAC), long-exposure images (Robinson et al. 2010; Koeber et al. 2014) and Kaguya TC images (Haruyama et al. 2008) that could add high-resolution morphological details at regions of anomalous contrast (relative brightness in radiance calibrated images). However, these images were acquired only over a few illumination conditions and were strongly contaminated with stray light that can interfere with conclusions about surface reflectivity. Further, relative brightness estimates made over large pixels can potentially merge contiguous subpixel regions of varying bright and dim patches originating from secondary illumination by multiple sources. Finally, illumination varies dynamically within a PSR and can be better studied with a sensitive camera and longer-term PSR focused imaging mission.
On 30 December 2022, ShadowCam, an instrument onboard the Korean Pathfinder Lunar Orbiter (KPLO, also known as Danuri) satellite, acquired the first-ever high-resolution image of Shackleton PSR at the wall and floor. The overarching goal of the ShadowCam imaging campaign is to acquire high-resolution images at the PSRs to create maps for scientific analysis and exploration. The ShadowCam design is based on the LROC NAC, but optimized for imaging PSRs. It is specifically designed to capture images of dimly illuminated terrain (200 times more sensitive) surrounded by brightly lit areas, thus it is five times more efficient in rejecting stray light. Details of the ShadowCam instrument design are covered in Robinson et al. (2023).
Due to the KPLO polar orbit and the south pole being on the rim of Shackleton crater, numerous observations of the Shackleton PSR were obtained during the south pole summer of 2023. Shackleton is a relatively large PSR, and a single ShadowCam image at the nominal mission orbit radius (~100 km) can only capture approximately one-third of the PSR. Also, the complete cycle of changing illumination conditions is 18.6 years (the lunar synodic cycle), much longer than the KPLO mission, making it impossible to capture completely the temporal illumination variation with ShadowCam. To characterize long-term temporal behavior and better understand the context for image radiances measured by ShadowCam, we also model the secondary illumination for the Shackleton PSR. In our recent work (Mahanti et al. 2022), we devised an observer-independent, generic method to simulate the secondary light irradiance that relies solely on topography and the subsolar point. We have previously validated our approach by using LROC NAC long exposure images and the first ShadowCam image, which was of Shackleton’s pole-facing wall. Here, we jointly utilize ShadowCam images and our modeling efforts to characterize the seasonal illumination within the Shackleton PSR.
2. DATA AND METHOD
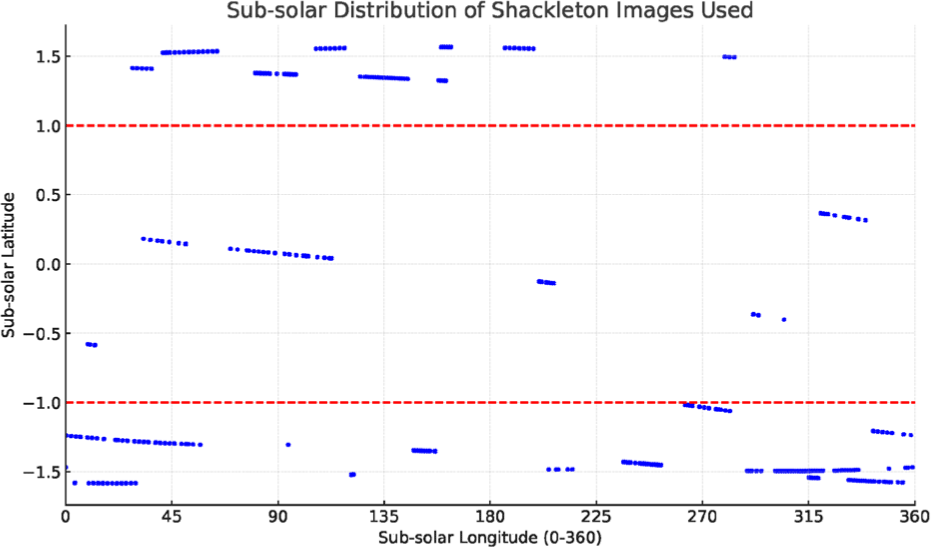
Over the period 30 December 2022 to 30 August 2023, ShadowCam acquired 282 images covering the floor of the Shackleton crater. Of these, 155 images span the south pole summer (subsolar latitude (sslat) is less than –1°), and 79 images were acquired for the south pole winter (sslat > 1°). We used all of these images for radiance statistics (Also see Appendix Fig. A1 and Table A1). Images that were part of an experiment demonstrating smear as a function of incorrect line time, acquired during the commissioning phase, were manually examined and eliminated if the smear was significant.
Our calibration procedure converts raw image digital numbers to radiance (W/m2/μm/sr). Details of radiance calibration is discussed in Humm et al. (2023); the main steps include decompanding, subtraction of bias and dark current, gain correction, and normalization by the flat field (non-uniformity matrix), and the conversion to radiance.
The secondary illumination (irradiance, W/m2) originates from the primary solar illumination reflected from nearby topography into a PSR. The magnitude of secondary illumination within a PSR strongly depends on the orientation and distance between topographic facets that exchange energy via radiative transfer (Cohen & Wallace 1993). The interaction is encoded in view factor (or form factor), a geometric relationship that defines the fraction of the energy that leaves a directly illuminated topographic facet and travels toward a PSR topographic facet.
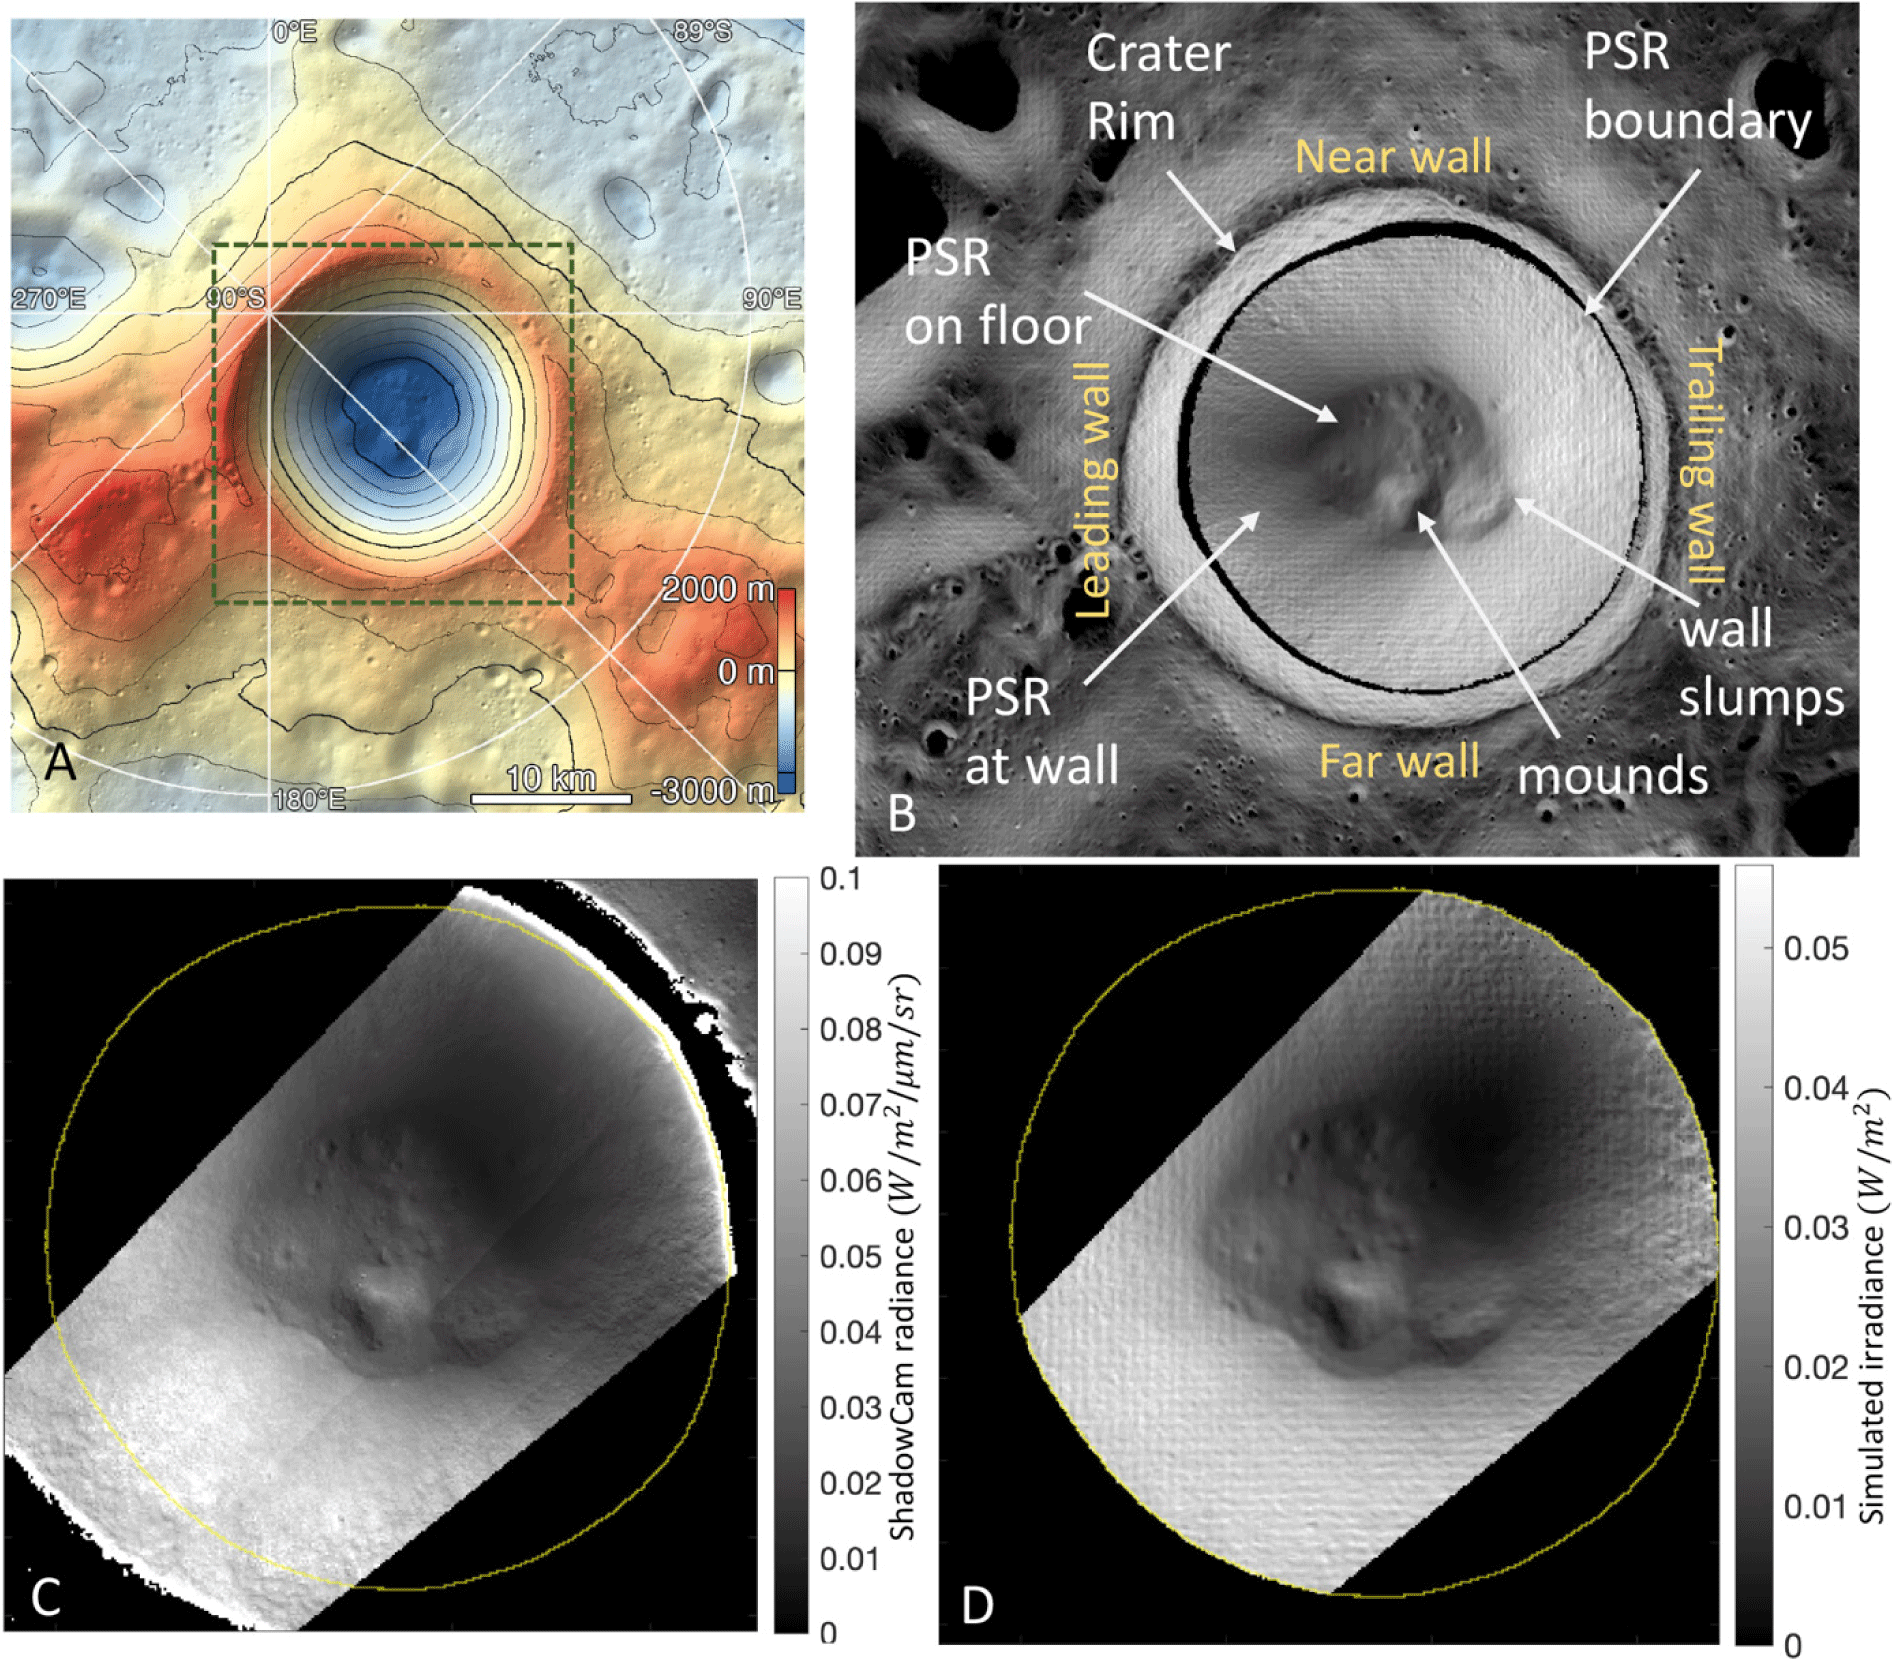
Before calculating the secondary illumination, selecting the map area for computation is essential; the map area must cover all significant topography that can reflect light into the PSR. In the case of deep craters such as Shackleton, the line of sight from within the PSR is mainly limited to the crater rim, and all secondary illumination originates from within the crater wall just below the rim. For Shackleton, the selected map area encompasses the crater’s outer rim and is approximately a 25 km × 25 km square region-of-interest (ROI) centered on Shackleton PSR (Fig. 1(A)).
Modeling the secondary illumination requires a digital elevation model (DEM) corresponding to the map area and a shapefile that delimits the PSR. The following procedure is applied to obtain the secondary illumination irradiance map for a given time:
-
Compute the view factor maps for all pixels within the PSR.
-
Compute the primary illumination map (in irradiance units) P(x, y, t) for time t, using the cropped DEM of the map area and the DEM of the south pole (out to 80S) as inputs.
-
Compute the secondary illumination map for PSR (in irradiance units) for time t, using the primary illumination map P(x, y, t) and the view factor maps as inputs. We assume a fixed albedo of 0.1 and Lambertian photometry for simplicity.
We generated two sets of secondary illumination maps for this work. The first set covers the imaging times of the ShadowCam images selected for analysis. The primary and secondary maps derived from these times enable a comparison of the model irradiance to the observed radiance from the corresponding ShadowCam image.
We generated a second set of secondary illumination maps that cover a complete lunar nodal cycle. The subsolar latitude cycles seasonally over a draconic year and varies over the 18.6-year lunar nodal cycle, while the subsolar longitude cycles diurnally over a lunar day or 29.5 Earth days. Our seasonal illumination model for Shackleton is not explicitly dependent on the Earth calendar. Instead, we generate illumination maps over a grid of subsolar latitude and longitude values to serve as a reference for the variation of illumination with time. The subsolar latitude (sslat) ranges from ±1.59° for the Moon at 0.1-degree intervals, and the subsolar longitude (sslon) ranges from 0° to 350° at 10-degree intervals. From the second set, a secondary illumination maximum map (each pixel is the maximum irradiance over the entire nodal cycle) and summer and winter average irradiance maps (each pixel is the average irradiance for the season) are generated.
We segmented the study area into three regions: the non-PSR wall between the crater rim and the PSR boundary, the crater wall within the PSR, and the crater floor (wholly within the PSR) that includes a relatively smooth melt over which there are positive relief features resulting from wall slumps (Fig. 1(B)).
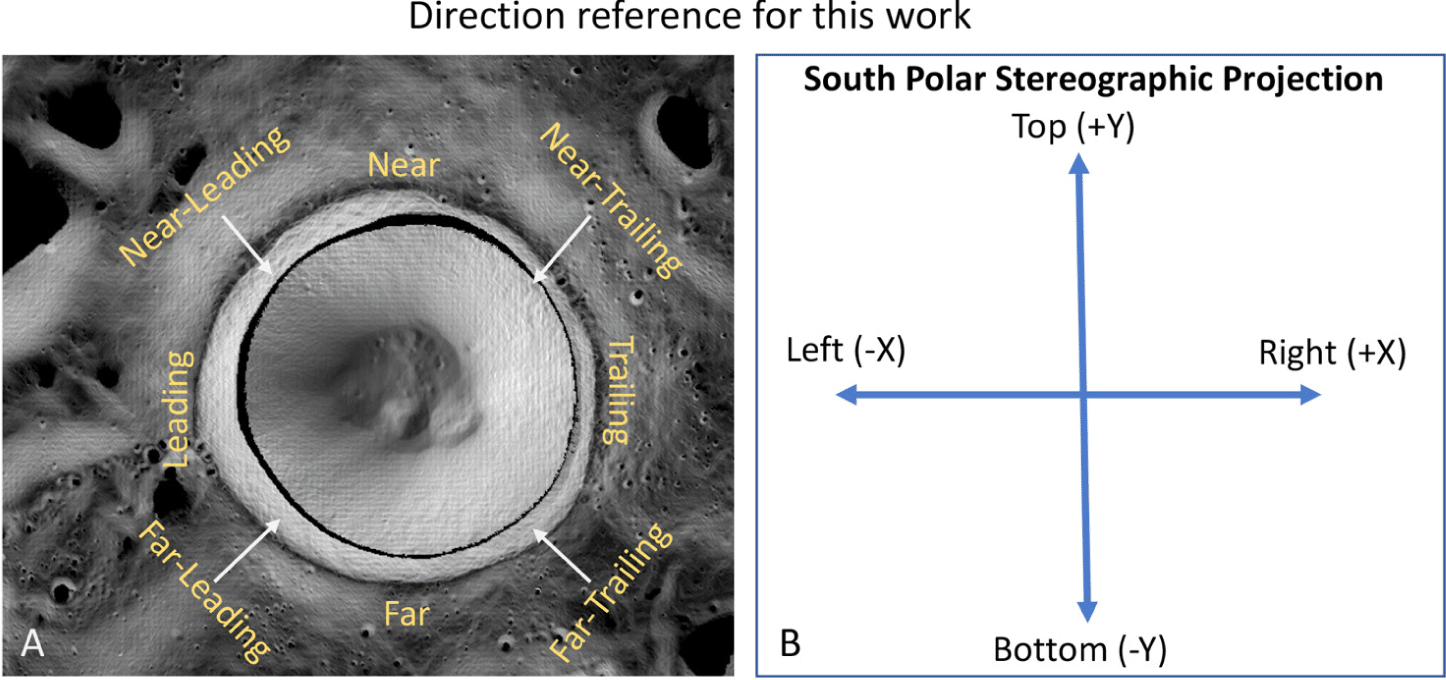
The secondary illumination follows a diurnal cycle, and its peak closely follows that of the primary illumination, with some moderation from topography. As the position of the Sun changes, the primary illumination area moves counter-clockwise around the crater. In this work, our discussion is limited to the map area (Fig. 1(A)). To discuss direction, we use the convention near/far/trailing/leading for up/down/right/left respectively in a standard south polar stereographic projection (Appendix Fig. A2). In this description near (up) indicates towards Earth, far (down) indicates away from Earth, leading (left) indicates the leading hemisphere of the Moon and trailing (right) indicates the trailing hemisphere of the Moon. The corresponding walls of Shackleton are also marked as near/far/trailing/leading (Fig. 1(B)). Consequently, a combination of near/far and leading/trailing will be used to describe directions in-between. For example far-trailing wall indicates the wall region between the trailing and far walls.
In the following discussion, bright indicates higher relative radiance (W/m2/μm/sr) in the context of ShadowCam radiance calibrated images and higher relative irradiance (W/m2) in the visible wavelengths in the context of secondary illumination. Unless stated otherwise, relative brightness does not indicate higher reflectivity, or albedo.
3. RESULTS AND DISCUSSIONS
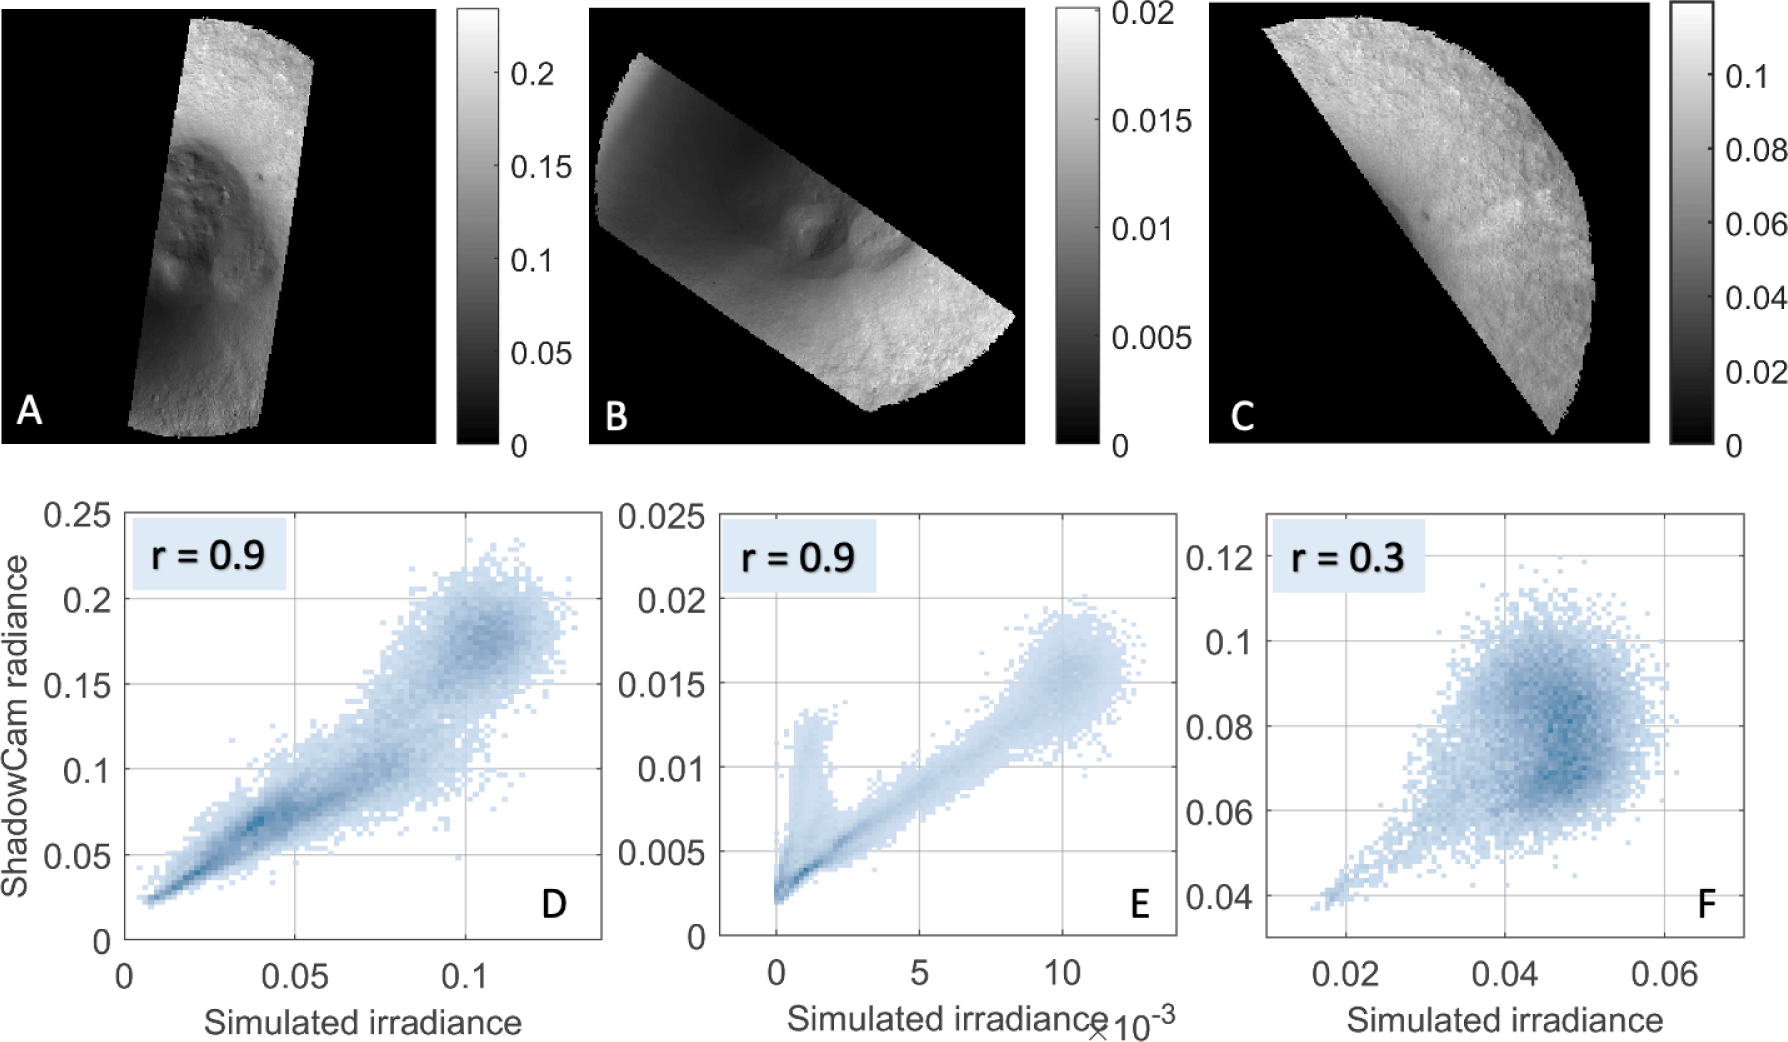
ShadowCam images (radiance units) and modeled secondary illumination images (irradiance units, at the same subsolar point) exhibit similar spatial contrast (Fig. 1(C)) is a mosaic of two ShadowCam images, and Fig. 1(D) is a synthetic image for the same subsolar point). The spatial correlation computed between ShadowCam images and synthetic images shows large values (and the scatterplot shows linear behavior, Fig. 2) of the correlation coefficient for most Shackleton PSR images (N = 282). The median correlation coefficient is 0.9 (mean = 0.8, standard deviation = 0.2). At higher signal levels, the correlation is high; more than 85% of images with mean radiance above 0.05 have r > 0.8 (Fig. 2(A) and (D)). A large (> 0.8) correlation is also observed for images with low average signal levels (0.02 < mean radiance < 0.05; Fig. 2(B) and (E)). At even lower signal levels (mean radiance < 0.02), the correlation is generally lower (average correlation across images is ~0.6) and the correlation coefficient has a larger standard deviation (0.3 compared to 0.1 for mean radiance > 0.02). The correlation coefficient does not show a significant dependence on subsolar longitude. With subsolar latitudes > 0.1, i.e., south pole winter, the secondary illumination magnitude is low, affecting the correlation. Low correlation can occur with high signal levels when the ShadowCam image exhibits albedo contrasts; our model assumes uniform albedo. Examples include regions of the PSR wall where bright patches can be seen against darker background in ShadowCam images but not in simulated secondary illumination images (Fig. 2(D) and (F)). Note that the correlations were computed between simulated irradiance (from 60-m pixel topography) and ShadowCam images downsampled to 60 m, so some loss of correlation is expected. Further, we only model secondary illumination and not illumination reaching the PSR after multiple reflections (higher-order illumination).
The primary and secondary illumination generated by the model is in irradiance units (W/m2). A conversion coefficient (β) was derived from the ratio of the ShadowCam radiance and simulated irradiance, enabling a comparison between modeled irradiance and measured radiance. Note that we provide an estimation of β for completeness only. Detailed analysis, and use of the estimated β is outside the scope of this work.
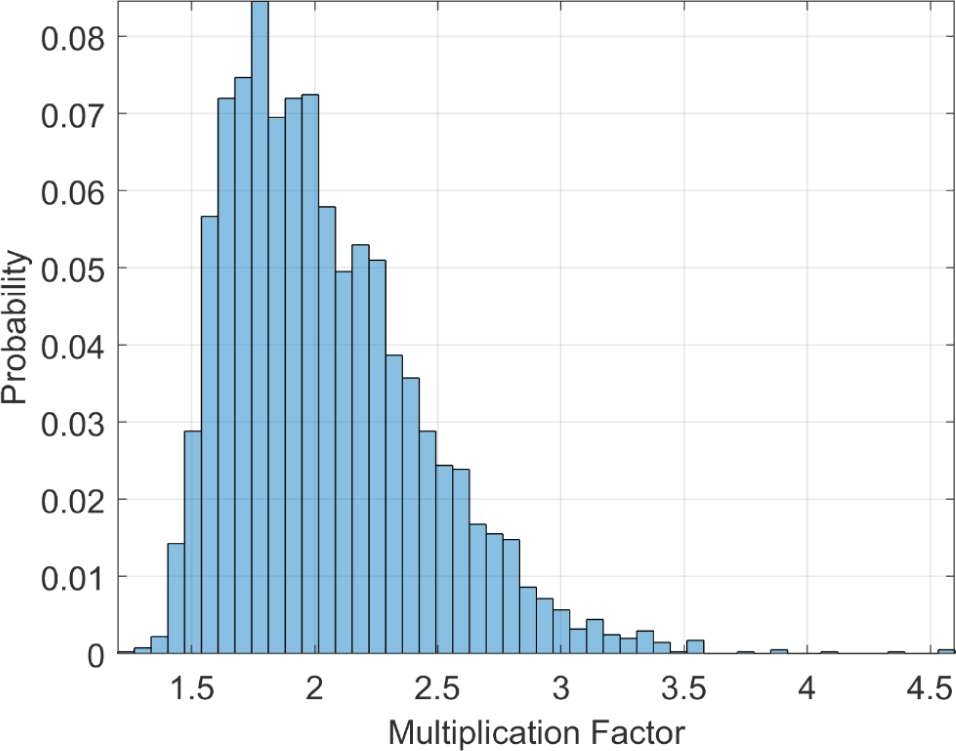
Variation of β is due to albedo (model assumes constant albedo) variations at the primary and reflection points, uncertainty in the photometric function, and the smoothing effects of low-resolution topography. β is also affected by multiple reflections (higher-order illumination) that are not part of our model. To minimize these effects, we first obtain the median β(x, y) from all pairs of ShadowCam and simulated images for the same PSR pixel (x, y). This procedure is repeated to obtain β(x, y) at all PSR pixels and generate a probability distribution (Appendix Fig. A3). with the highest probability chosen as the overall multiplication factor. For the ShadowCam images considered here, β ~1.8(± 0.4) Note that only selected images with mean radiance levels above 0.01 were used to minimize outliers while obtaining statistics from ratio images.
Shackleton Crater (Fig. 1(A)) is a well-preserved simple crater located on the northern slope of an irregular massif. Its diameter is 21 km, and its formation age is estimated to be 3.6 billion years (Spudis et al. 2008). The crater rim is irregular, the trailing rim is about 800 meters lower than the leading rim, as observed from an averaged horizontal (left-to-right) elevation profile (Fig. 3(A) and (B)). The near rim is also lower than far rim, but only by ~100 m. The skewed topography results from the pre-impact surface which includes a ridge that extends from Shackleton to de Gerlache and a massif to the far-trailing side of Shackleton.
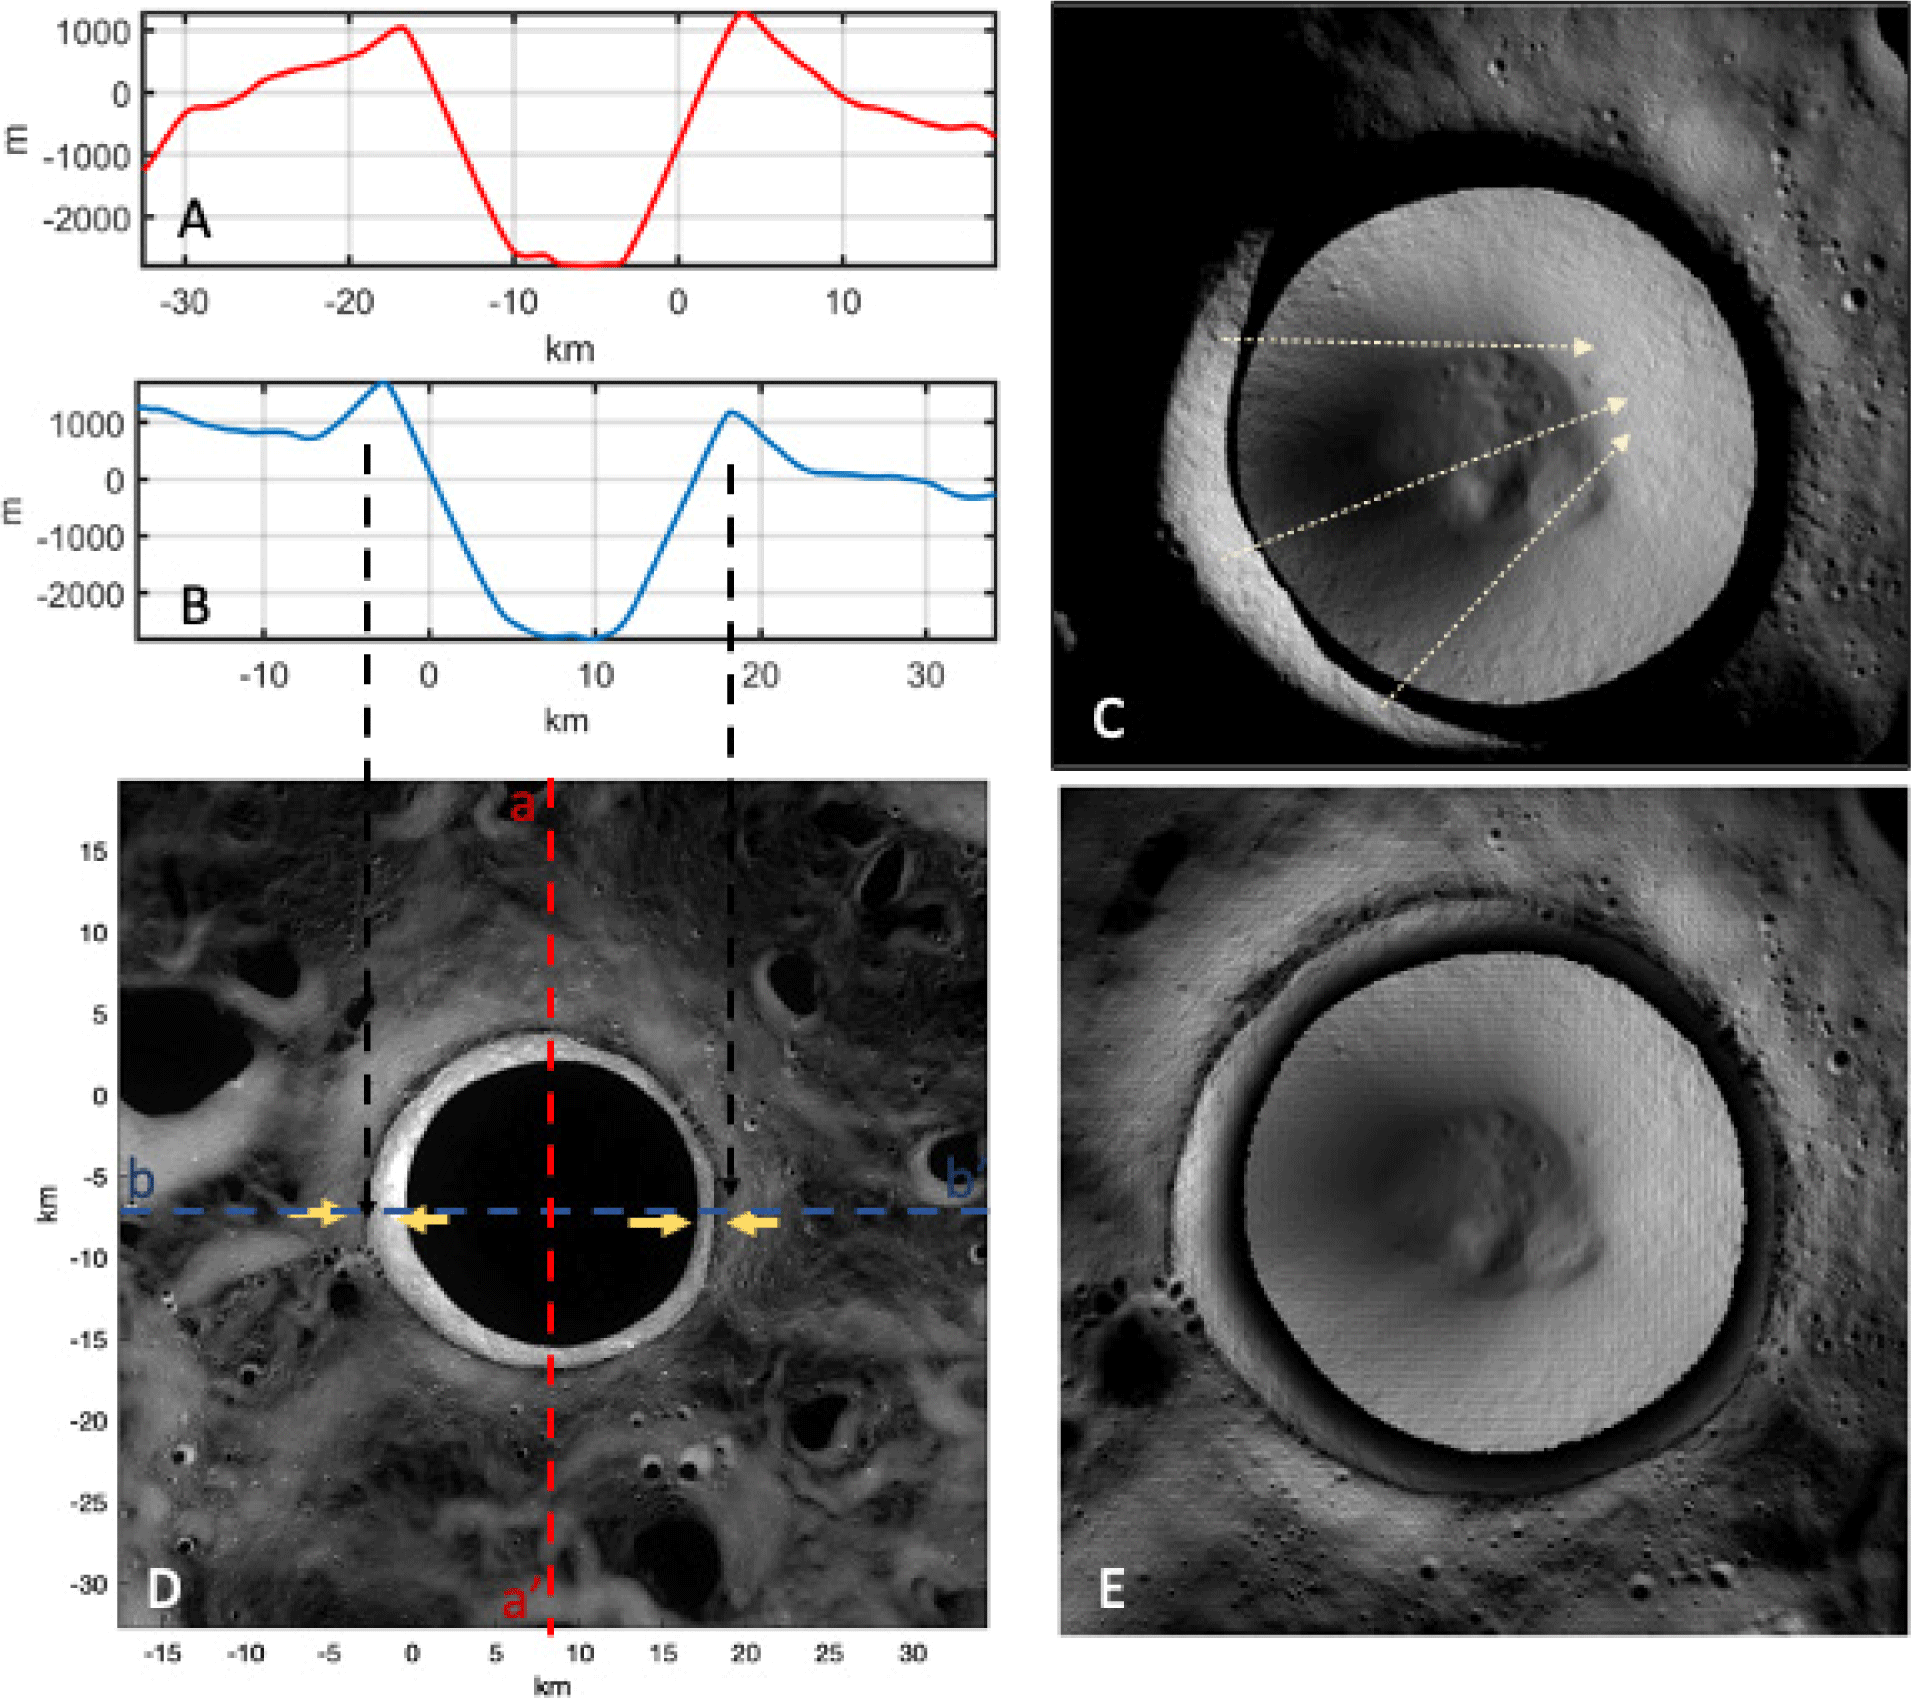
The uneven topography of the Shackleton rim results in asymmetrical primary illumination within the crater, evident in images when the Sun is shining from the left (leading) direction, where only a small portion of the interior trailing wall is lit compared to when the illumination is from the right (trailing) direction, where a larger fraction of the interior wall is lit (see Fig. 3(C)). The longer-term effect of this asymmetry is documented in a 14-year time series acquired with the lunar reconnaissance orbiter camera wide angle camera (LROC WAC; see Fig. 3(D)). A greater number of brightly lit pixels occurs on the leading wall between the PSR boundary and the crater rim, as compared to the opposing side.
During all seasons, the interior leading wall receives more sunlight than the interior trailing wall, resulting in uneven secondary illumination of the interior. The trailing (left) side of the PSR experiences higher values of secondary illumination, while the floor and left (leading) side of the PSR have lower values. During winter, the Sun is lower above the horizon so both inner leading and trailing walls are barely illuminated, resulting in a reduction of scattered light reaching the PSR interior. Overall, the leading wall contributes more secondary illumination to the PSR regions in Shackleton over the entire year.
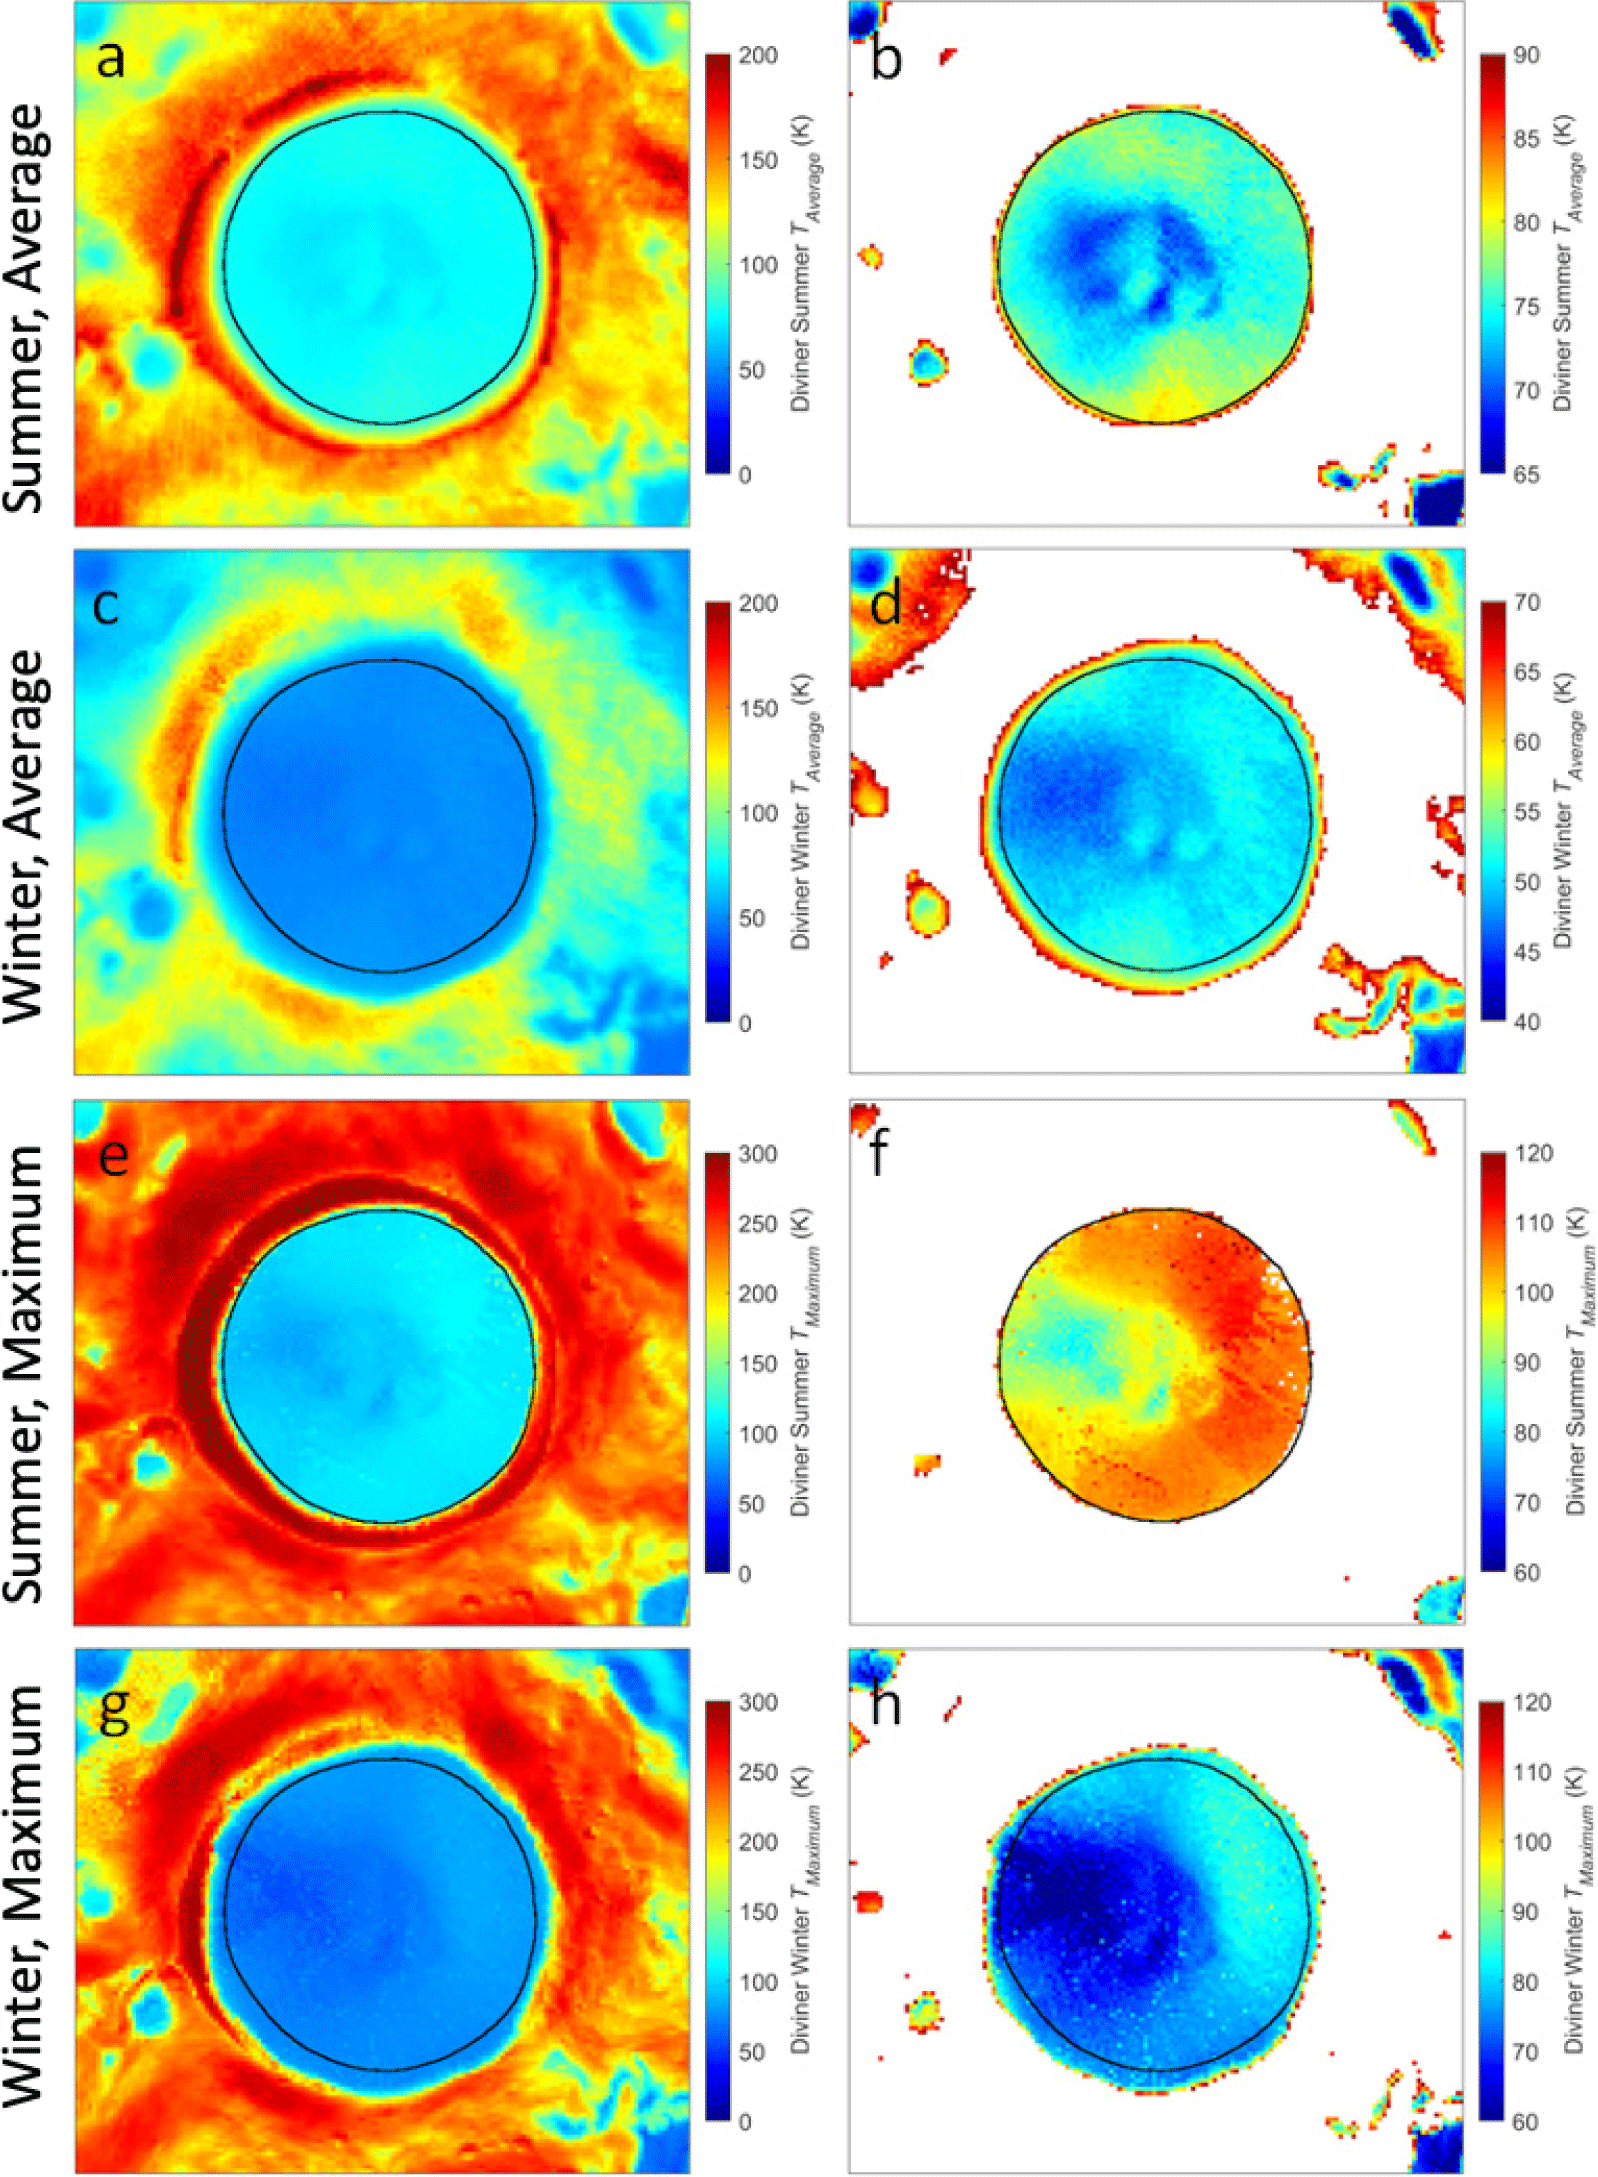
Consequently, the average secondary illumination map (Fig. 3(E)) shows higher values towards the trailing (left) side of the PSR wall and floor. The secondary illumination irradiance received during summer (sslat < –1°) at the trailing wall is 150% more than the PSR floor and 230% more than the relatively dimmer region on the left (leading) floor and wall (Fig. 3(E)). This effect is evident in the left vs. right temperature asymmetry in the average temperatures observed by the LRO Diviner instrument (Williams et al. 2019). Average temperatures are observed to be several K higher on the trailing wall relative to the leading wall. The maximum temperatures differences are more pronounced with the trailing wall being as much as ~10–20K warmer than the leading wall. Similar variations in average and maximum temperatures (few K to 10–20K respectively) occur on the floor as well due to the topographic variations (i. e. mounds and wall slumps) that result in additional slope effects and shadowing of the secondary illumination (see section 3.4 and 3.5 below) (Appendix Fig. A4).
The peak secondary illumination follows the subsolar latitude and decreases exponentially from peak summer to peak winter (Fig. 4(A)). However, during winter, secondary illumination is dimmer and present for less time — less than half of the diurnal cycle (sslat > 1°).
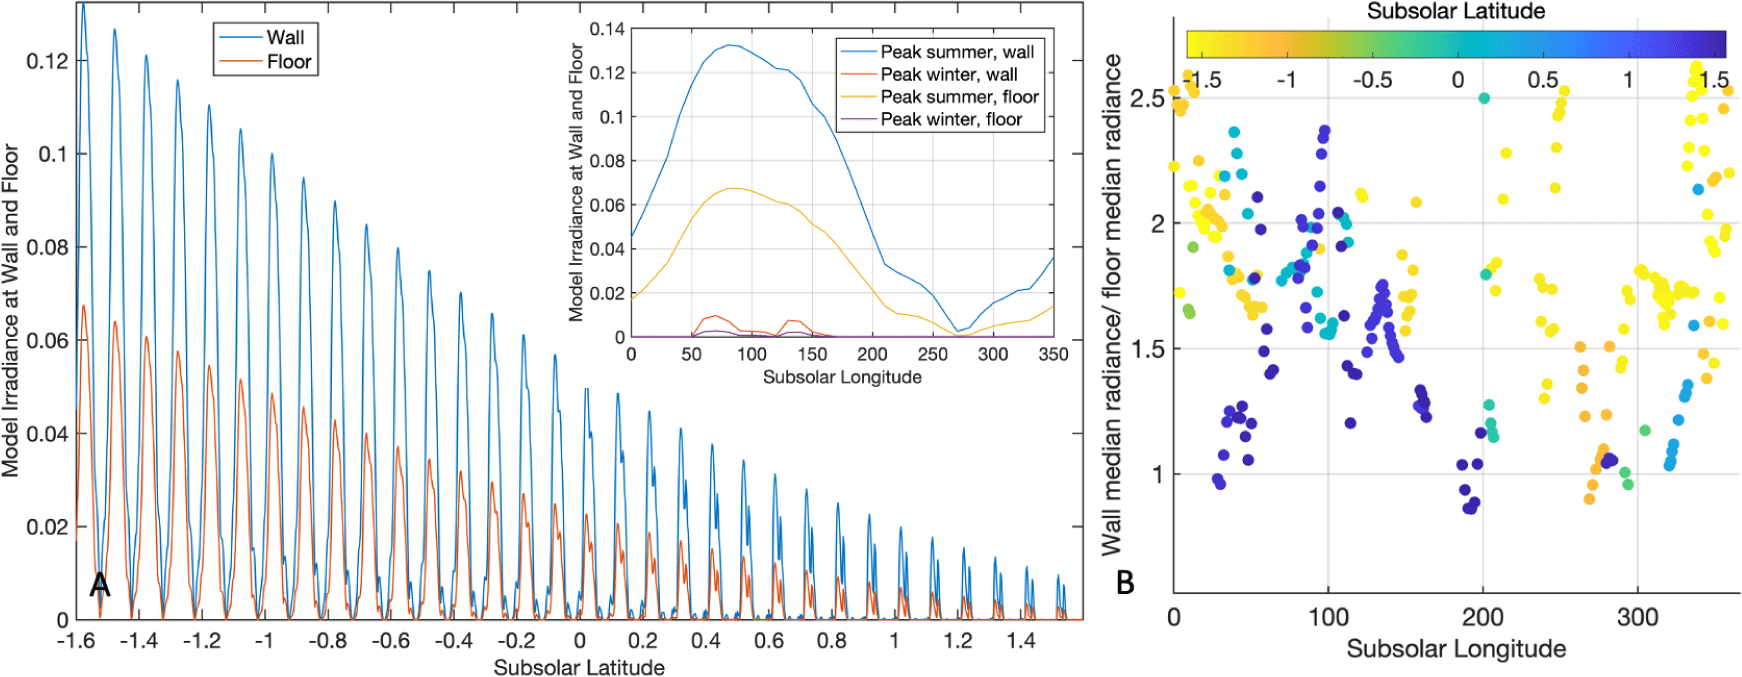
During summer, the peak secondary irradiance occurs approximately at sslon ~90° (approximately noon at Shackleton- the sun azimuth is perpendicular to the tallest crater wall), and secondary irradiance is briefly zero approximately at sslon ~270° when the Sun is briefly blocked by the leading wall topography. Between 260° and 270°, a very thin sliver of primary illumination is present at the trailing/ far-trailing wall and results in small values of radiance on the floor. Between sslon 270° and 359°, the magnitude of primary illumination increases (from ~0° at 270°) at the far/ far-trailing wall, but only during summer (sslat < –1°). This happens due to the small difference in rim height between the near-rim and far-rim (near-rim lower, Fig. 3(A)) and the Sun being at a higher position. During winter, secondary irradiance is only present between subsolar 45° and 170° with smaller peaks than in summer at ~70° and 130°. Note that while the magnitude of illumination is less, the illumination changes more often during winter at the PSR because the single irradiance peak (during summer) splits into two much smaller peaks.
Peak secondary irradiance received at the walls is approximately twice that received at the floor during summer and 2X to 3X during the winter (Fig. 4(A)).
The analysis presented here is based on eight months of ShadowCam observations of Shackleton’s interior and include south pole summer (155 images at sslat between –1.3° and –1°), 45 images between summer and winter (–1° < sslat < +1°), and 79 images obtained during south pole winter (sslat > 1°). The subsolar longitude range is not uniformly covered, and most of the observations occur with sslon < 70° and > 230°.
The trailing wall has higher irradiance values than the leading wall due to asymmetry caused by topography. A maximum radiance mosaic computed for Shackleton (value in each square pixel of 60 m side represents the maximum radiance from any ShadowCam image for that pixel on the ground) shows that the maximum radiance for the trailing wall varies between (0.11) and (0.35), with an average of (0.21). These values are larger than those at the leading wall, where the maximum radiance varies between (0.05) and (0.35) with an average of (0.17). It is expected that the trailing wall will have a larger maximum radiance, but ShadowCam has not yet acquired images of the trailing wall at subsolar latitudes < –1.3 and subsolar longitudes between 80° and 110°. The simulation predicts that the highest irradiance will be at the trailing wall during these times.
From the ShadowCam images, the ratio of median radiance (from portion of wall vs portion of floor in image) varies between one and three and averages two (Fig. 4(B)), with higher ratios during summer and lower ratios during winter when the secondary illumination signals are low both for the wall and the floor. The increased brightness of the walls compared to the floor can also be seen in average and maximum radiance mosaics (Fig. 5(A) and (B)) for the PSR, where the average or maximum statistic is obtained over the same pixel across multiple images. Wall averages and maximums are higher than floor averages and maximum values, respectively (Fig. 5(C)).
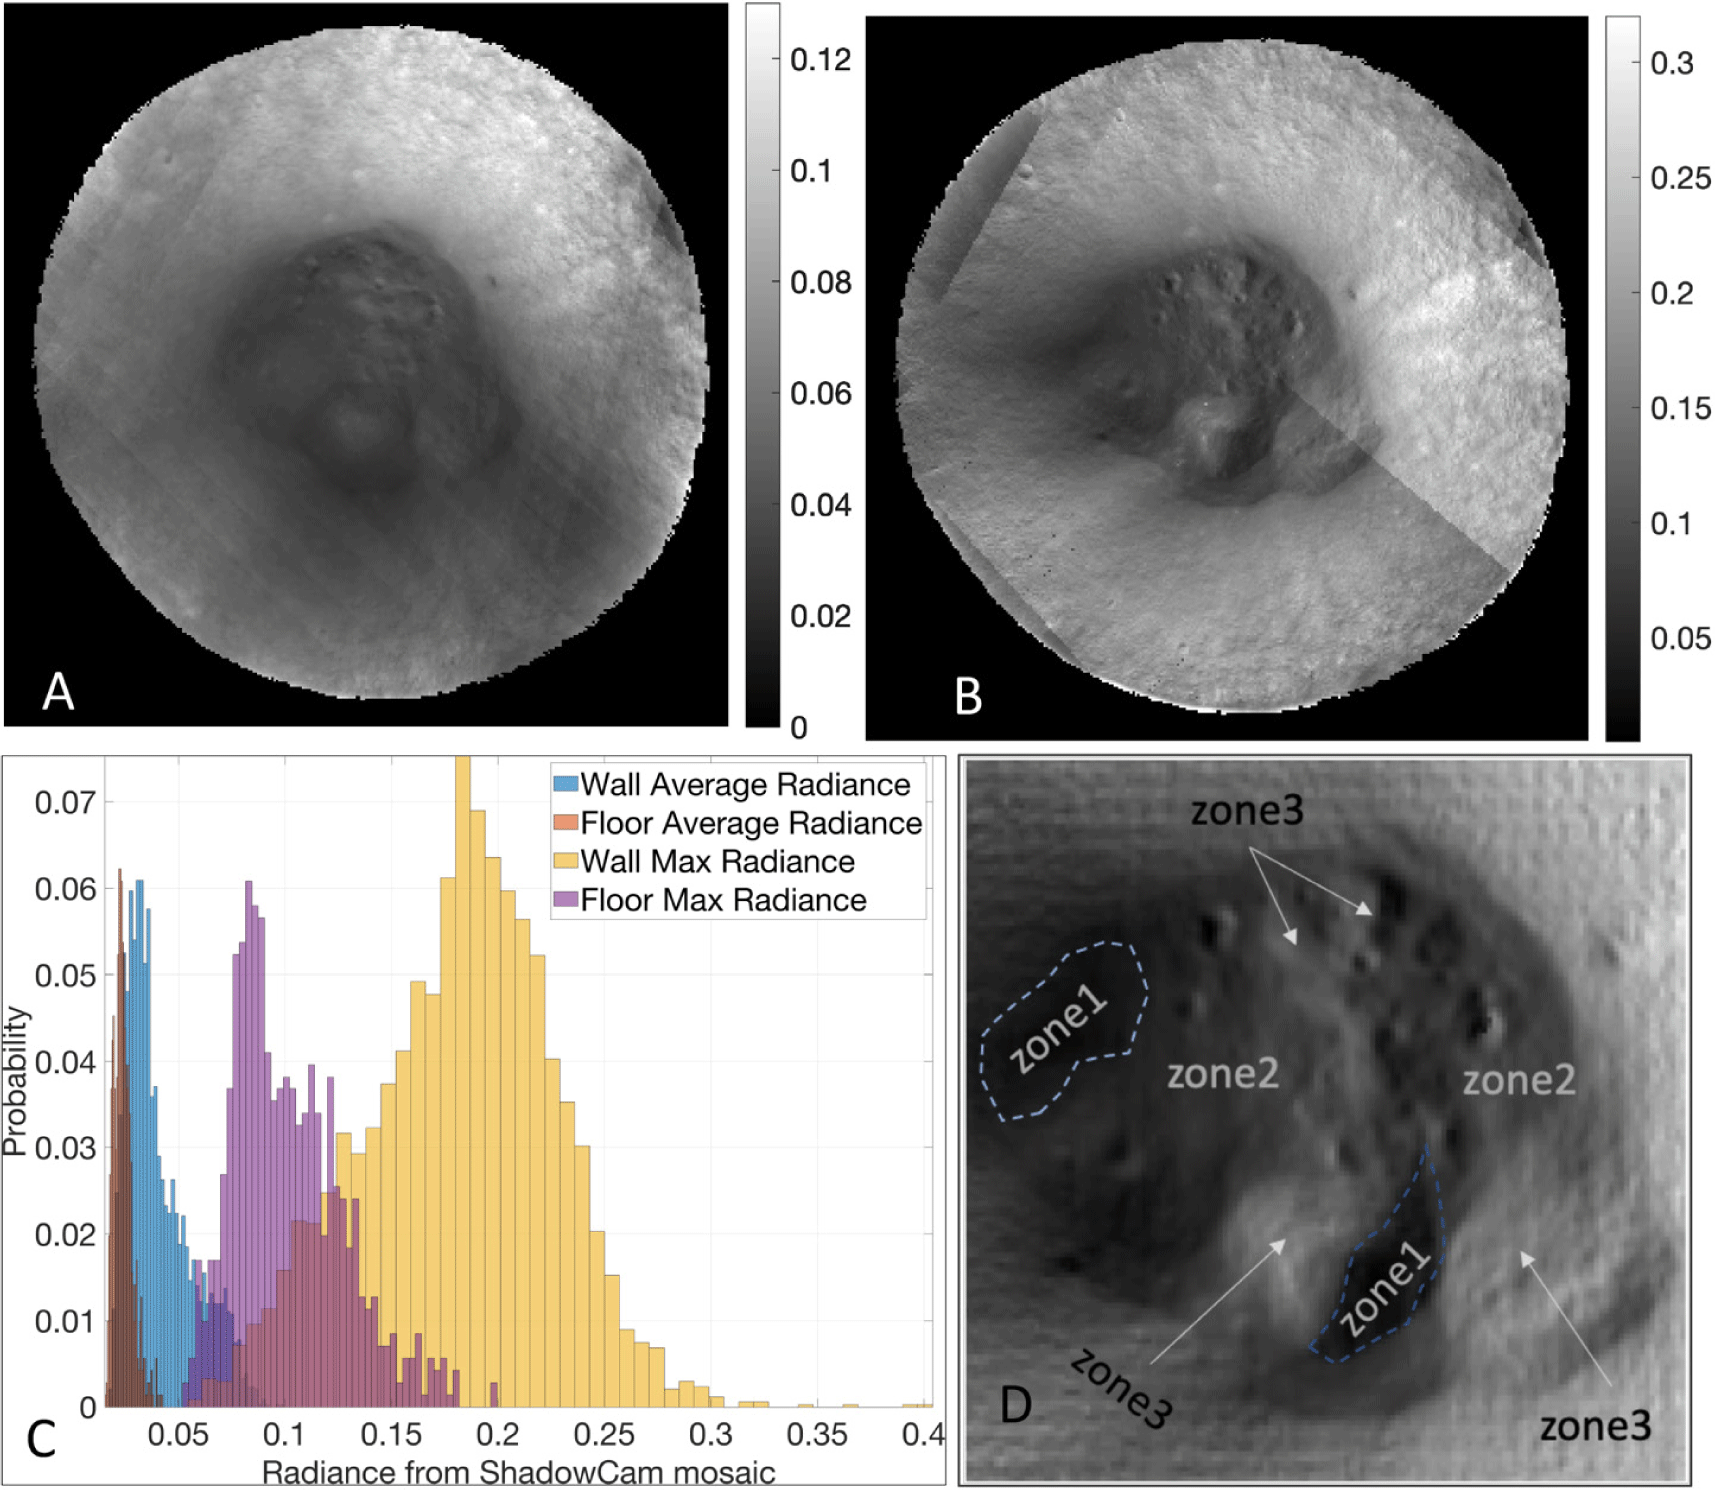
The brightness of the walls compared to the floor remains consistent from summer to early winter when signal levels are high. However, this preliminary analysis does not include the estimated reflectivity. This aspect will be covered in the upcoming investigation as more images are acquired. Analysis of Kaguya Terrain Camera image (Haruyama et al. 2008) reported pronounced surface activity and bright streaks on the trailing wall of Shackleton. We have confirmed that the brightness streaks exist all around the PSR wall of Shackleton and can be seen in our maximum mosaic. The steep wall slopes exacerbate the downslope movement of loose regolith, which may originate from vibration due to nearby impacts or seismic shaking, leading to continuous resurfacing at the walls. The downslope movement of the regolith can also be responsible for the wall texture observed in ShadowCam images.
The crater floor secondary illumination is patchy and moderated by the topography of the floor. The floor exhibits large (750 to 2,250 m diameter range) hummocky deposits (mounds) interpreted as material slumped from the walls – a morphology seen in other lunar craters of similar size and age (e.g., Hipparchus G, D = 15 km, Imbrian age; 5.03°S, 7.40°E). The largest mound exhibits > 200 m of relief and is smooth and devoid of small craters (slopes on the mound are > 20 degrees). The top of the largest mound in the bottom, fan-shaped hummocky structures to the near ward direction, and the wall slump in the bottom-right are bright (summer average radiance > 0.03). These elevated features also contain loose rocks, most of which appear to have been excavated due to smaller impacts and associated surface processes.
In all ShadowCam radiance calibrated images, the floor has lower average radiance values compared to the wall. But the floor is not uniformly dark and specifically, elevated regions of the mounds are brighter than other regions on the floor in both the simulated irradiance images and the ShadowCam radiance images. From the simulated secondary illumination maximum map, we divided the patchy floor into three zones based on the contrast (dim, moderate, and bright) from the simulated irradiance (Fig. 5(D)). Zone 1 occurs in two areas, one straddles the largest floor mound, and the other is at the left (leading) end of the floor near the wall. The maximum observed radiance value for Zone 1 is ~0.1 (median = 0.02). Zone 2 covers the generally flat central floor, which exhibits intermediate radiance values (maximum ~0.2, median 0.03). Most of the impact craters are found in this zone. Zone 3 has the highest secondary illumination, observed radiance (maximum 0.24, median 0.03) and also represents the highest floor topography (summits of the floor mounds and the deposits near the trailing wall), and blocks are common (> 5 m diameter). We hypothesize that much of the brightness associated with Zone 3 is related to the higher irradiance received (more dependent on topographic slope than maturity or composition). Note however, that Zone 3, still has a lower median radiance compared to the trailing wall and is gets smaller magnitude of secondary illumination. Illumination geometry not yet covered by ShadowCam images might increase the radiance statistics, but the relative ranking of the zones is not expected to change.
Apart from the floor classification based on irradiance, as discussed above, there are some areas where the secondary reflected illumination is partially blocked for a large part of the diurnal cycle. Such areas include the trailing (left) side of the floor mound near the smooth deposit (part of Zone 1) and crater interiors on the floor with restricted viewsheds.
Secondary (and higher-order) illumination varies with time and is diffuse owing to its origin from a broad range of angles. Shadows, contrast, and texture from the secondary illumination differ from those created on lunar surfaces via direct illumination. The primary illumination does not light up the interior crater wall uniformly; the wall texture, curvature, and possible localized variations in albedo create heterogeneous diffuse lighting (in contrast to ideal diffuse lighting). Hence, while the shadows are typically softer, some areas in ShadowCam images can have sharp boundaries at transitions between brighter and dimmer zones.
One example of brightness variations with the directionality of secondary illumination occurs on the trailing wall, where brighter units (patches and streaks in ShadowCam images) can be seen against a darker background. At a rectangular area of interest (Fig. 6), where prominent bright streaks are observed on the trailing wall, the radiance is compared between the bright material and the darker background. For our analysis, the surface units (pixel locations) corresponding to brighter radiance are identified within the area of interest from a single image during summer (M012728826S), when the calibrated radiance for a pixel is > 0.29. Other pixels within the area of interest are considered part of the darker population. On average, the radiance of the brighter pixels is ~20 % higher than the darker background during summer (radiance difference = 0.01) and ~10% during winter (radiance difference = 0.001). However, the magnitude of radiance depends on the directionality of the secondary illumination, and peak radiance occurs within a period (~120 hours) when the subsolar longitude is between 60 and 120 and occurs on the leading wall of Shackleton. During this 120-hour period, the brighter material has ~90% higher radiance than the darker background (radiance difference = 0.04) during summer and about 20% higher radiance than the darker background (radiance difference = 0.002) during winter.
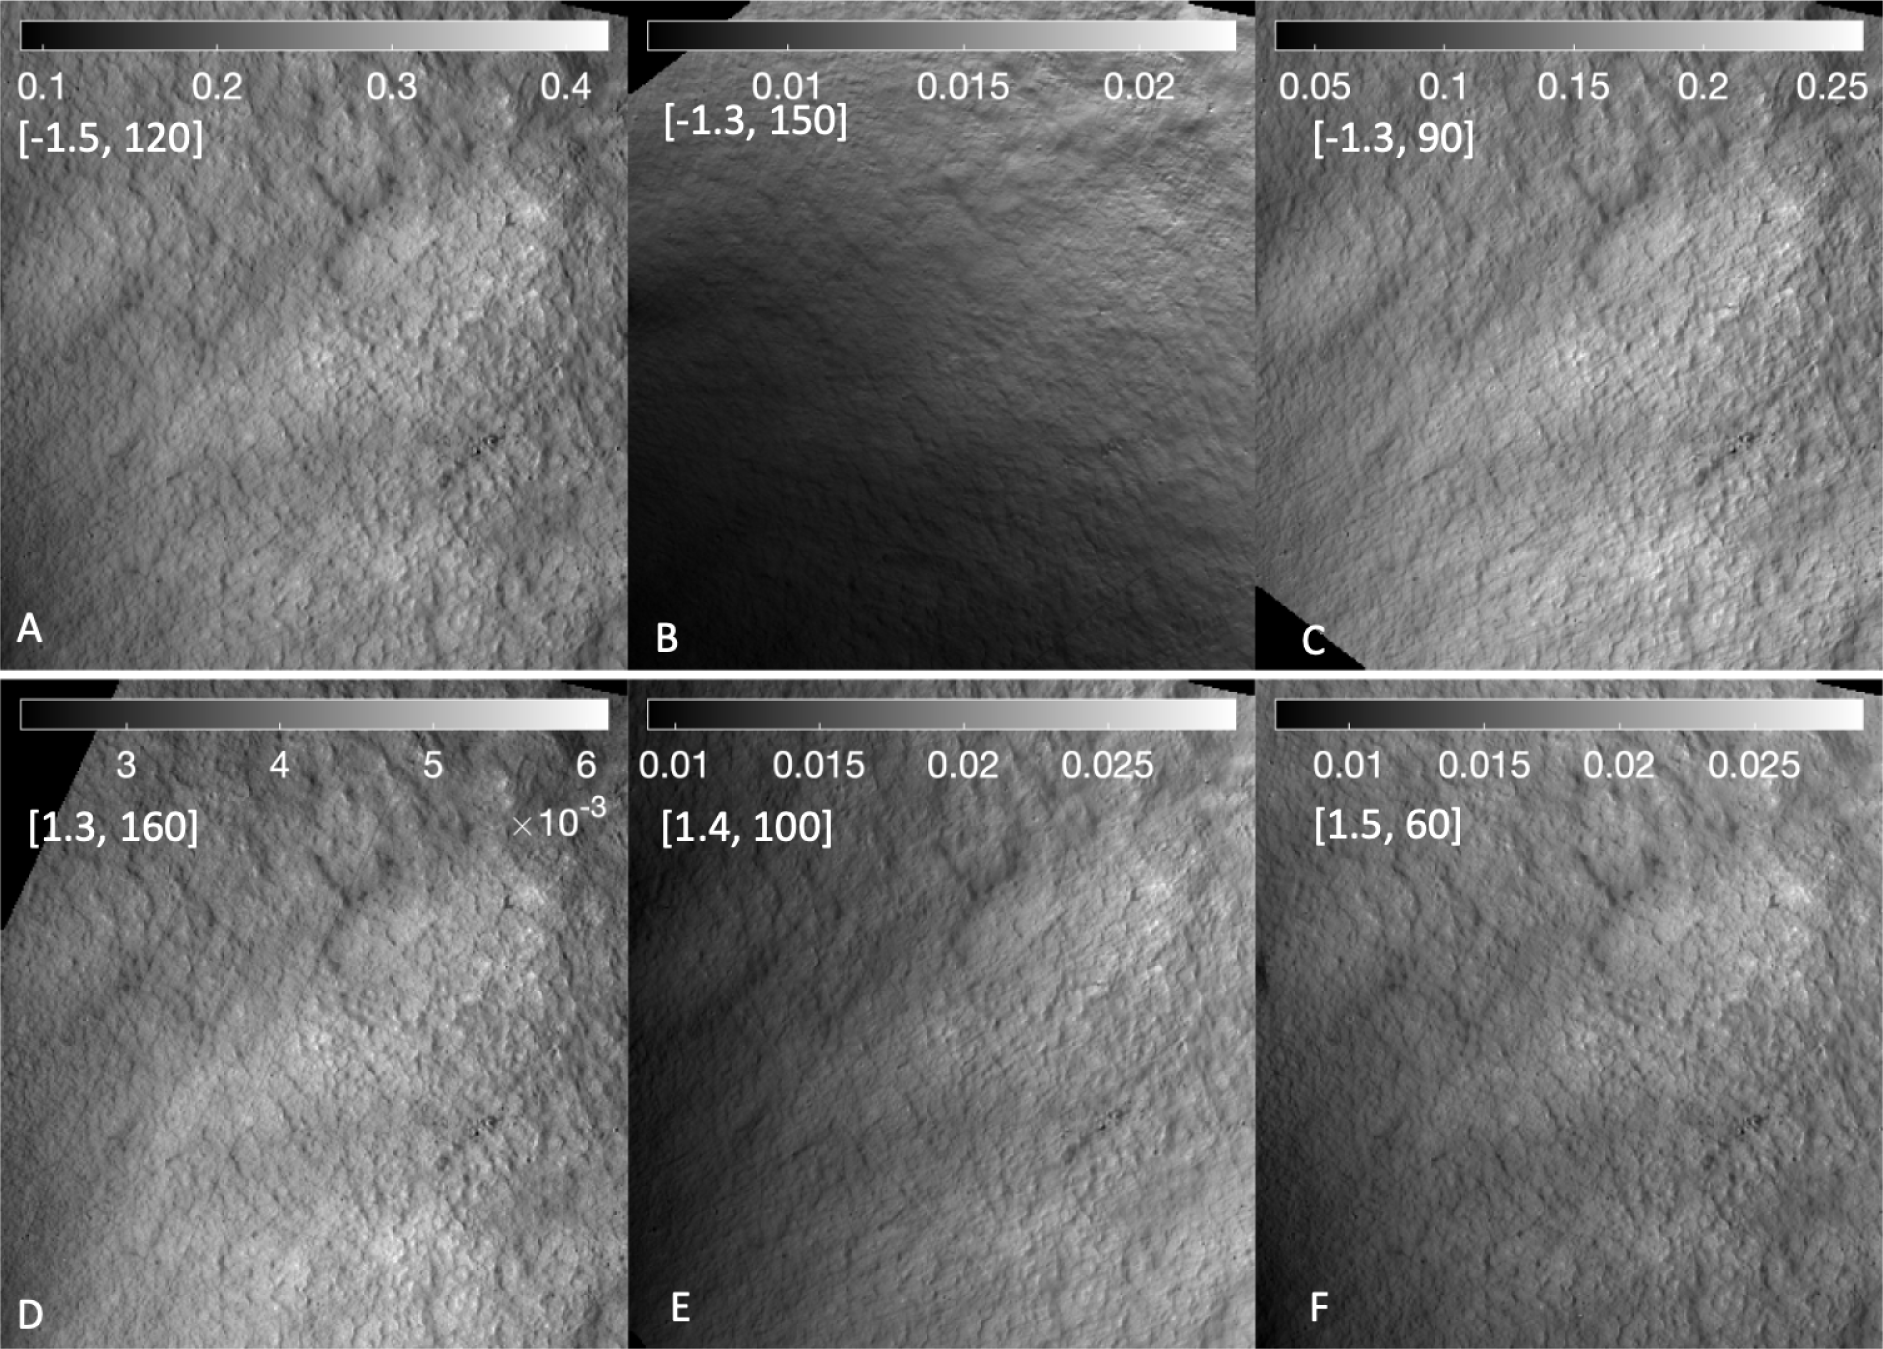
Our irradiance modeling results show similar behavior with respect to the directionality of illumination, and irradiance received (W/m2) during the same 120-hour period is ~15% more (higher radiance streaks vs background pixels in the area of interest) during summer and ~10% more during winter. A change in irradiance with direction suggests that subtle variations in wall topography is partly responsible for the brightness observed in the radiance images – the brighter pixels also receive higher irradiance. The change does not cause significant contrast differences or shadowing at the wall in our simulated irradiance images but is perceptible at the scale of our modeling when different groups of pixels were compared (bright vs. dark). However, compositional (for example, the presence of purest anorthosite at Shackleton which has very high reflectance in visible wavelength images; Yamamoto et al. 2012) and exposure of fresh material due to downslope surface processes (Zuber et al. 2012; Haruyama et al. 2013) at the steep walls could be responsible for the much-increased brightness in radiance images (90% increased radiance vs. 15% increased irradiance).
Another example of the change in contrast with the directionality of secondary illumination is for exposed rocks on the floor of Shackleton. Many exposed rocks occur on the floor mound and the wall slump (Fig. 7(A), arrows marked ‘a’ and ‘b’) Two large boulders sit on the floor mound towards the center of the floor, and the larger of the two is selected for analysis (Fig. 7, arrow marked ‘c’). Zoomed-in sections (2 m pixels) of the ShadowCam image show the local brightness for different illumination directions. Note that a large part of the low-frequency contrast visible in Fig. 7(A) is due to the local large-scale topography.
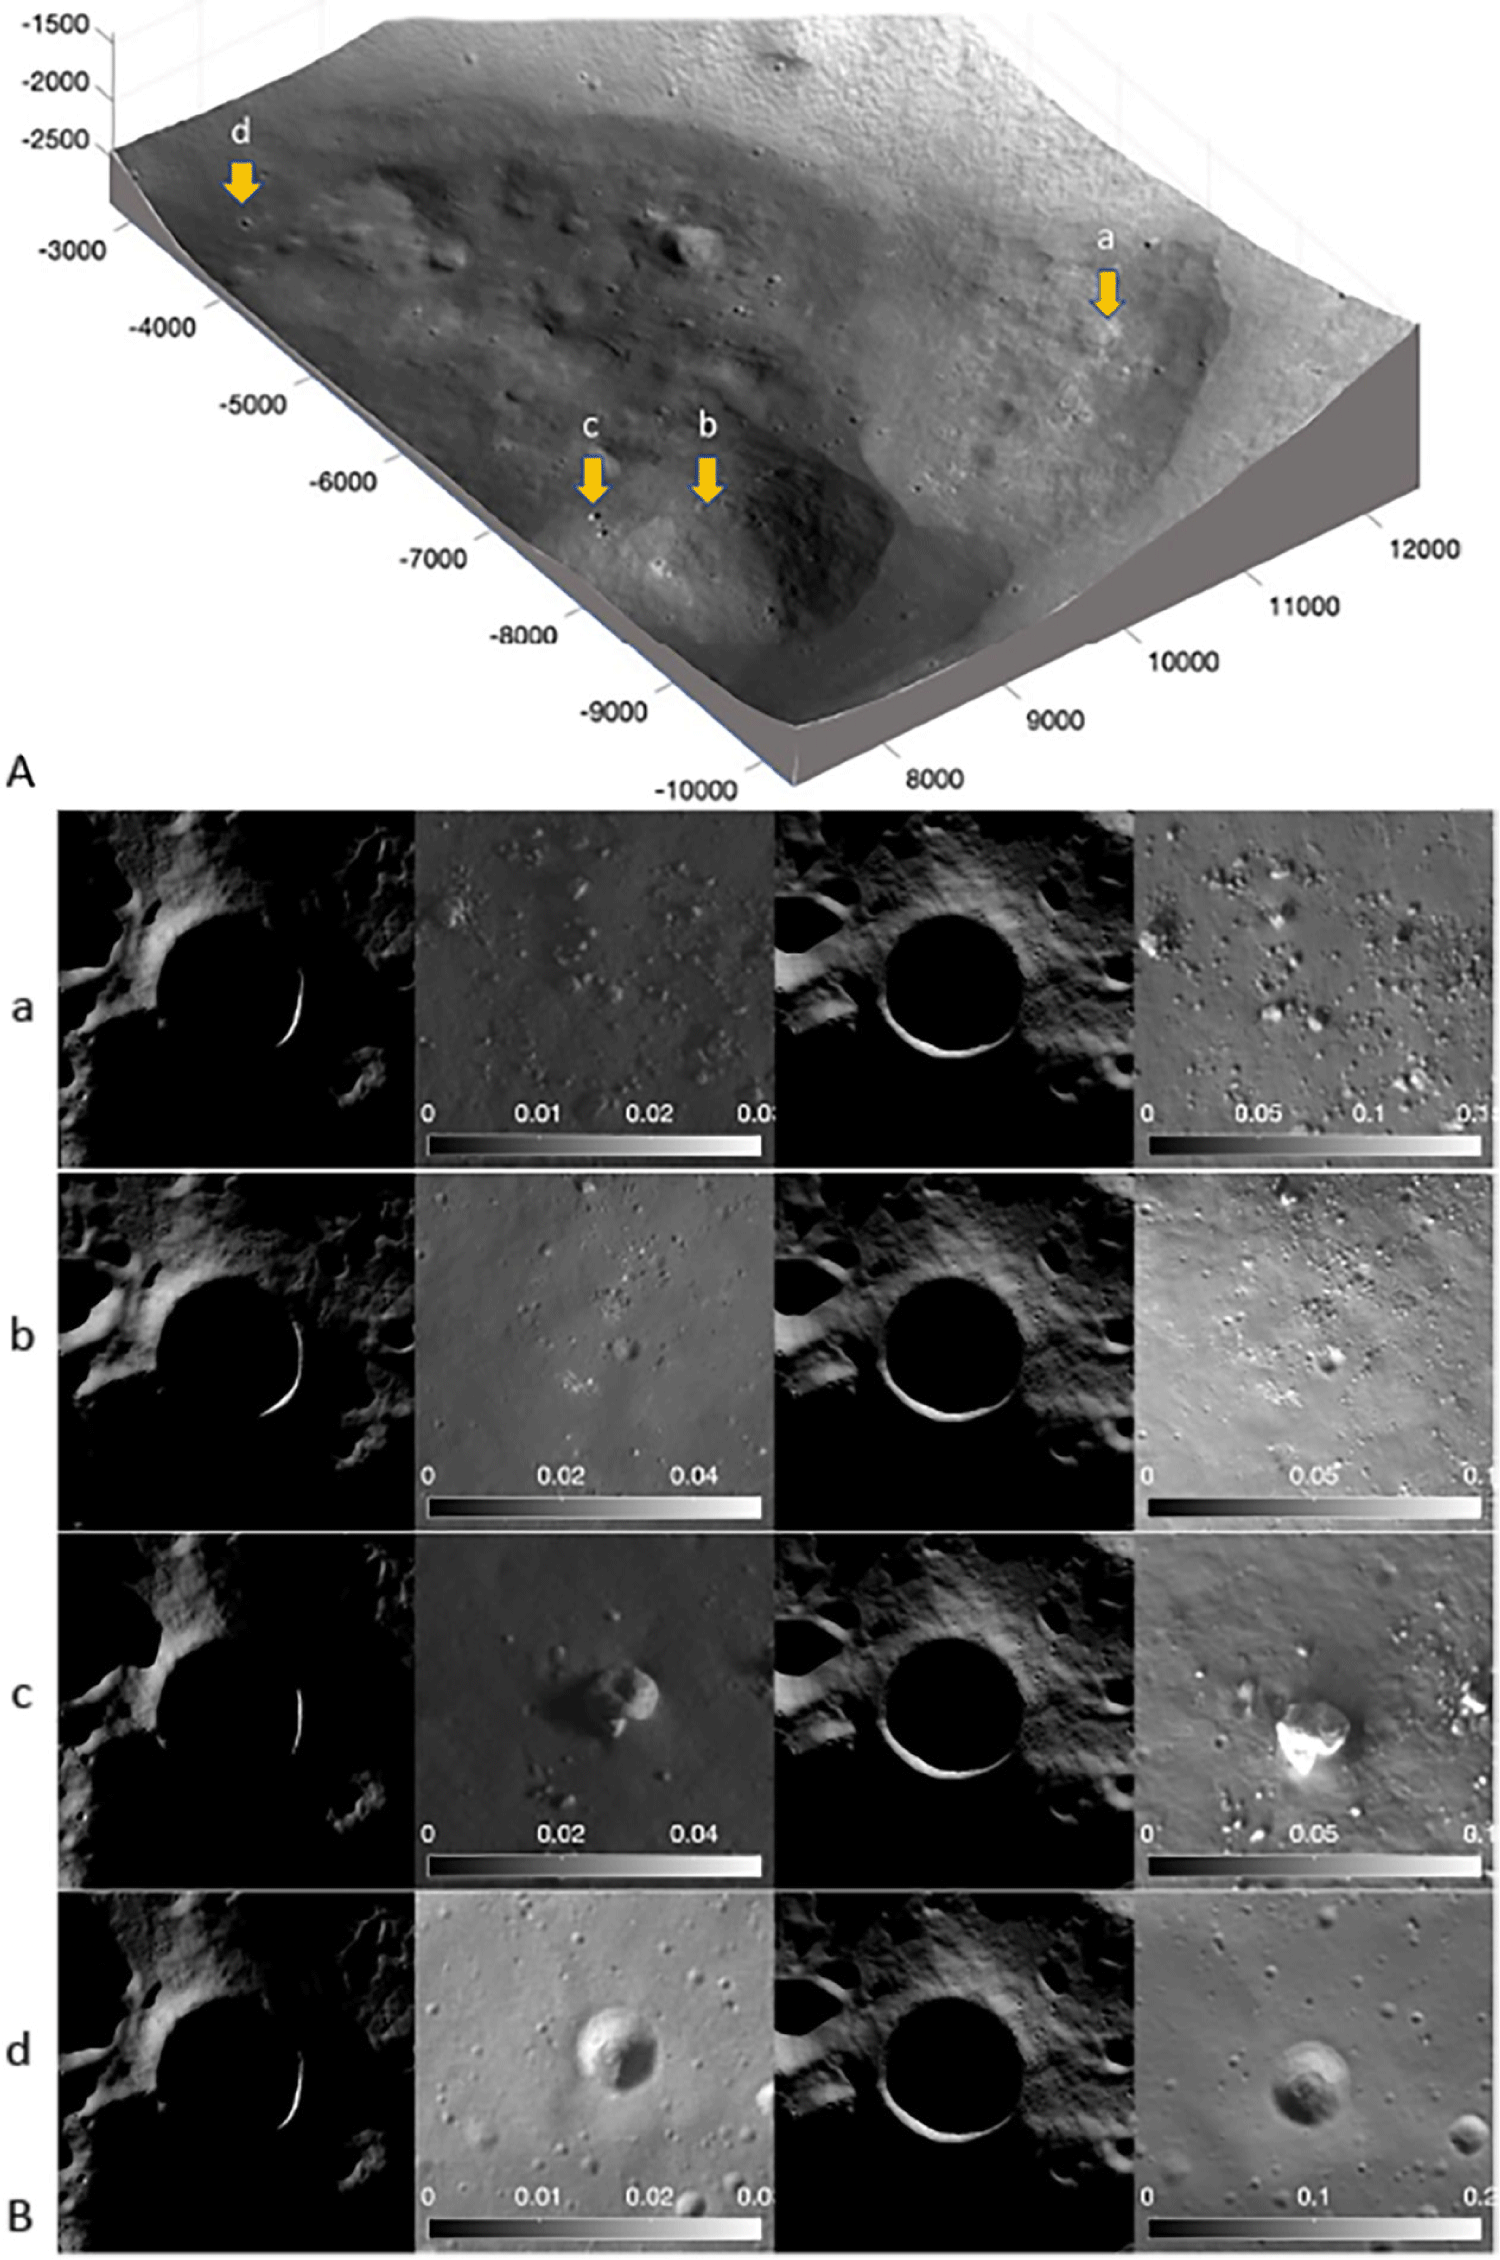
Different surfaces of the exposed boulders on the wall slump and floor mound are brightly illuminated depending on the direction of the secondary illumination. When the secondary illumination is coming from the far/ far-leading wall, it is more significant and results in much higher radiance values. This can be seen from ShadowCam images (Fig. 7(B)), where the radiance values on the left panels (illumination from trailing/ left wall) are significantly lower than those on the right panels (illumination from far/ far-leading/ right wall), by an order of magnitude.
The images of the wall slump clearly show the directionality of the illumination, with the larger rock fragments being brightly lit. Similarly, when the section from the top of the floor mound is illuminated, bright pieces of broken rock fragments can be seen. However, the brightness from the far/ far-leading wall illumination is approximately twice as bright as from the trailing wall. Additionally, the general brightness at the top of the floor mound appears to be relatively higher, which could be due to the underlying fresh ejecta deposit. The sections from the wall slump and floor mound are in Zone 3, where the illumination is also generally higher.
The largest boulder on the Shackleton floor (~60 m, Fig. 7(c)) has a topographic depression on the top that is visible only in the illumination from the trailing wall. The illumination from the far/ far-leading wall brightly lights the bottom part of the boulder. The difference in radiance between the brightest part of the boulder and the darkest part of the boulder shadow is 0.015 (0.01 to 0.02) for the trailing wall illumination and averages ~0.15 (range: 0.09 to 0.21) when illumination is from the far/ far-leading direction. Change in illumination direction causes an order of magnitude change in the brightness of rocks.
The difference in radiance between the walls and the floor at craters inside Shackleton depend on several factors, including the slope of the walls that receive secondary illumination, the texture and smoothness of the floor material, and the crater's depth. When illuminated from the trailing (right) direction, the average difference between the brightest part of the wall and the darkest part of the floor radiance is 0.02 for the craters in Zone 2 (as shown in Fig. 7(d)). However, when illuminated from the far/ far-leading direction, the difference is much more significant at 0.12. When the direction of illumination changes, the illuminated wall of the crater inside Shackleton (Fig. 7(d)) appears 5 times brighter than the shadowed floor.
The behavior of rock surfaces and slopes to secondary illumination suggests that partially buried rock surfaces can sometimes appear extremely bright in certain ShadowCam images, in comparison their surroundings. Additionally, small craters that form on smooth slopes may result in sharp changes in local slopes, which also can appear to be much brighter than their surroundings under directional secondary illumination. The reason for increased local brightness is often clarified by looking at other images of the same area under different illumination conditions.
4. CONCLUSIONS
Multiple sunlit points create secondary illumination that casts diffuse shadows. This type of illumination differs from direct illumination in terms of shadow boundaries, contrast, and texture. Although it is diffuse, secondary illumination is not necessarily uniform and can be directional, as seen in some images of the Shackleton PSR. ShadowCam images are formed entirely from secondary illumination, areas in direct illumination result in saturation.
Large-scale differences in contrast over a large surface area (e.g., wall vs. floor or left (leading) side vs. right (trailing) side) in the observed ShadowCam radiance images can primarily be attributed to differences in incident irradiance magnitudes. Two main factors influence the magnitude of irradiance inside Shackleton: (1) asymmetrical rim topography that skews the illumination geometry, and (2) topographic undulations at the floor. Our model of secondary illumination irradiance can reliably reproduce illumination contrasts due to topography and will assist in future analysis efforts.
In addition to the magnitude, the directionality of secondary (and higher order) illumination and the actual difference in reflectance (e.g., fresh material vs. mature) affect measured radiance values and relative contrast. At particular illumination geometries, partially hidden rock surfaces and small crater slopes can appear as segregated regions that are relatively bright in ShadowCam images. To clarify the origin of any relative brightness (radiance units), images from multiple illumination angles should be compared.
The trailing (right) side of Shackleton's interior is warmer owing to the secondary illumination asymmetry and floor topography (Zone 1). Illumination at the floor of Shackleton is patchy and possibly indicates a similar patchy (50 m scale) temperature distribution, which could mean a spatially irregular concentration of cold-trapped volatiles at the subsurface or mixed with regolith.
According to our Shackleton crater interior mapping from ShadowCam images, there is no observed evidence of thick ice deposits or surface ice that could be easily recognized by any relative brightness features observed in multiple illumination geometries. However, this analysis did not include the estimation of reflectance, nor did it involve reviewing all of the images of Shackleton in this preliminary study. Our hypothesis, in the context of water frost detections in Shackleton (Li et al. 2018) is that if ice or frost is present in Shackleton's interior, then the concentrations are either below the threshold that results in an observable signature in ShadowCam images, or might be mixed with the regolith at the detected areas. At other places where surface temperatures are below 110K, water frost could be hidden in subsurface layers.


