1. INTRODUCTION
The geomagnetic field at ground observatories has fluctuations when there are no solar-terrestrial occurrences or on days that are quiet in regard to solar activity phenomena, with major peak spectral components at 24, 12, 8, and 6-hour in period (Campbell 1989). These regular quiet field fluctuations are mainly by cause of the induced dynamo currents within the Earth’s ionosphere, which are flowing at approximately 100 km altitude, driven by global thermotidal winds and local tensor conductivity patterns in combination with the local main geomagnetic field vector. For more than a century, the regular daily fluctuation has been thoroughly investigated to learn more about its source currents. In order to understand more about the current sources of the quiet daily variation, substantial research has been done for more than a century (Campbell 1989; Yamazaki et al. 2011). The most popular indicators of solar activity are the, Kp-index, 10.7 cm solar radio flux, also known as F10.7 alongside with sunspot number (Tapping 2013; Rosli et al. 2022). The 10.7 cm solar radio flux (commonly abbreviated as F10.7) is a measure of the amount of solar radiation being emitted in a 100 MHz-wide at a wavelength of 10.7 cm, averaged over an hour (Henney et al. 2012). F10.7 is expressed in solar flux units (sfu), where 1 sfu = 10–22 W m–2 Hz–1 (Tapping 2013). The low activity of solar cycle 24 has given us an unprecedented opportunity to analyze the day-to-day viability of the background Earth’s ionosphere-thermosphere system. During the deep solar cycle minimum of 2008–2009, Echer et al. (2012) noted an unusually low geomagnetic activity. When compared to the ascending period of the solar cycle, the solar fluxes (UV, EUV, and X-rays) that heat the upper atmosphere and create the ionosphere as well as the well-known solar radio flux (F10.7) showed extremely low levels (see for example Balan et al. 2012 and Kutiev et al. 2013).
Observations from ground magnetometers at the magnetic equator reveal a significant daily variation in the horizontal component H of the geomagnetic field, with amplitudes up to a few hundred nanotesla (Chapman & Bartels 1940). The measured daily fluctuation of the H-component is enhanced by the equatorial electrojet (EEJ) because it induces a horizontal magnetic field at ground stations (located within the magnetic equator region) (Fambitakoye & Mayaud 1976a, b; Chandrasekhar et al. 2014) beneath it that is roughly directed northward (Yamazaki & Maute 2017; Soares et al. 2018a). The EEJ is a narrow band of intense eastward electric current flowing in the ionosphere that can be found within a latitudinal range of 3 degrees on both sides of the dip equator, at an altitude of 105–110 km above sea level (Chapman 1951; Rabiu et al. 2017). The EEJ was first observed by Egedal and later named by Chapman in 1951 (Basavaiah 2012).
During magnetically quiet days, the flow of the EEJ system reverses its direction, causing periods of westward current in the ionospheric E region (known as counter equatorial electrojet CEJ) and depressions in the H-field at equatorial stations (Gouin 1962; Chandrasekhar et al. 2014; Soares et al. 2018a). The CEJ is a dip-eqautor phenomenon in which the H-component field drops below the mean midnight value at certain times of the day (Rastogi 2004). The CEJ event was initially discovered while studying the magnetic records of the Ethiopian station Addis Ababa (Gouin 1962). In our near previous work (Cherkos & Nigussie 2022), we have discussed the longitudinal variations of EEJ and its reversal CEJ in the eight different longitudinal sectors and have noticed the CEJ in the East African and Brazilian regions are more pronounced. The quiet-time CEJ is typically observed for a few hours in the morning (MCEJ) or afternoon (ACEJ) periods and is mostly related to variations in the atmospheric tides that control the global wind system at ionospheric heights (Hanuise et al. 1983; Gurubaran 2002; Soares et al. 2018b).
As it is described, the local time (LT), longitude, geomagnetic main field, solar flux, seasons, and sunspot number are known to affect the EEJ, MCEJ/ACEJ. The earlier studies are published by authors how the MCEJ/ACEJ and EEJ are affected by certain parameters by using available long-term data from the ground-based magnetometers and satellite (e.g., Rastogi 1974; Mayaud 1977; Marriott et al. 1979; Rabiu et al. 2017; Soares et al. 2018a). The solar flux has a significant impact on daily fluctuations in conductivity, whereas the global dynamo-generated electric field and the electric field due to local winds is influenced by solar and lunar tides, planetary waves, and the disturbance dynamo (Gasperini & Forbes 2014). Moreover, during the past few decades, authors also have reported the possible relation between the solar flux/sunspot number and EEJ/CEJ across different sectors with different time: for example Mohd Rosli et al. (2022) discussed an influence of solar flux on the EEJ across the Southeast Asian (LKW) and Philippines (DAV) sectors (Ismail et al. 2021), discussed the longitudinal variation of EEJ current during different phases of the solar cycle, Hamid et al. (2013) analysis of the EEJ dependence on solar activity in the Southeast Asia sector, Fang et al. (2008), discussed the solar activity and longitudinal variation effect on the EEJ variations across the Peruvian and Philippine sectors, Matzka et al. (2017) quantifying solar flux and geomagnetic main field influence on the equatorial ionospheric current system at the geomagnetic observatory Huancayo, and Soares et al. (2018a, 2019) pointed out the CEJ climatology and dependence on solar flux in the Brazilian and Peruvian sectors.
In order to assess the impact of solar activity on the day-to-day H-component geomagnetic variation (Tapping, 2013) was used the monthly average values of the F10.7 and remove the related variability from the data. Daily values of F10.7 and sunspot number R were utilized to analyses the day-to-day variability of H-component data for this investigation. The study of long-term inter-relationships between EEJ/CEJ and F10.7/R is therefore important because the quiet time daily geomagnetic field variation can be anticipated by using an empirical model if the solar flux index F10.7 can be predicted (Yamazaki et al. 2011). Long-term geomagnetic field data, together with a variety of related metrics like sunspot counts and the solar F10.7 flux, have been used in several analyses of the long-term variation in the Sq, and EEJ amplitude since the discovery of this phenomenon (Sellek 1980; Schlapp et al. 1990; Macmillan & Droujinina 2007; Elias et al. 2010).
In this work, we demonstrate the effect of solar flux (F10.7) and sunspot number (R) on the day time EEJ and MCEJ/ACEJ variation during both the minimum and maximum phases of the solar cycle from January 2008 to December 2013 across the eight longitudinal sectors. The objective of this study is also to investigate the correlation between solar flux effects and variations of EEJ, and MCEJ/ACEJ across eight longitudinal sectors during minimum and maximum solar cycle periods from 2008 to 2013. In order to achieve this, we use the horizontal (H) component of magnetic data which records at the Peruvian (HUA), Brazilian (TTB), West African (SAM), East African (AAE), Indian (TIR), Southeast Asian (LKW), Philippine (DAV), and Pacific (YAP) sectors and analyses long-term variations in its day-to-day, monthly, seasonally, annual variation, and their dependency on solar flux and sunspot, and MCEJ/ACEJ occurrence rate. The H-component Earth’s geomagnetic components contain the majority of the signal than other components that we are interested in our investigation.
2. METHODS
In this work, we used the data during magnetically quiet periods of electric current intensity profiles for sunspot number, solar flux, and EEJ from magnetic field data, and the analysis period covers nearly half of the solar cycle 24 (from January 2008 to December 2013). By avoiding the days that have geomagnetic disturbances in the Earth’s atmosphere and referring to the global geomagnetic activity index, which is the Kp index at a lower value (Kp-index < 3 as well as AP-index < 15). We only selected a minimum of 15 days each month of data with quiet magnetic conditions for our analysis. The magnetic data from ground stations records by and obtained from Intermagnetic Data Center (https://www.intermagnet.org/index-eng.php), AMBER Network (http://magnetometers.bc.edu/index.php/amber2), BCMT Network (http://www.bcmt.fr/wamnetnetwork.html), World Magnetic Data Centre (http://www.wdc.bgs.ac.uk/dataportal/), the LISN Network (http://lisn.igp.gob.pe/data/) and SuperMAG (http://supermag.jhuapl.edu/) observations from January 2008–December 2013 across the Peruvian, Brazil, West and East African, Indian, Southeast Asian, Philippine, and Pacific sectors to study solar flux and sunspot number effect on the variation of EEJ/CEJ during quiet times within both minimum and maximum solar cycle periods. The Kp index, F10.7, and sunspot number (R) provided by the OMNIWeb Data Explorer (https://omniweb.gsfc.nasa.gov/form/dx1.html), which was utilized to examine the impact of them on the daytime EEJ/CEJ phenomena.
The station pair technique was utilized to isolate the EEJ effect during only geomagnetically quiet times using H-components data from ground-based magnetometers around the world. To achieve hourly values, the variance data acquired at 1 minute sampling intervals is averaged. As a result, we used hourly averages of H-component values for 15 stations. The list the geographic and geomagnetic coordinates of the selected magnetometer stations and their distributions as region wise are listed in Table 1. The average value of the hours surrounding local midnight defines the nighttime calm level of each night (Siddiqui et al. 2015; Soares et al. 2018b). A baseline magnetic field is calculated by taking the mean magnetic field at 22:00, 23:00, 00:00, and 01:00 LT of each day and subtracting it from the daily data. The strength of the EEJ is, EEJ = ∆HEEJ − ∆Hnon−EEJ; where ∆H is the variation of H from the midnight mean level for a particular site. Using the difference in H between two magnetic observatories with the same longitude but different latitude, the method removes numerous sources of disturbance (Briggs 1984). For this investigation the monthly EEJ current variations were calculated by averaging for a minimum of 15 quiet days each month. Due to the failure of the data logger or unavailability of a minimum of 15 days magnetic data for the months in some sectors, we have used some more stations within approximately same longitudinal zone. The results also may show the vacant in the figures if there are no magnetic data in the sector. We have also discussed it briefly in our previous work (Cherkos & Nigussie 2022). We have used statistical analysis of the H-component of magnetic field variation to study the effect of the solar flux activity on the EEJ and MCEJ/ACEJ during quiet time (minimum and maximum solar cycle period). The occurrence periods of the CEJ have been categorized by various studies (Gouin 1967; Chandrasekhar et al. 2017; Rabiu et al. 2017; Soares et al. 2018b; Cherkos & Nigussie 2022) using defined LT intervals for the occurrence of MCEJ (06:00 to 12:00 LT) and ECEJ (14:00 to 18:00 LT). The locations of magnetic stations in eight longitudinal sectors are illustrated in Fig. 1.
The computed coordinates presented here are based on the Geomagnetic Coordinates IGRF-13 revised in December 2019 using the epoch of 2013 (data from British Geological Survey 2019).
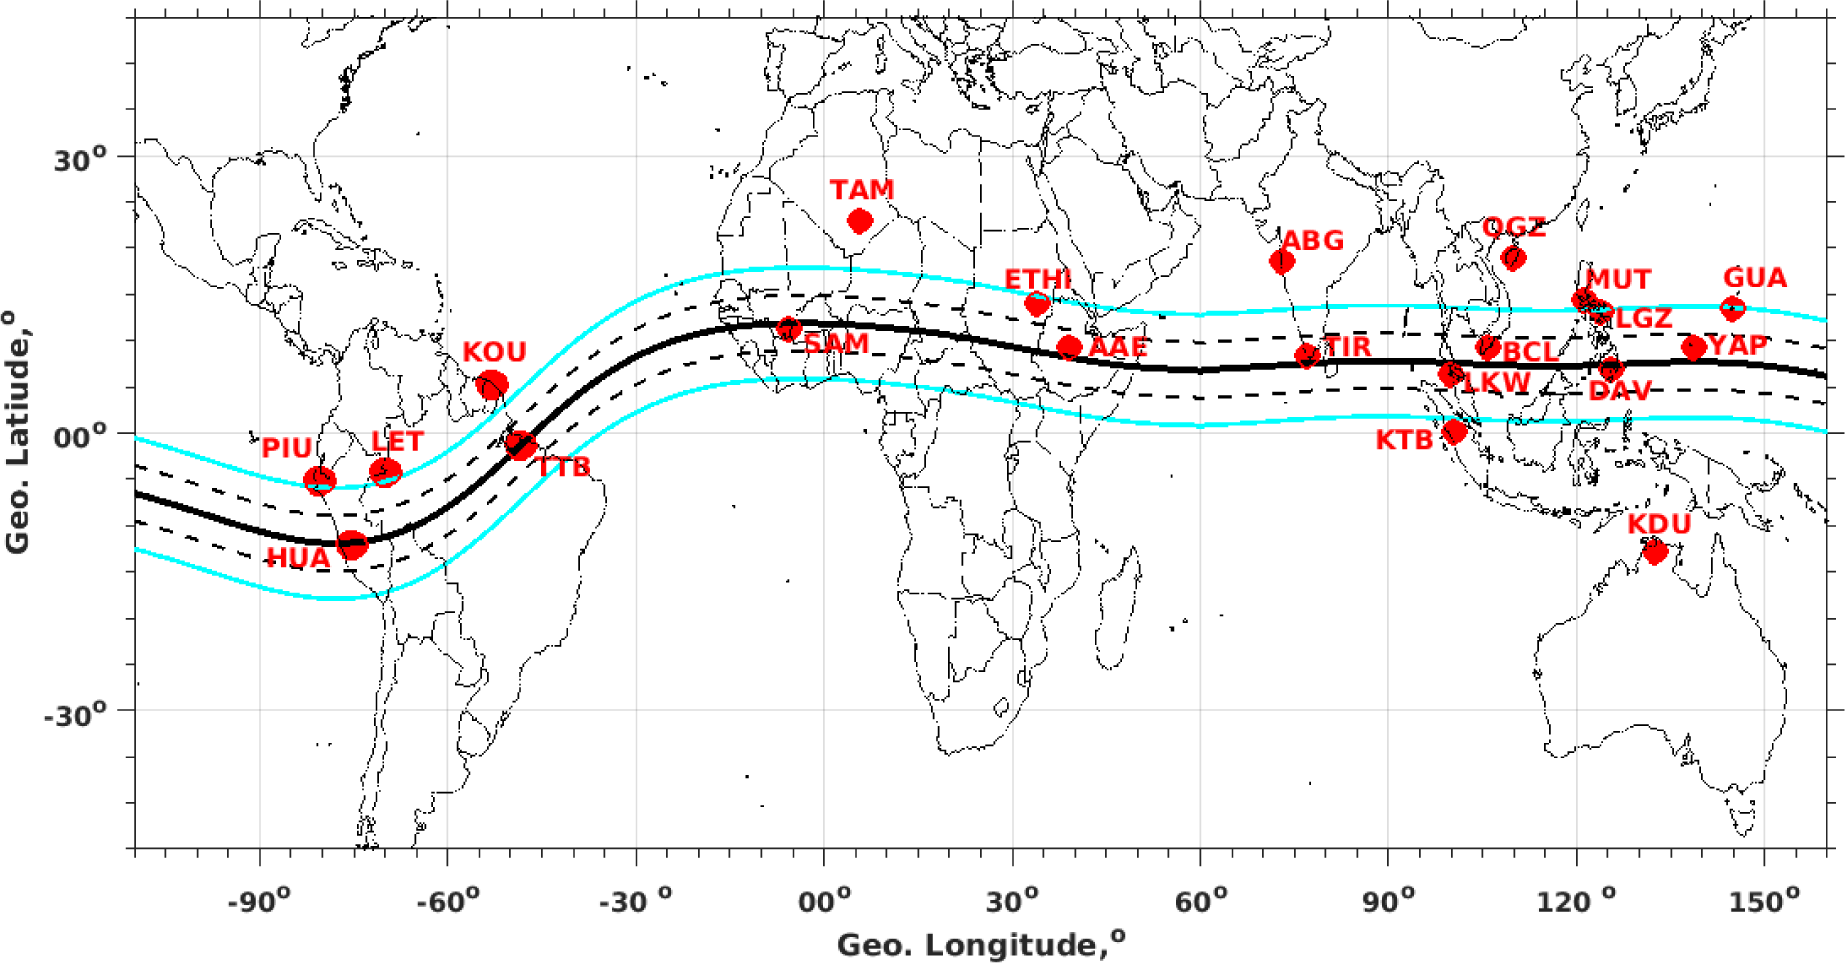
As shown in Fig. 1, the magnetic dip equator is indicated by a black bold line curve. The black thin lines above and below the dip-equator represent a latitude range of ± 3 degrees from the dip-equator. On the other hand, the cyan color thin lines positioned above and below the dip-equator denotes the probable EEJ regions (i.e., between –6° and 6° of magnetic latitude). Any stations located outside these cyan color thin lines are considered to be off-the-dip equator. The EEJ current can be calculated using the idea that a pair of magnetometers, with one located at the dip magnetic equator (± 2°) and, while the other (an off-equatorial station) should be located ± 6°–9° away from the magnetic equator, with both stations in the same longitudes as suggested by Rastogi & Klobuchar (1990), Anderson et al. (2004), Yamazaki & Maute (2017). Following Tomás et al. (2008), Benaissa et al. (2017), due to the unavailability of the magnetic station between ± 6°–9°, its location outside the EEJ influence region, the Tamanraset (TAM) and Kakadu (KDU) are used as reference station (in Fig. 1) to calculate the EEJ in the West African and Philippine Sector respectively.
3. RESULT AND DISCUSSION
The results of Kp index (< 3), monthly means of sunspot number R, solar flux F10.7, and EEJ /CEJs during the geomagnetic quiet time from January 2008 to December 2013 are shown in Fig. 2 from top to bottom, respectively.
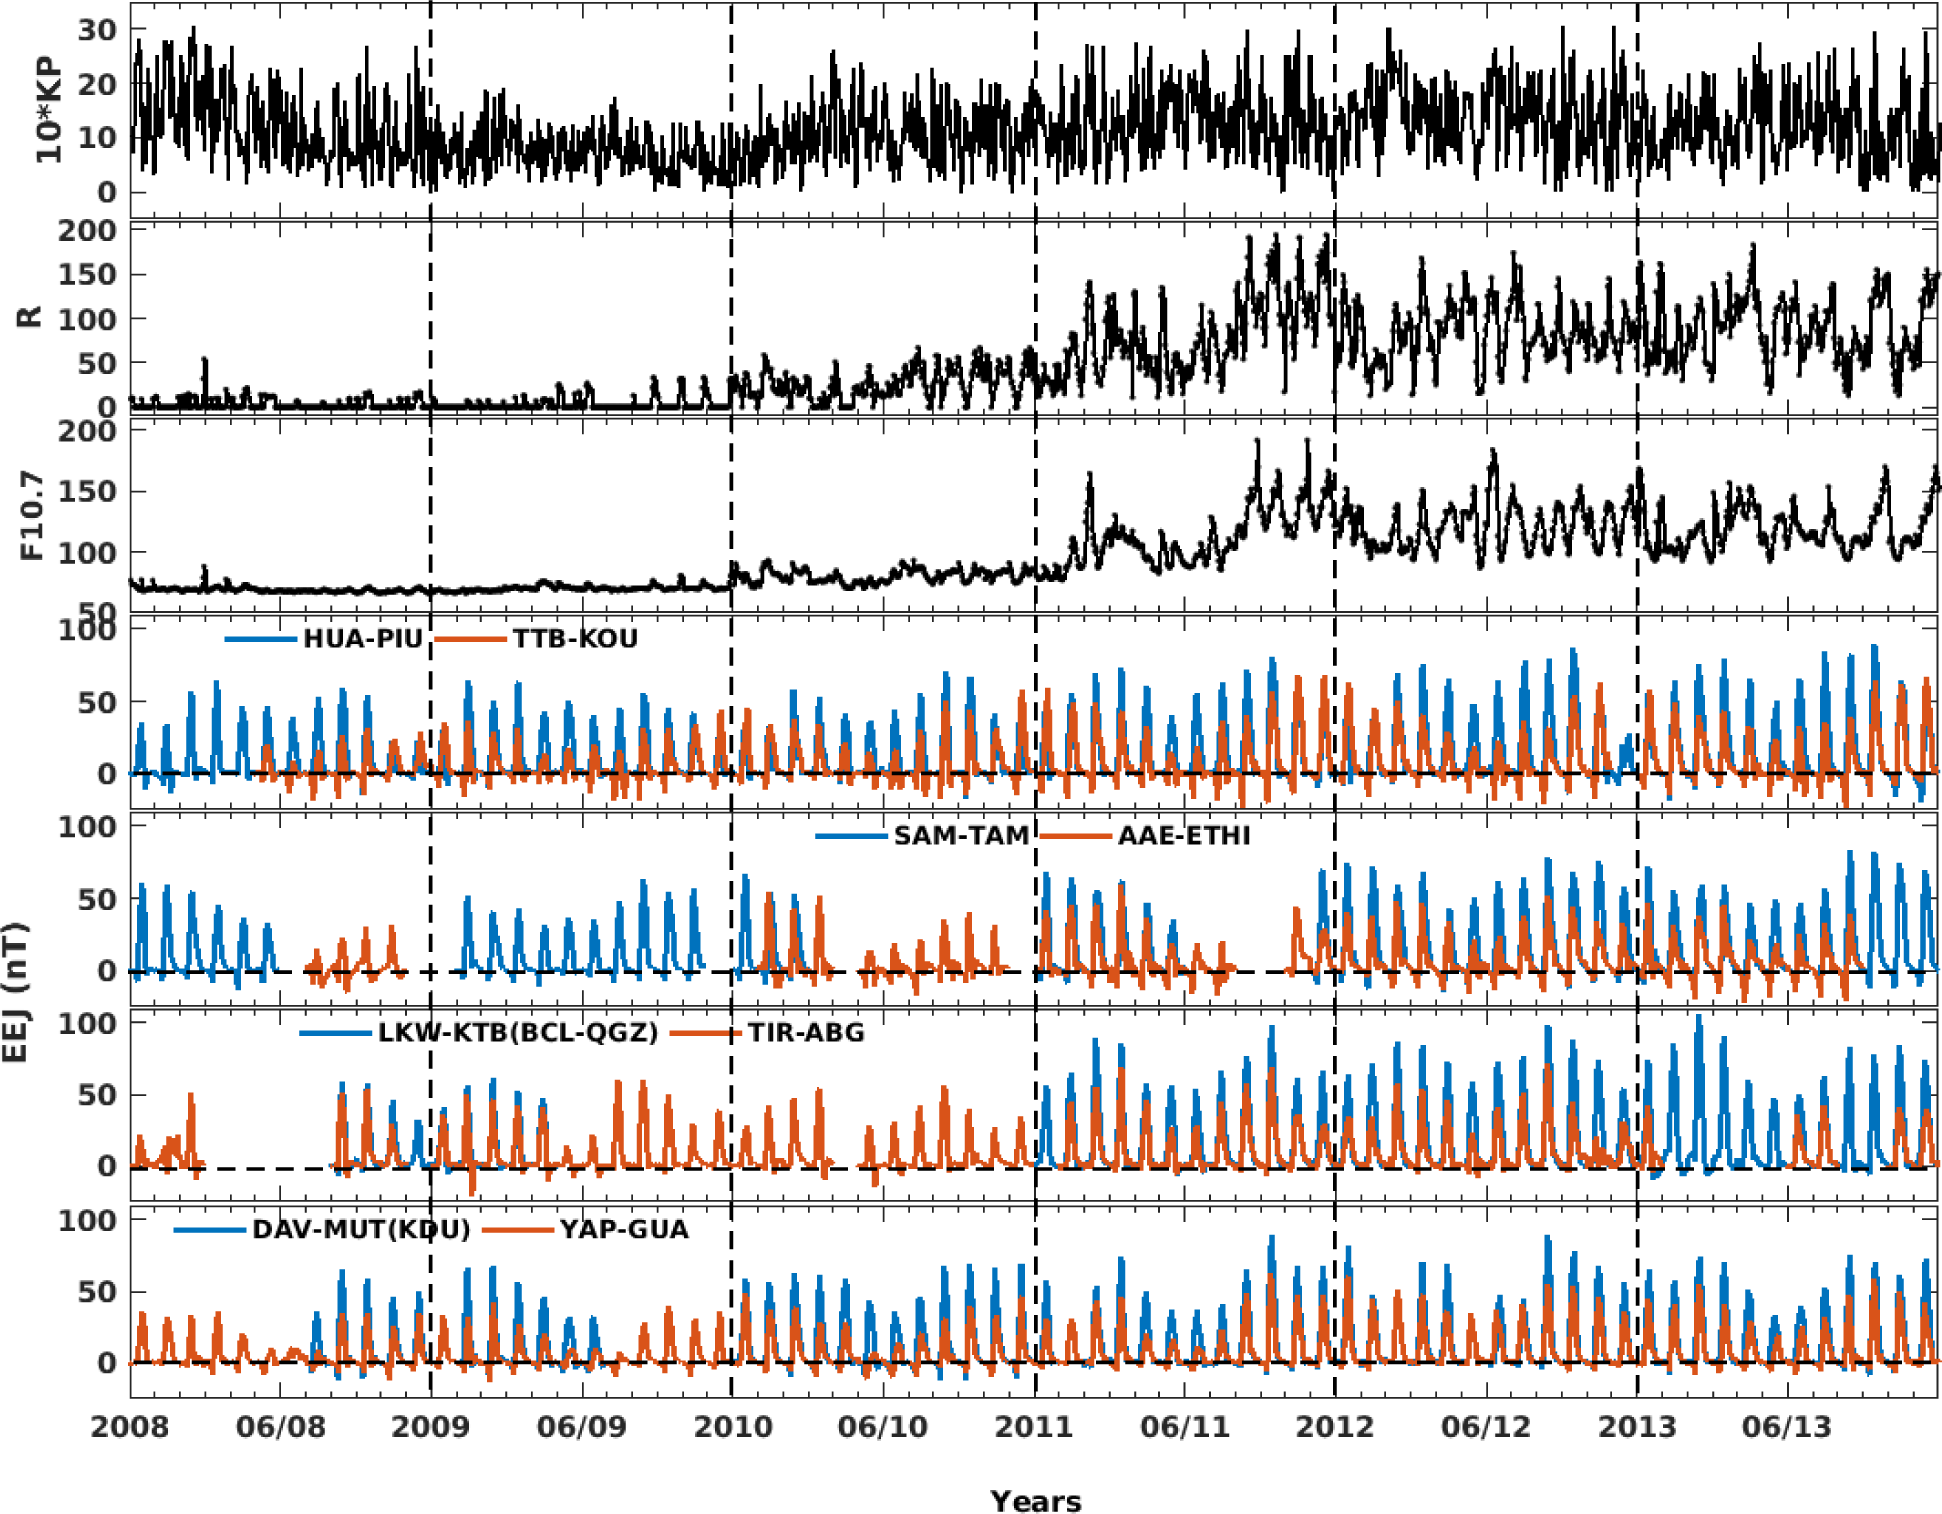
The blue curves represent the EEJ/CEJ signals for the Peruvian (HUA-PIU), West African (SAM-TAM), Indian (TIR-ABG), and Philippine (DAV-LGZ) sectors, while the red curves indicate the EEJ/CEJ signals for the East Brazilian (TTB-KOU), East African (AAE-ETHI), Southeast Asian (LKW-KTB or BCL-QGZ), and Pacific (YAP-GUA) sectors, respectively. The top panels (first, second, and third) represent the variability of solar and geomagnetic activity during the investigation period, measured by the Kp indices, sunspot number (R), and F10.7, respectively. Due to the limited or unavailability of consistent magnetic data from the ground magnetometer in the African, Indian, Southeast Asian, and Philippine sectors during the lower solar cycle period (2008–2010), it is challenging to determine the EEJ patterns in these regions with the corresponding F10.7 and R values, as shown in Fig. 2.
The findings of this study indicate that during the minimum of the solar cycle 24 (2008–2010), the intensity of the EEJ weakened significantly across the Peruvian, Brazilian, and Pacific sectors due to reduced solar flux. As a result, there was a decrease in the northward electric field and thermospheric wind speeds, which led to a reduction in the EEJ current magnitude. During the maximum solar cycle period (2011–2013), however, there was an overall increase in EEJ intensity across all sectors, likely due to increased ionospheric heating caused by higher levels of solar activity and an increase in flux leads to the generation of more energetic particles. These particles, in turn, generate stronger electric fields and winds that cause a significant rise in the intensity of the EEJ. The plots in Fig. 2 also demonstrate a clear seasonal dependence of the eastward EEJ with sunspot number and solar flux, with higher peak values observed in the Peruvian, Southeast Asian, and Philippine sectors during September/March equinox from 2011 to 2013, and moderate peaks in other sectors. On the other hand, moderated and weak EEJ with sunspot and F10.7 patterns during the June/December solstice months of investigation in those sectors. These findings have significant implications for comprehending regional climates and their sensitivity to different levels of solar activity. Previous studies (e.g., Ismail et al. 2021) examined the characteristics of the EEJ in the South American, Southeast Asian, East African, and Indian sectors, but the West African, Philippine, and Pacific sectors were not considered during the same period. During the MCEJ/ACEJ period (H-component depressions) occurrences were more pronounced in the Brazilian and East African sectors, as depicted in Fig. 2. However, compared to other sectors, the EEJs intensities were comparatively weaker in these regions during the investigation period.
In general Fig. 2, it is evident that the EEJ current was strongest/dominant at the Southeast Asian (LKW), Philippine (DAV), and Peruvian (HUA) sectors. The second/moderate peak might be seen from ground data in the West African (SAM) and Indian (TIR) sectors, but the weakest EEJ strength is more observed in the Brazilian (TTB), East African (AAE), and Pacific sectors for all LTs (Fig. 2). The findings of this study indicate that variations of the sunspot number and solar flux have a considerable impact on the daily, monthly and seasonal variation in EEJ across the different longitudinal sectors we investigated during geomagnetic quiet days. Moreover, the investigation also found that EEJ intensity across all the longitudinal sectors is not constant throughout the solar cycle, with variations both at minimum and maximum solar flux levels. Additionally, results showed that EEJ intensities at different geographical locations vary in order to respond to the changes in solar flux. As such, inference can be drawn that the variability of EEJ influences magnetospheric processes significantly in respective sectors.
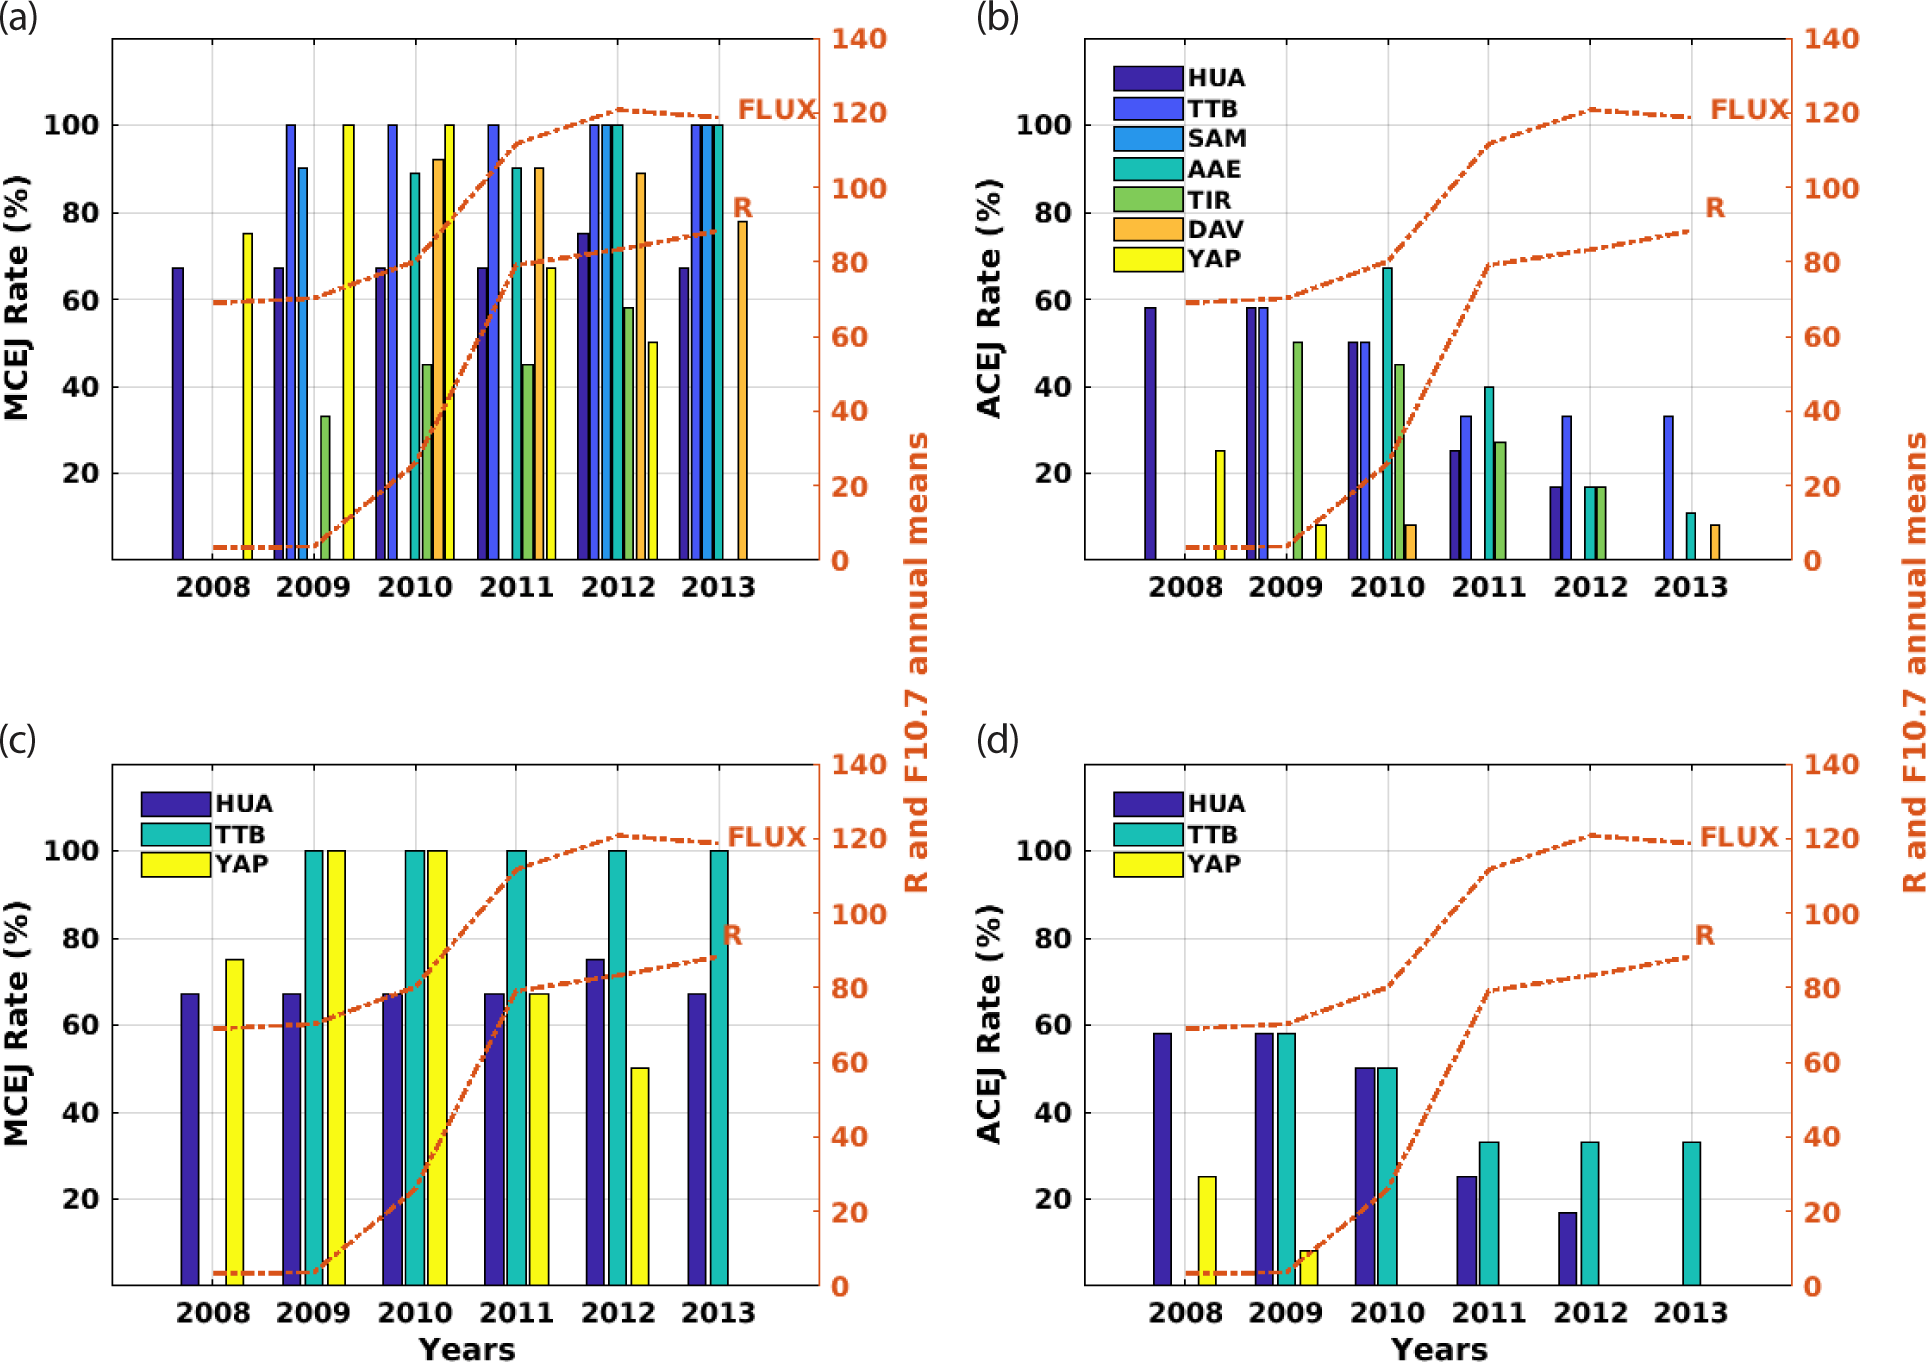
The analysis of the study period involved calculating the annual means of F10.7 and R during quiet times, as well as the annual occurrence rates of MCEJ and ACEJ. These values were obtained from the monthly mean values along the magnetic dip equator and are presented in the chart in Fig. 3. The daily maxima monthly rates of the morning (MCEJ, 6 to 12 LT) and afternoon (ACEJ, 14 to 18 LT) counter electrojet occurrences at HUA, TTB, SAM, AAE, TIR, LKW, DAV, and YAP are shown in Fig. 3(a) and 3(b) together with the monthly mean values of flux (F10.7) and sunspot number (R) for each month in each year from January 2008 to December 2013 given by the gray dot lines. The pattern of variability and longitudinal trend, significant differences about 30°separation of EEJ/CEJ at 75°W, 48°W, 5°W, 39°E, 77°E, 105°E, 121°E, and 138°E. We have selected the MCEJ/ACEJ rates for three different stations in Fig. 3(c) and 3(d) which have more magnetic data availability than other stations during the period of investigation. The findings presented in Fig. 3 are consistent with previous studies conducted at different longitudes, including those by Rastogi (1974), Marriott et al. (1979), Soares et al. (2018b) and Mohd Rosli et al. (2022). The occurrence rates of MCEJ were significantly higher than those of ACEJ across all longitudinal sectors, as depicted in Fig. 3. The results in Fig. 3(c) and 3(d) indicate that the occurrence rates of both MCEJ and ACEJ are highest in the Brazilian longitude compared to HUA and YAP. It is also shown that the MCEJ occurrence rates seem to be unaffected by F10.7 and sunspot number, but the ACEJ occurrence rates tend to rise for the lower F10.7 and sunspot number (R) (Fig. 3). This may likely to be associated with abnormalities in the global Sq current system. Additionally, Fig. 3 demonstrates how the ACEJ events can occasionally be highly fugacious from one longitude to another. Moreover, during low solar cycle years (2008–2010), the occurrence rate of the MCEJ shows largely constant in most regions or an increasing value in some other regions, while the ACEJ shows almost the decreasing values from especially from 2010 to 2013 (an incline phase of solar cycle 24) across all the regions of the investigation. Our results are consistent with previous results in other years (Soares et al. 2018b, 2019).
Following Ismail et al. (2017), we continue the statistical analysis by comparing the results in 2009 (from the deep minimum solar cycle years) and 2011 (from the inclination phase solar cycle years) at the eight longitudinal sectors in Figs. 4 and 5. The relation between the daily maximum of EEJ across the Peruvian (a, e), Brazilian (b, f), West African (c, g), and East African (d) sectors with the corresponding daily solar flux as illustrated in the top panel (for 2011) and bottom panels (for 2009) of Fig. 4. As expected from the results in Fig. 2 and the explanation in the introduction, this current showed a positive linear relation with flux for all longitudinal sectors during the quiet time of inclined phase of the solar cycle 24 (2011). But, it shows a weak or doesn’t have relationship during the minimum solar cycle period (2009). The low correlation between the F10.7 and EEJ strength might indicate the influences of the lower atmosphere and the west warded electric field (causes of CEJ) on the daytime EEJ strength as well as magnetospheric disturbances. Because the magnetic signature of the EEJ strength is known to have a longitudinal dependence that is strongest in South America and moderate in West Africa (Doumouya et al. 2003; Hamid et al. 2013). Fig. 5 also depicts the correlation between the monthly average day maxima EEJ intensity and solar flux (F10.7) index amplitudes in the Indian (a), Southeast Asian (b), Philippine (c), and Pacific (d) sectors during the inclining period of solar cycle 24 (2011) tended to the EEJ increase with an increase in the solar F10.7 index. Conversely, Fig. 5(e)–5(g) for the lower solar cycle year 2009 in the same regions that show none or less effect of F10.7 on the EEJ.
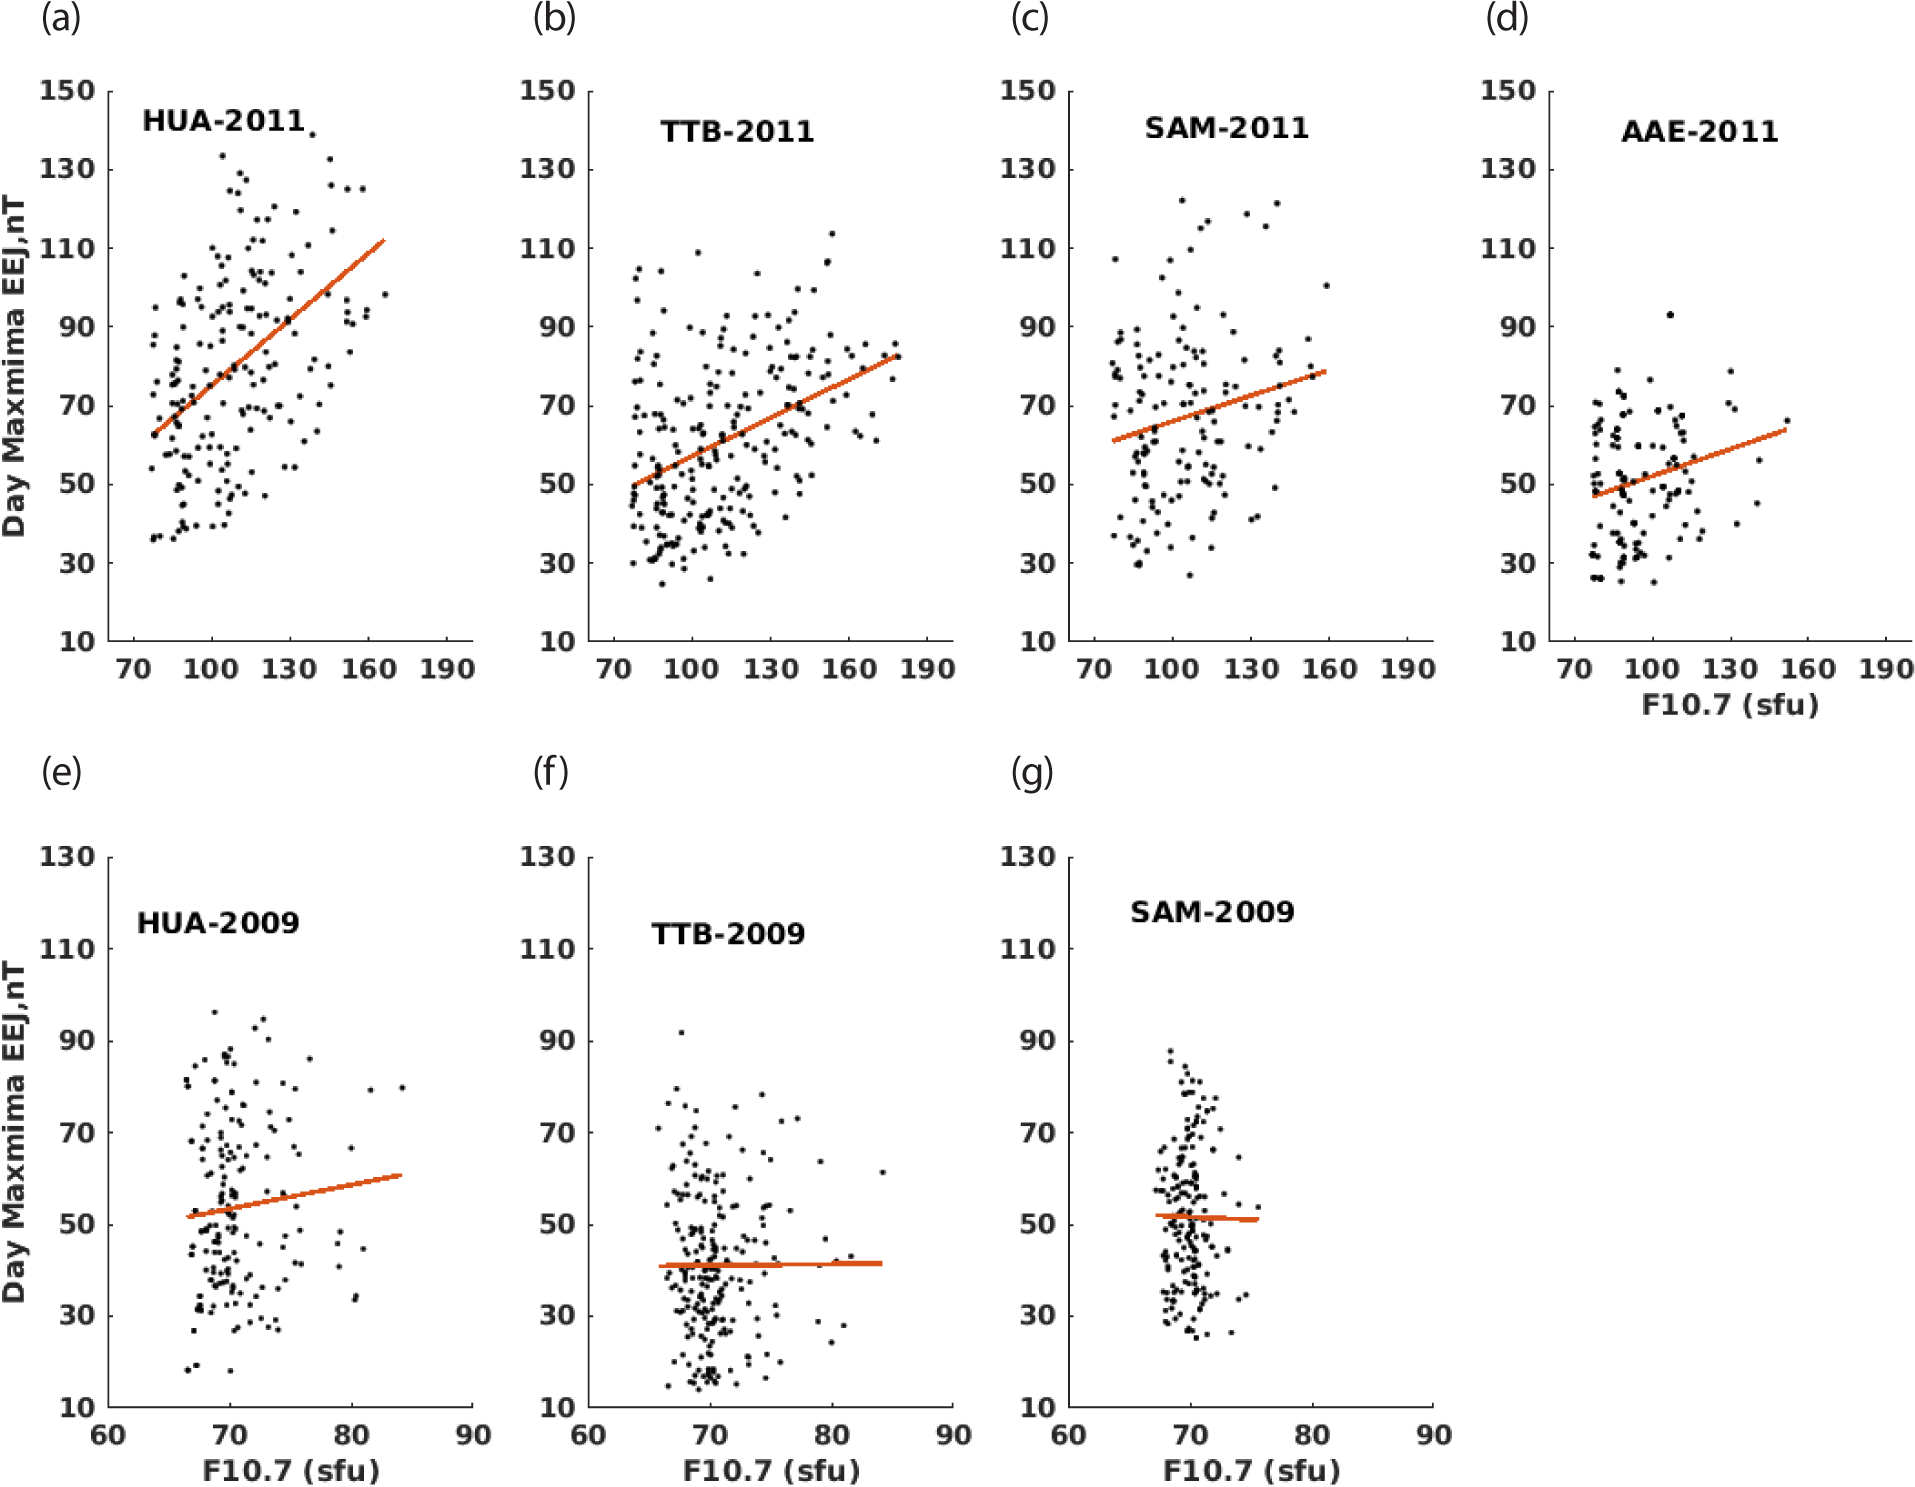
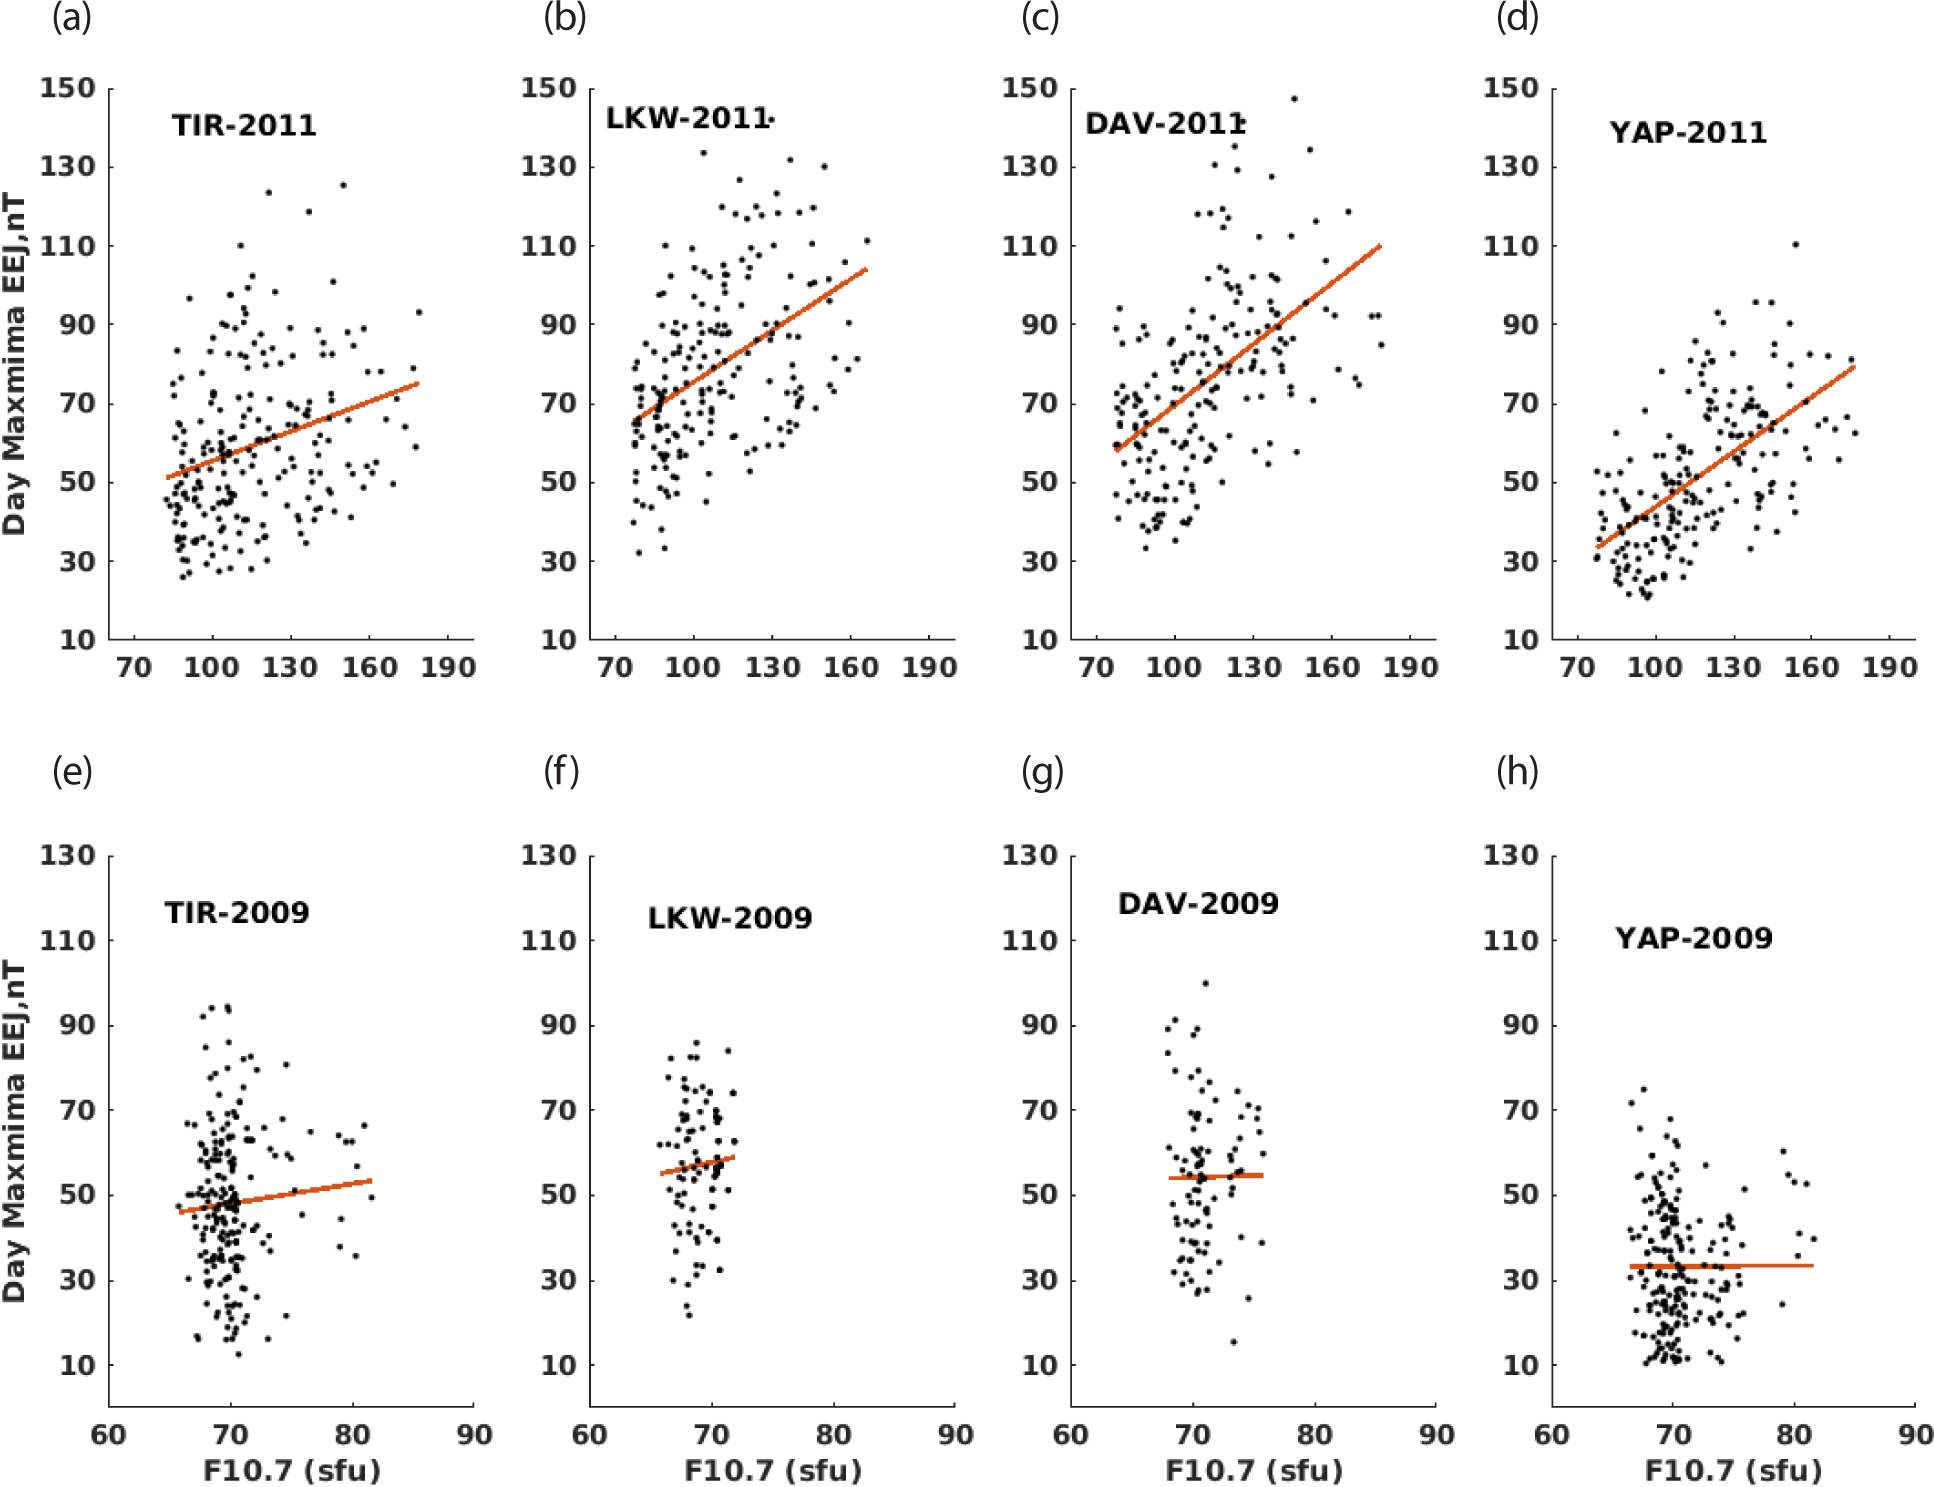
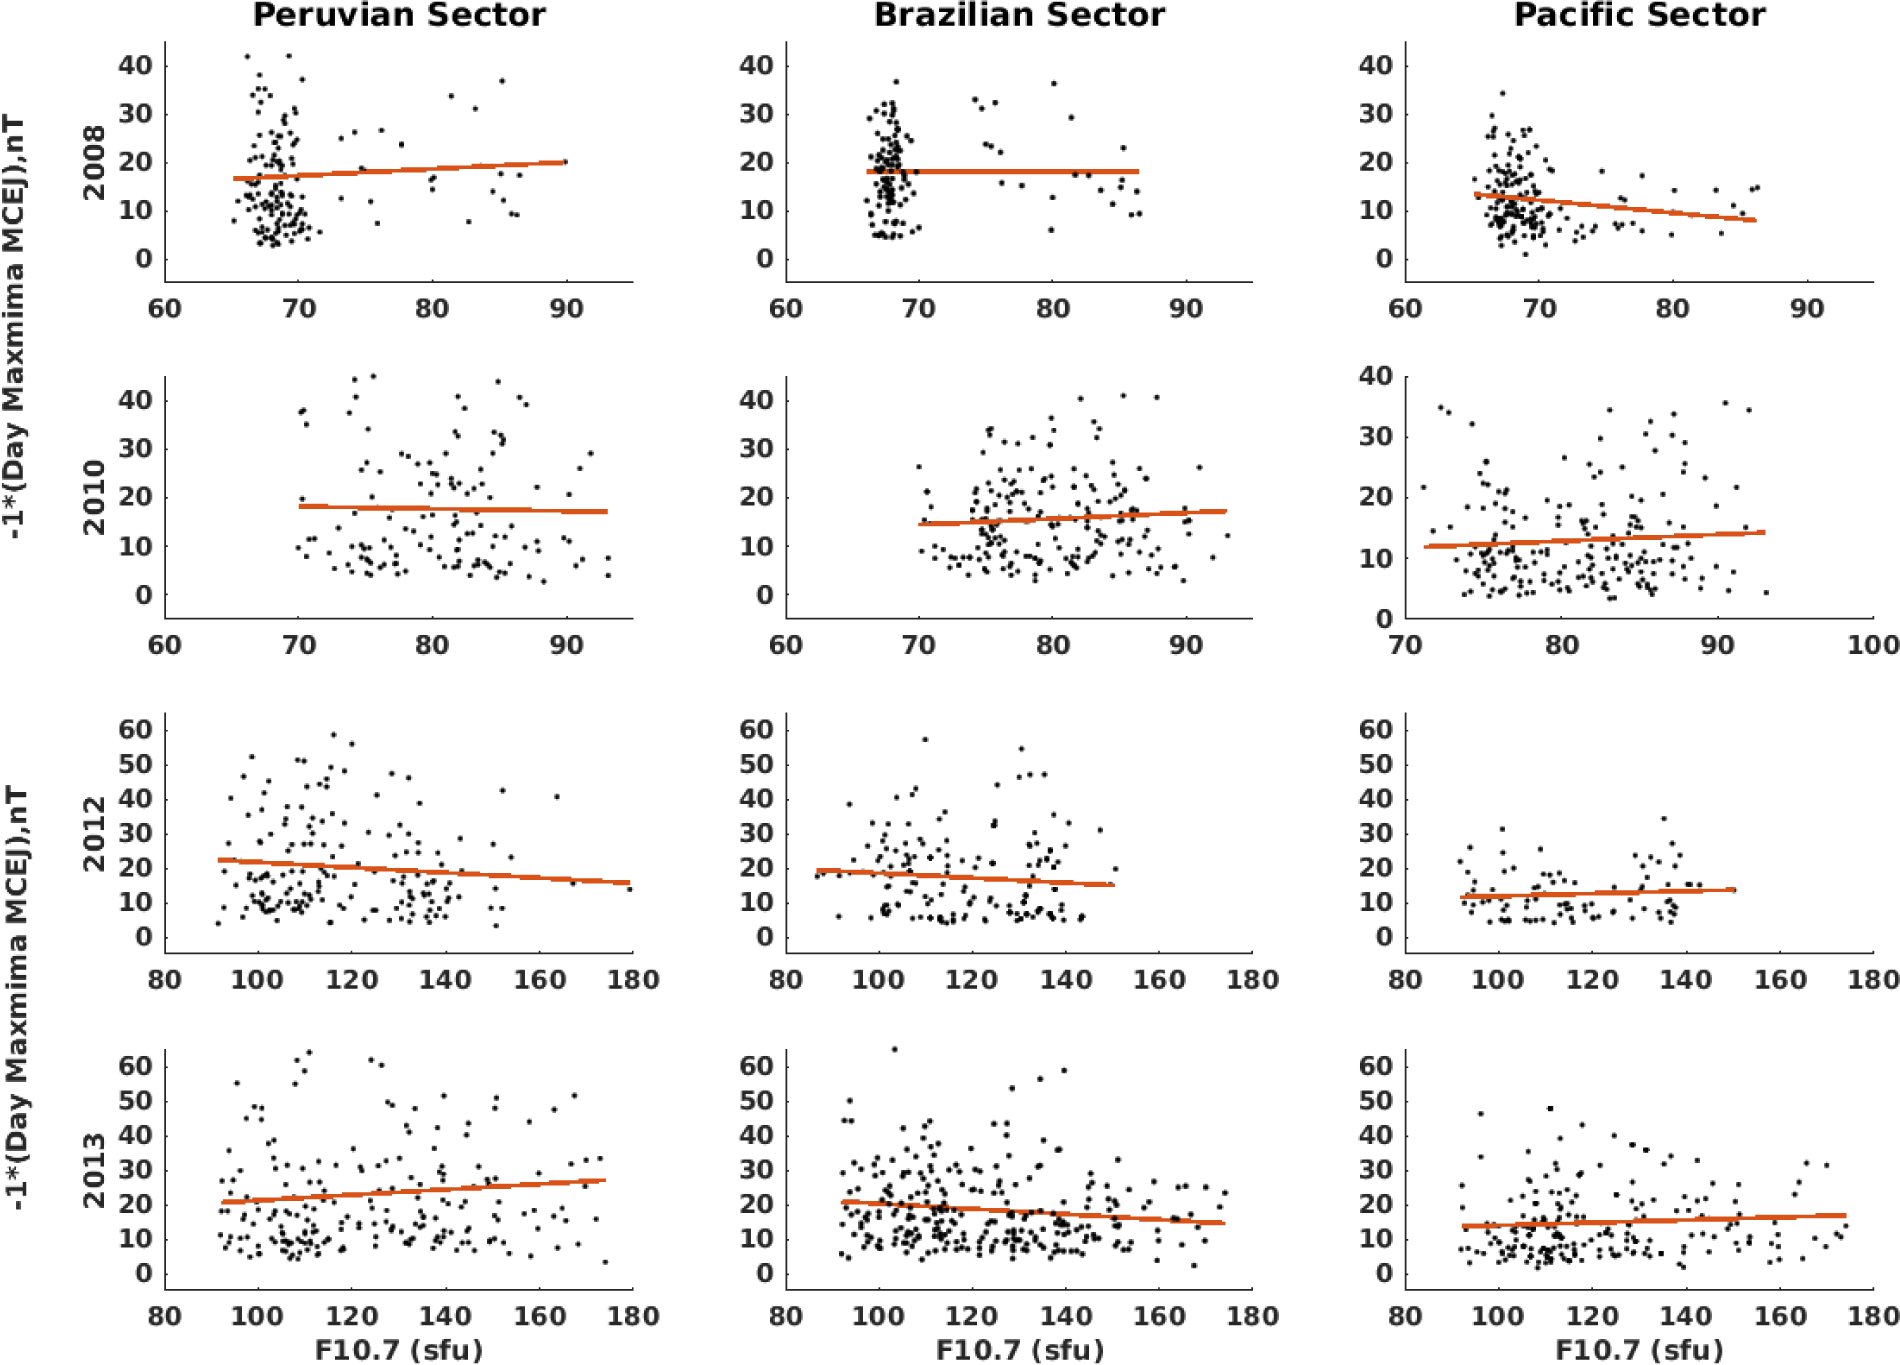
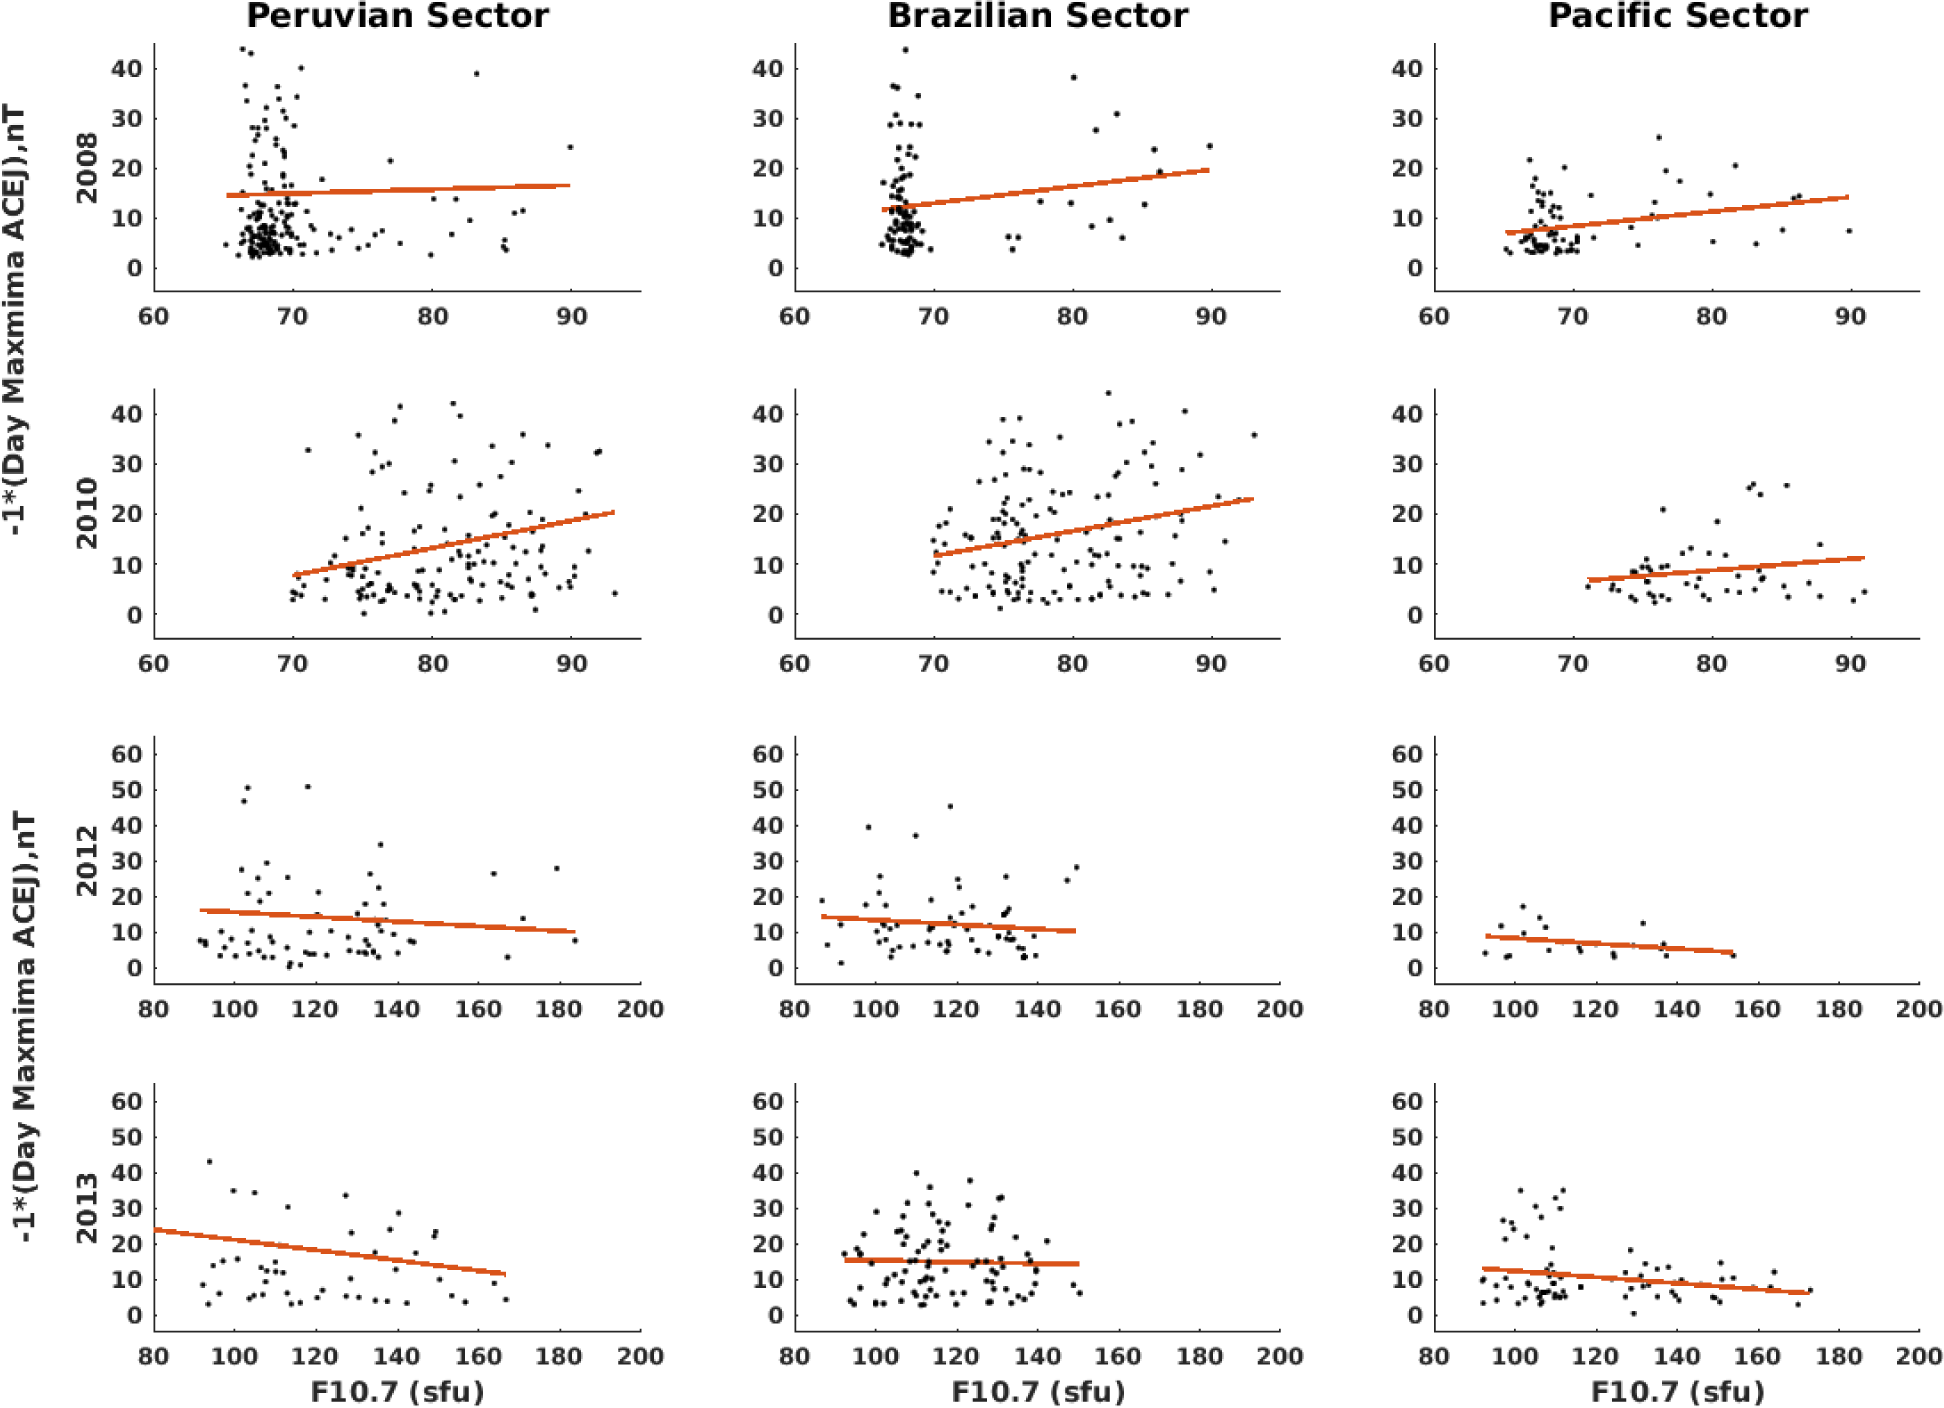
The results presented in Figs. 2 and 5 demonstrate that the amplitude of the EEJ during the maximum solar cycle periods, the EEJ intensity was higher than during the minimum solar cycle. The statistical analysis results indicate that during a geomagnetic quiet period a substantial positive correlation between EEJ intensity and solar flux during the rising period of the solar cycle in all eight longitudinal sectors (seen Figs. 4 and 5). Specifically, for the high-activity period, strong positive correlations were observed between solar flux (measured by F10.7 cm radio fluxes) and EEJ current strengths in the Peruvian, Southeast Asian, and Philippine sectors, followed by the Pacific sector. This suggests that the effect of solar flux on the variation of EEJ is observed on a global scale regardless of regional differences. Significantly lesser magnitude correlations were observed for the Brazilian, West African, East African, and Indian sectors, while the lowest correlations were obtained in the Brazilian and African sectors indicating that their responses may governed by the MCEJs/ACEJs and local factors as well. Additionally, the plots and linear correlations between both parameters, the day_maxMCEJ/ACEJ variation and F10.7, are shown in Figs. 6 and 7.
As clearly observed in Fig. 5, there is a strong correlation between solar flux and the variation of EEJ during the inclining period of solar cycle 24 (2011).
Plotting the same monthly means of EEJ, MCEJ versus the corresponding flux strength shows a tendency of decreasing ACEJ with increasing flux strength (Fig. 7). There is limited evidence to suggest that solar flux has a significant effect on the variation of ACEJ. Correlations between ACEJ and different indices of solar activity (such as the F10.7 index) have been found, but these correlations are usually fairly weak. The findings during solar cycle 24 (January 2008–December 2013) reveal that MCEJ was dominant, and ACEJ was negatively correlated with the ascending phase of solar cycle 24. These results are consistent with the earlier studies conducted between 2008 and 2018 (Soares et al. 2018b, 2019). The observed anti-correlation of ACEJ at HUA, TTB, and YAP with solar flux (Fig. 7) agrees with previous results for HUA (Rastogi 1974; Marriott et al. 1979). In their study, Soares et al. (2018b) found that lower solar activity conditions are more favorable for the occurrence of ACEJ based on data from ground-based magnetometers. Similarly, Rastogi (1974) and Marriott et al. (1979) showed an anticorrelation between ACEJ events and sunspot numbers, while the relationship between MCEJ and solar activity is less obvious relation can be seen. They have suggested that lower levels of solar flux lead to reduced atmospheric ionization rates and ionospheric conductivities, resulting in weaker EEJ currents and a prevalence of downward plasma drifts in the afternoon (i.e., ACEJ events). Conversely, Gouin (1967) and Patil et al. (1990) suggested that higher MCEJ rates may be associated with solar maximum periods.
4. CONCLUSIONS
In this study, we have examined the comprehensive analysis of the daily, seasonal, and annual variations of EEJ and CEJ intensity dependence on solar cycle variation [as indicated by solar flux (F10.7) and sunspot numbers (R)] based on satellite ground-based magnetometer observations over the Peruvian, Brazilian, West African, East African, Indian, Southeast Asian, Philippine, and Pacific sectors during the magnetically quiet conditions (Kp < 3 & AP < 15) of solar cycle 24. To derive the EEJ/CEJs, we used paired dip-equatorial stations 1 min-averaged magnetic data. We also obtained a 1 min averaged Solar Index F10.7, Sunspot Number (new version), and the Kp Index data from the OMNIWeb Data Explorer. Given the prolonged solar minimum from 2008 to 2009, we divided our analysis into two separate periods, namely the low solar cycle period from January 2008 to December 2010 and the inclining phase of the solar cycle 24 period from January 2011 to December 2013. The sensitivity of EEJ intensity to solar cycle variation as indicated by solar flux and sunspot numbers is clear. On average, the results showed that the strength of the daytime EEJ has an increasing trained as F10.7 and sunspot numbers increased during the inclined period, compared to the low solar cycle period (seen in Fig. 2). During this period, we found that the Peruvian, Southeast Asian, and Philippine sectors specifically showed an increase in the strength of the daytime EEJ as F10.7 and sunspot numbers increased than the observed one in other longitudinal sectors, respectively. This is because the F10.7 and sunspot numbers are an indicator of solar activity levels that affect the day-to-day variations of the Earth’s ionosphere during different solar activity. The observed phenomena in the Peruvian, Southeast Asian, and Philippine sectors are a result of the equatorial ionosphere experiencing an increase in effective conductivity. On the other hand, during periods of low solar activity, moderate and weak variations in the EEJ current intensity are observed at different longitudinal sectors. I.e., during low solar cycle conditions, the F10.7 and sunspot numbers as well as EEJs experienced a decreasing trend. Moderate and weak EEJ strengths are observed in the Brazilian, African, Indian, and Pacific sectors during this inclined period. Furthermore, we also used appropriate statistical methods to calculate MCEJ and ACEJ rates and analyze the correlations between F10.7 and EEJ/CEJ amplitudes/peaks. It is worth noting that there is a direct correlation between solar flux effects and the variation of EEJ during the solar cycle at its maximum. Our findings indicate that there is a weak or no significant difference in the relation of MCEJs during the period of low solar activity compared to the period of high solar activity in the Peruvian, Brazilian, and Pacific sectors. For Peruvian sectors, our results are in agreement with the previous analysis by Habarulema et al. (2019). It also shows a significant decrease of ACEJ in intensities when compared to EEJ at high solar activities indicating an anti-correlation between ACEJ and F10.7. In our findings (Figs. 3, 6, and 7), the ACEJ has shown anti-correlation with the F10.7 in most of the regions we investigated while the morning counter EEJ MCEJ occurrence rates/correlations seem to be independent of F10.7 in most of the regions. This is because the tidal signatures are less clear in the morning CEJ events (Singh et al. 2018). Overall this research suggests that changes in the atmosphere due to solar flux influences the daily variation of EEJ and CEJ across various sectors depending on altitude, latitude, and solar activity levels. In addition to F10.7, the influence of various mechanisms, such as ionospheric tides, planetary wave oscillations, and the interaction of gravity waves, among others in the equatorial low latitude ionosphere, play for this longitudinal variation in the EEJ/CEJ during geomagnetic quiet days (Chandrasekhar et al. 2014). Overall, this study provides insight into how changes in solar activity can affect EEJ/CEJ intensity and suggests future research should further investigate sun-climate interactions. These results add to our understanding of how variations in solar flux influence local ionospheric variability.


