1. INTRODUCTION
The chemical and physical processes of plasma, the main components of the ionosphere, can be understood through the generation and disappearance of ions and electrons, and their transportation. Ions and electrons are generated mainly by high-energy photons from the sun consisting of X-rays and ultraviolet and sometimes by high-energy particles from the sun and outer space. If the energy of a photon exceeds the ionization energy (~12 eV) of a neutral particle, it can ionize the main constituent neutral gases in the upper atmosphere, and the excess energy causes an increase of the temperature of the thermosphere occupying the same space with the ionosphere. In addition, plasma extinction is achieved through a process of recombination in which molecular ions are dissociated and return to neutrality.
Ionization by solar radiation and chemical recombination alone cannot explain what happens in the actual ionosphere, since significantly more changes occur according to the day and night, and the change vary with the equatorial and the pole regions (Laštovička 2005). Physical events such as seismic activities and tsunamis are also known to affect the ionosphere (Ryu et al. 2014). The ionospheric phenomenon occurring in the polar region is greatly affected by solar activity and geomagnetic activity and the occurrence and shape thereof are complicated due to the strong magnetic field. On the other hand, typical phenomena occurring across equatorial and mid-latitude regions can be characterized by equatorial ionization anomaly (EIA) (Appleton 1946) and equatorial electro-jet (EEJ) in the dayside (Yamazaki & Maute 2017). Meanwhile, plasma bubbles occur in the night side equatorial region triggered by plasma instability causing communication blackout or errors in the GPS-based navigation system.
The most prominent feature of EIA is that plasma density is enhanced near the equator region relative to that of high-latitude regions, and density increases in the northsouth direction, characterized by the shape of camel backs, around the equator and usually lasts until night time. This results from plasma rise by E × B drift due to the Earth's magnetic field extending along the south-north meridional direction and the electric field generated in the west-east direction along the geomagnetic equator (Moffett & Hanson 1965). When the up-drifted plasma reaches altitude where electric field no longer exists, it descends by gravity along the magnetic field line creating two dense crests. This can be observed by radar observation on the ground or satellite insitu measurements usually by Langmuir probes (LPs).
Changes in the magnetic field due to the ionospheric current can also be observed along with a change in the plasma density. The current in the west-east direction in the vicinity of the geomagnetic equator in the dayside is called the equatorial electro-jet. The cause of this current is that the interaction between the radially-blowing neutral atmosphere and the ionosphere plasma develops a potential difference between the dawn and dusk region and then acts as an electromotive force for the current along the E-region. It can be measured by the magnetic field along the meridian plane and the position and strength of the EEJ also can be inferred.
The two phenomena EIA and EEJ have the same origin, that is, the potential difference caused by the neutralplasma collision, but are expressed as different types of physical phenomena, current and plasma flow. Since their relationship is compounded by various factors such as solar activity, solar wind, geomagnetic disturbance, wind strength in the neutral atmosphere, and gravity waves starting from the troposphere, simultaneous observation of ionosphere plasma and magnetic fields is required.
To answer the above-mentioned questions, or at least to provide baseline data for this, Ionospheric Anomaly Monitoring by Magnetometer And Plasma-probe (IAMMAP) was proposed and selected as a science payload of the CAS500-3 satellite to be launched in 2024 and the Engineering Quality Model (EQM) is currently under development. This paper examines previous observations related to EIA and EEJ to derive the instrument requirements and specifications and introduces the design, development, and test results of prototypes.
2. PREVIOUS OBSERVATIONS OF EQUATORIAL IONIZATION ANOMALY (EIA) AND EQUATORIAL ELECTRO-JET (EEJ)
As noted above, the EEJ and EIA both originate from potential difference developed by charge separation between the dawn and dusk side of the E- and F- region of the ionosphere. Since the ionosphere is basically embedded in the thermosphere, neutral particles and ionized species interact with each other through kinetic collisions and chemical reactions. The prominent feature in the dayside thermosphere is the radially-blowing neutral wind from the sub-solar point triggered by the pressure gradient caused by solar heating. When the neutral wind blows with a speed U0 in the magnetized plasma, the polarization electric field, E = U0 × B, drives the current J in the direction orthogonal to both U0 and B. The mechanism of the charge separation and the consequent potential difference is briefly depicted in Fig. 1. As shown in Fig. 1(a), the directions of the current are largely from the dusk to the dawn direction, or westward direction, positive charges are accumulated in the dawnside ionosphere.
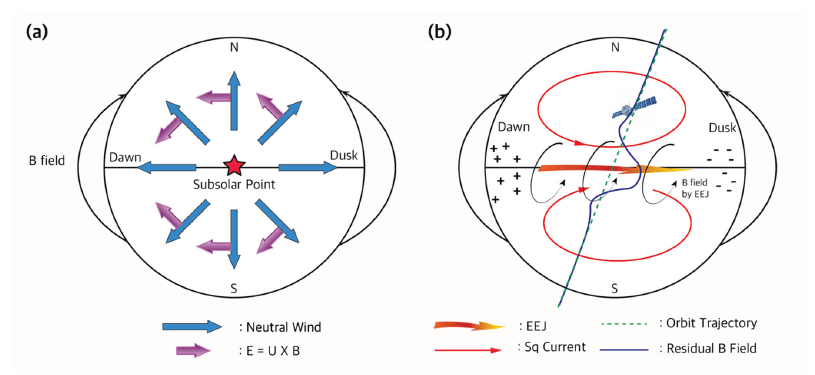
Once the large potential difference, or electric field, develops between the dawn and dusk, consequent current can flow along the geomagnetic equator since the ionospheric plasma act as a conductor. The governing equation of this current is J = σPE, where σP represents the Pederson conductivity which relates the current in the parallel direction to the electric field. The local Pederson conductivity can be expressed as follows (Evans et al. 1977):
where ne is the electron density, Ci is the relative concentration of ion species i, υin is the collision frequency between the ion and neutral particle, ωi is the ion gyrofrequency, υe is the sum of electron–ion and electron–neutral collision frequencies, and ωe is the electron gyrofrequency. In addition to the Pederson current, vertical electric field produced to compensate a downward Hall current (σHE), in turn, strengthen the Hall current in the same direction (dawn to dusk) with the larger effective zonal conductivity (Yamazaki & Maute 2017) of , which is called the Cowling conductivity.
Lam et al. (2019) estimated the vertical profile of Pederson conductivity derived from a white-light allsky imager and the Poker Flat Incoherent Scatter Radar. The Pederson conductivity has its maximum of 10–4 mho (siemens/m) at around 100 km and decreases in logarithmic scale as the height increases. This suggests that EEJ current flows at the altitude, corresponding to the E-region, where the Pederson conductivity is relatively larger than the other altitudes and this is consistent with previous observations of the magnetic field intensity on the ground and by satellites. It remains unanswered whether the EIA can relieve the potential difference by doing actual work to the ionosphere or thermosphere as the EEJ does. Alken & Maus (2010) reported that the EEJ strength and the eastward electric field are proportional to each other although the nonlinearity exists. During daytime, the eastward electric field drives a vertical plasma drift at the magnetic equator creating the EIA. Since the eastward electric field is also the driving force for the Equatorial Electrojet (EEJ), the latter should be positively correlated with the EIA strength. Meanwhile, Stolle et al. (2008) pointed out that there exist exceptions. This can be eventually tested by the intensities of the features competing with each other once the other parameters are fixed. However, it will not be an easy question to answer in the near future, since the ionosphere is sensitive to many parameters as mentioned above.
In the F-region where the electron density is even higher with greatly-reduced Pederson conductivity, the electric field developed in the zonal direction play a different role in the dynamics of the ionospheric plasma. Instead of direct current as EEJ, E × B drift especially in the vicinity of the equatorial region results in increased electron density in the F-region, where most of the low-earth orbit satellites are operated.
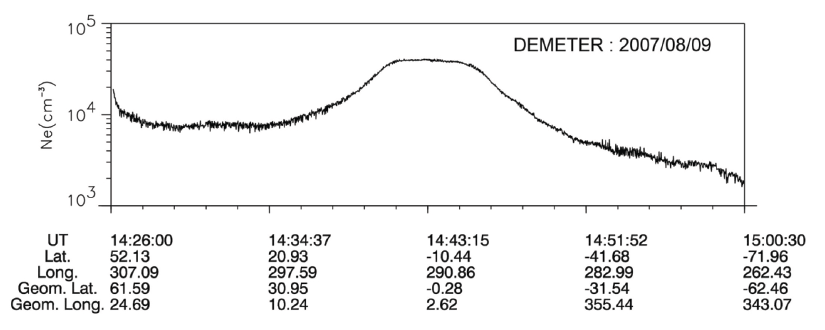
The enhanced electron density in the equatorial region is easily observed by polar-orbit satellites with plasma probes. As an example of the observation of EIA with satellites, the electron density profile measured by Instrument Sonde de Langmuir (ISL) on the Detection of Electro- Magnetic Emissions Transmitted from Earthquake Regions (DEMETER) satellite (Lebreton et al. 2006) is shown in Fig. 2. The DEMETER satellite collected data about the ionospheric plasma in a Sun-synchronous orbit at an altitude of 710 km at the time of the launch. The orbit was lowered to 660 km in December 2005, without changing the ascending node. This made it suitable for studying global ionospheric disturbances at fixed local times centered on 10:30 LT (daytime) and 22:30 LT (nighttime). As shown in Fig. 2, the electron density is much larger near the equator region compared with those of mid-latitude or polar regions on the order of ~10, although the detailed structure varies as a function of solar activity, geomagnetic disturbance, location, and time. However, the Ne profile in the DEMETER case, does not show the “crest-trough” structure, which is shown in the CHAMP measurements as Stolle et al. (2008) reported. It is already known that the latitudinal profile of the EIA varies according to the satellite altitude. At the altitude of the DEMETER satellite (710 km at the time of the launch and lowered to 660 km later) where the uplifted plasma begins to bifurcate along the geomagnetic field lines, the latitudinal profiles of the electron density do not exhibit a clear “crest-trough” structure, contrary to observations of the CHAMP satellite at altitude of less than 400 km.
At the geomagnetic equator (dip equator), the magnitude of the daily variation of the geomagnetic field horizontal component H is about 2 to 2.5 times higher than that observed at middle latitude. This phenomenon was discovered in Huancayo (Peru) in 1922 (Chandra et al. 1971) and was attributed to an intense ionospheric current that flows eastward. Later, this current was named an equatorial electrojet by Chapman (1951) and has been studied based on ground, rocket, and satellite observations. EEJ and Sq current observed in the dayside are not easy to detect, since the magnitudes are much less than those of geomagnetic field, the so-called main field or a geomagnetic disturbance caused by magnetospheric variation. Satellite observations have superiority in that they pass very wide regions in a very short time and thus allow quasi-real-time observation along the meridional plane while the measurement is limited in-situ and can be disturbed by noise from satellite itself and geomagnetic activities. In addition, they are distanct from the current source, usually located in the E-region ionosphere at about 90–150 km heights.
To investigate the feasibility of detection of EEJ and derive the requirements of the detection instrument, the magnetic field data of SWARM (Macmillan & Olsen 2013) were analyzed as, shown in Fig. 3. Among the three satellites, SWARM-A data of, 2022 are shown as an example when the satellite local time of ascending node (LTAN) is approximately 12:00. The nominal altitude of SWARM-A is 450 km. Derivation of the B field component generated by EEJ is processed in four steps as shown in Figs. 3(a)– (d). To eliminate the main field, the geomagnetic field line was derived using the International Geomagnetic Reference Field (IGRF) model (Alken et al. 2021) along the orbit trajectory as shown in Fig. 3(a). The total B field measurements by SWARM-A are shown with IGRF. As presented in the graph, the difference between the model and measurement is not noticeable, thus showing that the IGRF model reproduces the geomagnetic field well. The geomagnetic field varies from 3 to 5 × 10⁴ nT according to the latitude. The residual component, or the observed value minus the IGRF, was then derived as given in Fig. 3(b). A small bump near the equator can be identified. Since the residual component still contains other effects from Sq current and polar current, the residual B component trend, except for at the equatorial region is approximated by polynomial fitting as shown in Fig. 3(c). Finally, the polynomial component is subtracted from the residual field and the EEJ component curve is fit with the theoretical B field generated by wired current defined by the Biot-Savart law as follows:
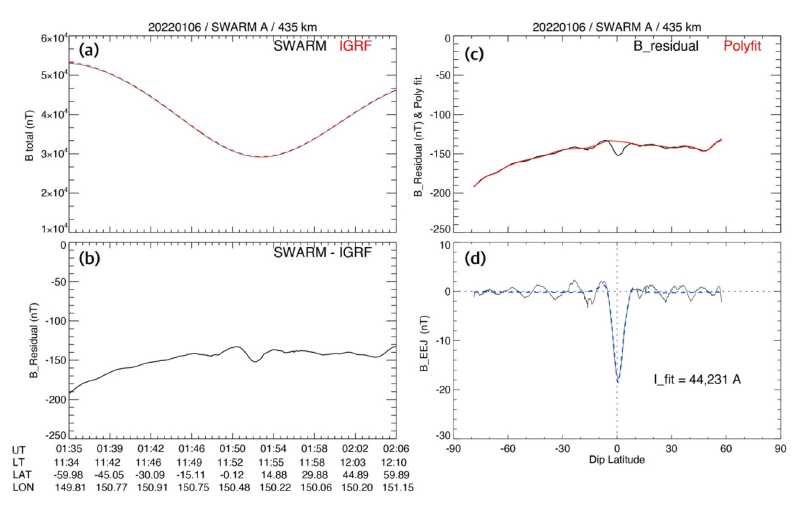
where μ0 is the magnetic constant, r0 is the vertical distance from the EEJ current to the satellite trajectory, and x is the meridional position of the satellite from the dip equator. The magnetic field component of the EEJ is about 15 nT and the current is estimated to be 44 kA in this case. Further analyses are required to understand the variation of EEJ, but the scope of the present analysis is limited to a typical example to focus on the design of a proper instrument for IAMMAP.
To successfully observe EIA and EEJ from a satellite, there are some issues to overcome with regard to both the plasma probe and magnetometer. In the case of the plasma probe, Oyama (2015) pointed out there are two major issues to be addressed for proper measurement using a LP: contamination of the electrode surface and the surface area of the satellite. As for the contamination effect, a probe with a contaminated surface can show a different path, called hysteresis, when the probe bias is swept in order to obtain the current-voltage characteristics. However, this issue can be partly mitigated by sweeping the DC LP voltage with a frequency high enough (~10 Hz) to remove the hysteresis.
The issue of the surface area of the satellite is even more critical since there have recently been more attempts to develop smaller satellites as CubeSats with LPs. As satellites become smaller, the conductive surface area of the satellite used as a counter electrode becomes insufficient. As the voltage of the electrode increases with respect to the satellite ground frame, currents due to ambient electrons increase. Accordingly, the satellite potential becomes further negative to collect more ions from the ambient plasma to cancel the electron current flowing out from the electrode. This finally distorts the I–V characteristic curve from which the electron density and temperature are derived; Fang et al. (2018) estimated the distortion as a function of Γ, the probe to satellite surface area ratio.
An alternative solution for proving ionospheric plasma, free from the above limitations, is using an Impedance Probe (IP) and measure the plasma impedance as a function of frequency. The IP technique (Wakabayashi et el. 2013;Blackwell et al. 2015;Spencer & Patra 2015) entails measuring the frequency-dependent impedance or admittance of an antenna in a magnetized plasma with imposition of a frequency sweeping signal. The impedance curve of the ionospheric plasma shows several resonances with a maximum impedance at the upper hybrid frequency, which is defined as follows:
where, ωuh is the upper hybrid resonance, is the plasma frequency, and Ωce = eB0 / me. The above relationship between the plasma parameters implies that if fUHR (upper hybrid resonance frequency) is measured while knowing the magnetic field, the electron density can be derived precisely. To compare the value with traditional LP, a disk-type LP, which was designed for NEXTSat-1 will be included for cross-reference.
As for the magnetometer, the resolution of the measurement should be less then 1 nT as noted in the previous section. To minimize the magnetic contamination from the satellite itself, three identical fluxgate magnetometers are arranged around the satellite body. In particular, two of them are mounted at the end of solar panels securing the farthest distance from the satellite body where high current-consuming modules are populated. The principal component gradiometer technique (Constantinescu et al. 2020) with three fluxgate magnetometers allows a lessened magnetic cleanliness program and shorter boom length.
The key parameters required for the IAMMAP instrument to meet the scientific goals are summarized in Table 1. The signal to the IP probe antenna is swept from 0.1 to 10 MHz. For the purpose of calibration, the sweep frequency can be extended up to 20 MHz to check the antenna resonance at 15 MHz, which does not vary in different plasma environments. The mission orbit will be determined in the range of 500–600 km.
3. IAMMAP INSTRUMENT DESIGN AND PROTOTYPE TEST RESULTS
To develop the IAMMAP instrument as a science payload for CAS500-3, we have developed a prototype to demonstrate the basic function of the IP and magnetometer as required by the scientific objectives. The configuration of the IAMMAP electronics is shown in Fig. 4. Power of +28 V is supplied from the spacecraft through an internal low voltage power supplier. IAMMAP is composed of a set of magnetometers (Adaptive In-phase MAGnetometer, AIMAG), a LP and an IP, and each of them has its own micro-controller to function independently. The commands and telemetries from/to the on board computer and observation data to the mass memory storage referred to as Image Date Handling Unit (IDHU) are transferred via an interface board as shown in Fig. 4.
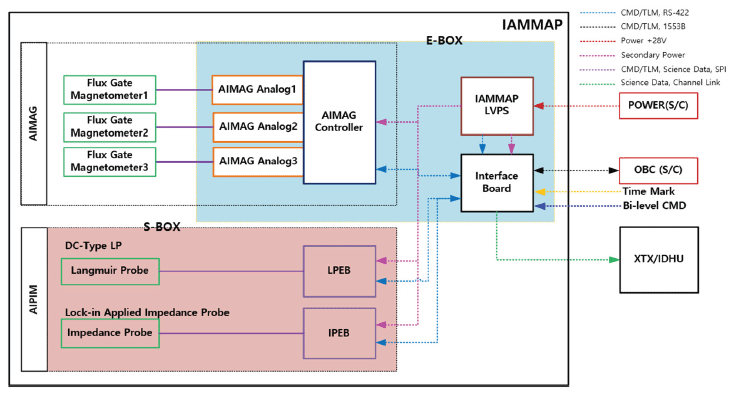
As described in the previous section, AIMAG consists of three identical fluxgate magnetometers mounted around the satellite body and on the solar panel wings. To generate the signal for the driving coil and to obtain signal from the pick-up coil, three analog circuits are driven by the AIMAG controller. The prototype development and the initial test results are briefly introduced in the next section. The EQM is currently under development.
A new type of IP utilizing a helical antenna was devised through empirical efforts. A helical antenna is thought to be suitable for identifying the upper hybrid frequency where the plasma impedance is very high. In this paper, a detailed analysis of the antenna and plasma impedance characteristics will not be introduced. Instead, the resultant impedance curve of the plasma combined with the antenna itself is shown in Fig. 5. Based on the monumental works of Balmain (1964) and Aso (1973), the analysis is improved to reflect the effect of the antenna and circuit design and will be introduced in follow-up papers in detail.
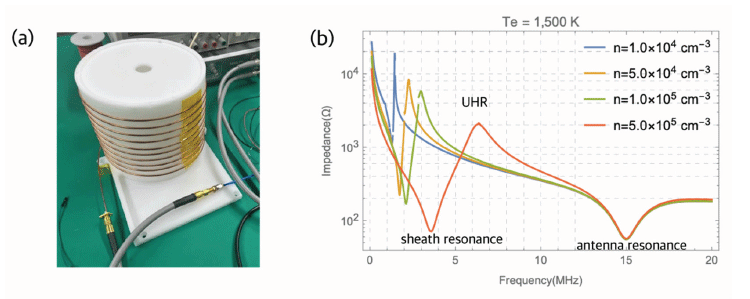
The prototype of the helical antenna that acts as a probe for the IP is shown in Fig. 5(a). Copper wire is wound in a helical shape around a cylindrical structure made from Teflon, which is a nonconducting material and thus does not affect the antenna or ambient plasma. The graph in Fig. 5(b) shows the theoretical impedance curve calculated by considering the combined effects of plasma and antenna geometry where these are connected in parallel. It is clearly seen that the upper hybrid frequency increases as the electron density increases, which is consistent with the plasma frequencydensity relationship. At sheath resonance, the impedance is lowered since the plasma sheath formed around the antenna will act as a capacitance. The antenna resonance at around 15 MHz which is basically defined by the total length of the helical antenna does not change when the plasma parameters change. The characteristics, in turn, can be used for onboard calibration if the frequency sweep is extended up to 20 MHz to check the functioning of the electronics. In normal observation mode, the frequency sweep range will be limited to under 10 MHz to secure the measurement resolution and sampling frequency of 1 Hz.
The prototype design and test results of the IAMMAP IP are shown in Fig. 6. To measure the impedance of the plasma, a capacitor bridge with a superheterodyne scheme is applied to reduce the noise. To sweep the frequency in a sampling time of one second, a direct digital synthesizer chip AD9913 is employed, which can generate a repeated frequency sweep based on an external clock. Among various impedance measuring method, the capacitance bridge circuit is suitable for ionospheric plasma probing in that it is sensitive to high plasma impedance. The voltage output from the circuit is reciprocal to the impedance and thus the output becomes lower at the upper hybrid resonance.

Fig. 6(b) shows the test results obtained with the prototype which includes the overall analog circuit. The IP circuit connected with the helical antenna shown in Fig. 5(b) is put in the plasma chamber (Ryu et al. 2017) and a frequency swept RF signal is imposed to the antenna with varying electron density. The plasma generator used in the experiment is a back-diffusion type with pure nitrogen gas employed as the ionizing medium, which can simulate similar plasma conditions to those of the ionosphere. The electron density can be controlled by adjusting the grid voltage and the anode current is directly proportional to the electron density. When plasma does not exist in the chamber, the output from the IP circuit does not show any resonance as depicted by the black line in Fig. 6(b). Meanwhile, as the electron density increases, the signature of the resonance, the lowered bump in the curve, appears clearly and the frequency increases as expected. The sensitivity will be increased by adjusting the circuit design and parameters of the analog parts. The profile of the impedance as a function of time measured every second will be sampled at 1,000 points with a 16-bit CMOS ADC (AD7671) that provides 1 Mega Samples Per Second capacity.
The prototype of AIMAG, a set of fluxgates, is designed and manufactured to assess whether the performance meets the science requirements presented above. An important technical feature of AIMAG is that a ring-core type and voltage output circuit was adopted with a tuned capacitor near the core to raise the signal-to-noise ratio of the signal. To lessen the temperature dependance of the fluxgate, a newly devised ‘in-phase’ concept with feedback was implemented in the pick-up circuit for stabilized measurements.
The designed and manufactured prototype of the fluxgate unit for AIMAG is shown in Fig. 7(a). Each unit has two ring cores to obtain three axis magnetic field data and the bracket for mounting at the edge of the solar panel is shown together. For thermal isolation from the solar panel, thermal insulators made from G10 material, which has the lower thermal conductivity of 0.4 W/m⋅K is inserted between the fluxgate support and the bracket that actually contacts the solar panel.
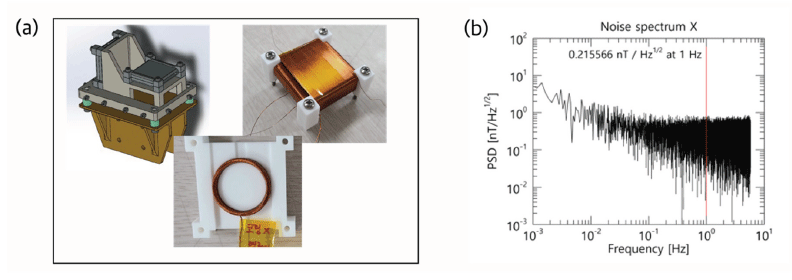
The noise characteristics of the prototype that determine the performance of B-field measurement were measured in a magnetic shielding can (TLMS-C100) which reduces the ambient magnetic disturbance by a factor of 1/1,000. Fig. 7(b) shows the noise spectrum measured for the prototype magnetometer with a noise level of ~215 pT/, which satisfies the science requirement of 300 pT/. However, environmental tests and precise alignment will be performed in the near future through the stages of EQM and FM development to improve the performance.
4. SUMMARY AND CONCLUSIONS
To investigate the possible correlation of EIA and EEJ, a set of science instruments referred to as IAMMAP was proposed and selected as a payload of CAS500-3 which will be launched by Korean Space Launch Vehicle (KSLV) in 2025. The major scientific goals of the instrument are described and the requirements to meet the scientific goal were then derived based on previous observations with a plasma probe and a magnetometer. The newly devised instruments, which are expected to improve the precision of the measurements, especially the plasma density, were designed and prototypes were manufactured to demonstrate the measurement concept does work.
The IP prototype with a helical antenna successfully could provide the impedance profile as a function of frequency and the upper hybrid frequency, which is directly connected to the electron density with simple arithmetic manipulations. The IAMMAP IP is expected to show the possibility of replacing typical DC type LPs by virtue of an advantage that it is free from major problems of the LP. In particular, it should be acknowledged that the impedance measurement of the ionospheric plasma is independent of the size of satellites, which provide an electric ground to the probe. The performance of a prototype of the AIMAG magnetometer with an ‘in-phase’ circuit concept surpasses the requirement to observe the tiny magnetic field component formed by the EEJ. It is not possible to assert that IAMMAP is more suitable for EIA and EEJ studies than the SWARM satellites or CHAMP, since the altitude of CAS500- 3 is lower and thus require low-noise B-field measurement. However, it will provide the more precise electron density in the F-region. Since the ionosphere at lower altitude, where SWARM and CHAMP are orbiting, is expected to be more sensitive to the local neutral wind, the observation of IAMMAP at higher altitude could be advantageous in that the electron density measured in CAS500-3 orbit is purely sensitive to the eastward electric field that drives the EIA.
The engineering qualification model of IAMMAP is currently being developed and the flight model will be manufactured in the subsequent year. We are expecting that IAMMAP will provide valuable data for ionospheric research and will provide the possibility for evolution of ionospheric measurement once the concept is verified with successful operation and the instrument can be minimized to be suitable even for constellated CubeSats in the future.


