1. INTRODUCTION
Telescopic sunspot records form the longest dataset to trace solar variations on the time scale of about 400 years, revealing both periodic and secular changes in time (Váquero & Vázquez 2009). Among reported quasiperiodic cycles of ~1.3 years (Howe et al. 2000), ~44 years (Javaraiah 2003), ~53 years (Le & Wang 2003), ~80–90 years (Gleissberg 1971), and ~65–130 years (Nagovitsyn 1997), the 11-year solar cycle discovered by Schwabe in 1844 is of particular interest in the sense that it is immediately related to terrestrial weather and climate (Eddy 1976;Cho & Chang 2008;Park & Chang 2013;Moon et al. 2014;Svensmark et al. 2017;Kim et al. 2018;Chang 2019;Kim & Chang 2019), not to mention the space environment of the Earth (Forbush 1954;Solanki et al. 2004;Usoskin 2008). It is evident that the temporal distribution of the observed sunspot with the 11-year periodicity has an asymmetric shape with a shorter ascending phase. In addition, the shape of individual 11-year solar cycle may vary, whose mean duration of a cycle is ~11.02 years, with a standard deviation of ~1.2 years and mean amplitude of 13-month boxcar averages of the monthly averaged sunspot numbers is ~113, with a standard deviation of ~40 (e.g., Petrovay 2010). These irregular variations make the prediction of the solar cycle challenging and intriguing, though its accurate prediction is important due to its impact on the human life. As a result of studies with the observed sunspot data, several empirical relationships between the value of some measure of solar activity are found to be used for prediction purposes. For example, anticorrelation between solar maximum amplitude and the duration of different phases of a solar cycle, known as the Waldmeier effect, as well as correlation between the solar maximum amplitude for an odd cycle and the solar maximum amplitude of the preceding even cycle, known as the Gnevyshev effect, have been widely investigated.
It has been proposed to use the number of active days with sunspots detected on the visible disk of the Sun, or otherwise equivalently spotless days, at the solar minimum as an indicator of the level of activity of the upcoming solar maximum (Harvey & White 1999;Usoskin et al. 2000, 2001, 2004; Hamid & Galal 2006;Pesnell 2012;Váquero et al. 2012). Having been motivated by a linear relationship between sunspot numbers and the monthly number of active days in percentage around the solar minimum (e.g., Hoyt & Schatten 1998;Váquero et al. 2012), Chang (2013) statistically examined an idea how the monthly observed sunspot number at the solar maximum is correlated with the slope of the linear relationship between the monthly sunspot numbers and the monthly number of active days in percentage for the corresponding solar cycle. The following is how one may expect a correlation between the level of solar activity and the slope of the linear relationship between the monthly sunspot numbers and the monthly number of active days in percentage. The monthly number of active days in percentage is calculated by taking a ratio of the number of active days to that of observing days in a specific month. Generally speaking, the monthly number of active days in percentage is almost always 100% around solar maxima, while it remains very low or even zero during solar minima. According to the Waldmeier effect, there is anticorrelation between the duration of the ascending phase of a solar cycle and its amplitude. What it could imply is that when a strong cycle is to be followed the sunspot is expected to emerge somehow abruptly after a short period of the inactive solar minimum with spotless days. When a relatively quiet solar minimum period prevails, on the contrary, such a slope during an active phase for a weak solar cycle is expected to be less steep. Based on the result of Chang (2013), however, even though the slope of the linear relationship is found to be less steep when solar cycles belonging to the Modern Maximum covered by solar cycles 17-23 in comparison with rests of solar cycles, weak anticorrelations are only found for individual cycles so that the simple relationship turns out to be insufficient as a robust method to predict the solar activity amplitude.
In this paper, the relationship between solar cycle parameters and the linear slope of the monthly sunspot numbers as a function of the monthly number of active days is statistically explored. In addition to the monthly observed sunspot number at the solar maximum (Chang 2013), we have further examined the duration of the solar cycle and the duration of the ascending phase. Unlike the previous analysis, we have used a new version of carefully calibrated sunspot numbers which are publicly available since 2015. Another merit of this study is that we have compared the relationship with not only the new version of the sunspot number dataset but also the group sunspot number dataset. Although the group number is not completely independent of the sunspot number, we would like to consider the relationships with two different indices of solar activity as for calibrations since they present some differences in some periods, especially in the historical days (Clette et al. 2014). We note that one may wish to avoid counting the spotless days belonging to the previous solar cycle, or, at least, to know how much such a pollution affects the final conclusion, when one calculates the slope of the linear relationship between the monthly sunspot numbers and the monthly number of active days in percentage (AD) during the minimum in order to correlate with the characteristics of the solar cycle. To respond to this kind of concern here, when we calculate the slope of the linear relationship between the monthly sunspot numbers and the monthly number of active days in percentage, we have counted the active days in three different ways: counting the active days (i) in the period covering solar minimum ± 2 years, (ii) only in the 2-year period of the ascending phase, (iii) only in the 2-year period of the descending phase.
This paper is organized as follows. We begin with brief descriptions of revised version of the observed sunspot data that is analyzed in the present paper in Section 2. We present and discuss results based on the correlation between solar cycle parameters and the slope of the linear relationship between the monthly sunspot numbers and the monthly number of active days in percentage in Section 3. Finally, we summarize and conclude in Section 4.
2. DATA
The analyzed data in the present paper are the daily sunspot number obtained from the Sunspot Index and Long-term Solar Observations (SILSO) (http://sidc.be/ silso/datafiles), in which data can be freely downloaded with an explicit credit to the Royal Observatory of Belgium. Since 1982, the Solar Influences Data Analysis Center (SIDC) which is a department of the Royal Observatory of Belgium has collected observations from various stations worldwide in order to calculate the International Relative Sunspot Number for developing the knowledge of the long-term variations of solar activity, as a reference input to studies of the solar cycle mechanism (Berghmans et al. 2005;Váquero 2007). Even though the entire sunspot dataset since 1818 has been available as text files for a long time, issues to recalibration of the sunspot number observed by different observers in different times have been raised in long discussions by several researchers (e.g., Clette et al. 2015). In the end, on 1st of July in 2015, the sunspot number series has been revised by a new version that includes several corrections of past inhomogeneities in the time series. Following the recalibration of the data series, three main innovations come with the new sunspot number series whose version is numbered 2.0. The most prominent modification is dropping the conventional 0.6 scale factor by the choice of a new reference observer, A. Wolfer instead of R. Wolf. This adjustment leads to an increase of about 45% of the recent part of the series after 1947. The group number time series is also distributed next to sunspot datasets. Instead of the original group number series by Hoyt & Schatten (1998), alternate group numbers of version 2.0 are noted sharing steady secular trend in solar cycle amplitudes with the sunspot number series (see, Clette et al. 2015;Cliver & Ling 2016;Svalgaard & Schatten 2016;Usoskin et al. 2016).
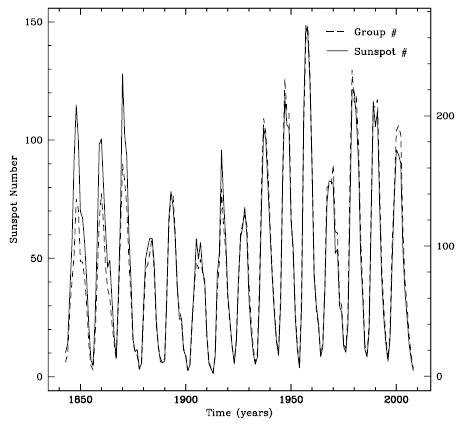
In Fig. 1, we show yearly total sunspot numbers and yearly group numbers from 1843 to 2008, which correspond to the beginning of solar cycle 9 and to the end of solar cycle 23, as a function of time (temporal characteristics of solar cycles are summarized in Table 1). We have chosen this period simply because all the data we need for comparison are completely provided only for this period. Solid and dashed curves are yearly total sunspot numbers and yearly group numbers, respectively. Scales of vertical axes on the right and left represent yearly total sunspot numbers and yearly group numbers, respectively. For the yearly group numbers, based on the work of Hoyt & Schatten (1998), the database containing a revised collection of the number of sunspot groups from 1610 to 2010 is compiled (Váquero et al. 2016). It should be reminded that the daily total sunspot number is defined by the formula: R = Ns + 10 × Ng, with Ns the number of sunspots and Ng the number of sunspot groups counted over the entire visible solar disk. No daily data are provided before 1818 because of too sparse observations in early days.

3. ACTIVE DAY AND SOLAR CYCLE
In Table 2, we list the correlation coefficients with the rejection probability, resulting from the maximum solar sunspot number of a given solar cycle and the slope of the linear relationship between the monthly sunspot number and the monthly number of active days in percentage for the corresponding solar cycle. For comparison, the Pearson’s linear correlation coefficient r, the Spearman’s rank-order correlation coefficient rs, and the Kendall’s τ coefficient with the rejection probability are provided. As mentioned above, we have calculated the slope for the given solar cycle in three different ways, namely, by counting the spotless day that occurred during the ascending phase and the descending phase of the solar cycle separately, and during the period corresponding to solar minimum ± 2 years as well. The rejection probabilities are greater than ~30% for all cases and, thus, the obtained correlation coefficients have barely statistical significance. Hence, as reported earlier in Chang (2013), it is hard to tell that the maximum solar sunspot number of a given solar cycle is correlated with the slope of a linear function of the monthly sunspot numbers and AD based on the analysis of newly revised sunspot number datasets again. As seen in Table 2, this conclusion is unchanged no matter how we count spotless days to calculate the slope of the linear relationship between the monthly sunspot number and AD. In order to check how our result depends on the fitting procedure in obtaining the slope of the linear relationship between the monthly sunspot number and AD, we have repeated the whole process with datasets of AD < 30% instead of AD < 50%. It turns out that results are quite similar each other.

|
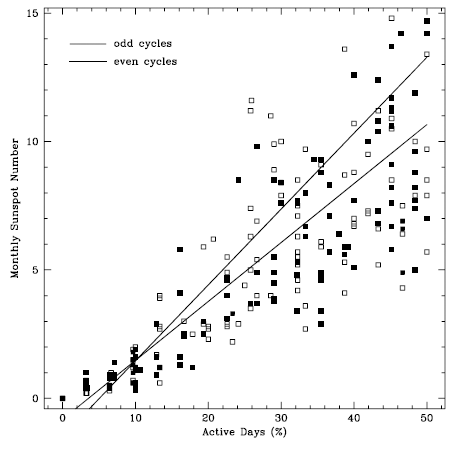
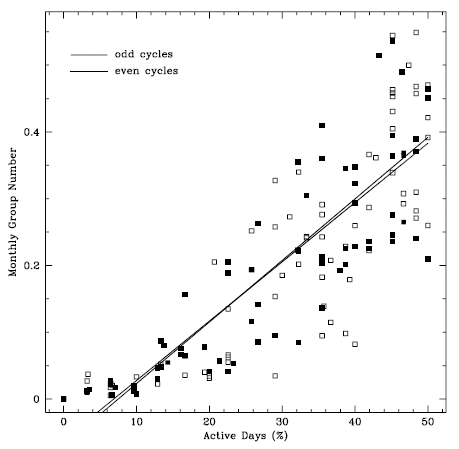
In Fig. 2, as an illustration, we show the monthly sunspot numbers as a function of the monthly number of active days in percentage, being computed with the daily sunspot numbers recorded from 1843 to 2008. We only show a part where AD is ≤ 50% since we employ that part in obtaining the slope of the linear relationship between the monthly sunspot number and AD for a specific solar cycle. Note that the monthly number of active days in percentage only shows a linearity when AD is low. For this reason, we are consequently apt to consider the time interval around solar minima. In this plot, filled and open squares result from the even and odd solar cycles, respectively. Thick and thin lines represent the best fits obtained by the method of least squares corresponding to the even and odd solar cycles, respectively. The slopes of the linear relationship between the monthly sunspot numbers and AD are 0.2293 ± 0.013 and 0.2952 ± 0.011 for the even and odd solar cycles, respectively. We reiterate the fitting process for AD < 30%. As for AD < 30%, the slopes of a linear function of the monthly sunspot numbers and AD are 0.2070 ± 0.016 and 0.2729 ± 0.015 for the even and odd solar cycles, respectively. According to this plot with sunspot numbers, it is found that the slope resulting from odd cycles is a little bit steeper than that resulting from the even cycles. In Fig. 3, similar to Fig. 2, we show the monthly group numbers as a function of the monthly number of active days in percentage. The slopes of the linear relationship between the monthly group numbers and AD for AD < 50% are 0.0089 ± 0.0002 and 0.0092 ± 0.0001 for the even and odd solar cycles, respectively. Slopes resulting from group numbers appear to be indistinguishable unlike the case of sunspot numbers, in the sense that the slope is slightly overlapped within the uncertainty. It is thus inconclusive that the slopes of the linear relationship between the monthly group numbers and AD are subject to the even and odd solar cycles.


In Table 3, similar to Table 2, we list the correlation coefficients with the rejection probability, resulting from the duration of a given solar cycle and the slope of a linear function of the monthly sunspot numbers and AD for the corresponding solar cycle. Unlike the maximum solar sunspot number, the duration of a solar cycle is found to be marginally correlated with the slope with the rejection probabilities less than a couple of percent for most cases. Three statistical tests consistently suggest the positive correlation. Hence, it appears that for a longer solar cycle the monthly sunspot number more rapidly increases with the monthly number of active days. This conclusion is insensitive to a way of counting spotless days as seen in Table 3. It may be noted that the Pearson’s linear correlation coefficient is smaller than the Spearman’s rankorder correlation coefficient only in the case where the descending phase is used in counting the spotless days. However, since these two tests are different measures it is not straightforward to understand its statistical significance. In Table 4, lastly, we list the correlation coefficients with the rejection probability, resulting from the duration of the ascending period of a given solar cycle and the slope of a linear function of the monthly sunspot numbers and AD for the corresponding solar cycle. Interestingly, results of the duration of the ascending phase are unlike those of the duration of a solar cycle. That is, the duration of the ascending phase is found to be unrelated with the slope of a linear function of the monthly sunspot numbers and AD.

|

|
4. SUMMARY AND CONCLUSIONS
We have studied the relationship between solar activity parameters describing solar cycles and the slope of the linear relationship between the monthly sunspot number and AD. This is one of efforts evaluating possibilities of use of the number of active days to predict the future solar activity. In addition to examination of how the maximum sunspot number of a given solar cycle is correlated with the slope of the linear relationship between monthly sunspot numbers and AD, we have further investigated the relationship of the duration of solar cycles and the duration of the ascending phase of solar cycles with the linear slope. Particularly, in this study we have utilized a new version of the sunspot number dataset but also the group sunspot number dataset available since 2015. In providing the Pearson’s linear correlation coefficient r, the Spearman’s rank-order correlation coefficient rs, and the Kendall’s τ coefficient with the rejection probability for comparison, we have calculated the slope for the given solar cycle in three different ways, by counting the spotless day that occurred during the ascending phase and the descending phase of the solar cycle separately, and during the period corresponding to solar minimum ± 2 years as well.
On the basis of obtained correlation coefficients with the rejection probability using the revised sunspot indices, our main findings are as follows:
-
(1) It is hard to tell that the maximum solar sunspot number of a given solar cycle is correlated with the slope of a linear function of the monthly sunspot numbers and AD. The rejection probabilities are greater than ~30% for all cases. This conclusion is insensitive to a way of obtaining the slope. Conclusion for the duration of the ascending phase is same with that for the maximum solar sunspot number. That is, chance probabilities are too high to conclude.
-
(2) On the other hand, however, it is concluded that the duration of a solar cycle is found to be marginally correlated with the slope with the rejection probabilities less than a couple of percent for most cases. Three statistical tests consistently suggest the positive correlation.
-
(3) We have also attempted to compare the relation of the monthly sunspot numbers with AD for the even and odd solar cycles. The slope resulting from odd cycles is a little bit steeper than that resulting from the even cycles when sunspot numbers are used. But, when group numbers are used, slopes resulting from group numbers appear to be indistinguishable. We conclude, therefore, it is debatable that the slopes of the linear relationship between the monthly group numbers and AD are subject to the even and odd solar cycles.


