1. INTRODUCTION
In accordance with the stellar evolution theory (Burbidge et al. 1957) chemical elements with atomic numbers Z>30 were synthesized mostly in rapid and slow nuclear processes (r- & s-processes) in stars. The slow process takes place in the interiors of red giant stars at the last stages of their evolution. The astrophysical sites for r-process are still under discussion. The most reliable places are supernova explosions and similar quick high-energy events. But later it was realized that internal physical processes in stars are not able to explain the variety of observed abundance patterns, especially for B-F type stars.
Many types of stars with non-solar chemical composition were discovered in the second half of the former century. It was proposed that the accretion from interstellar and circumstellar environment should strongly influence the observed surface abundances. As an examples it is possible to mention that Fowler et al. (1965) and Proffitt & Michaud (1989) pointed the importance of mass transfer from evolved binary companions; Drobyshevski (1975) and Cowley (1977) - the accretion of asteroids and planets. But the accretion on the surfaces of normal stars is still under investigation.
Yushchenko et al. (2015) investigated the possible signs of accretion of interstellar hydrogen and helium on the atmospheres of ρ Pup (δ Sct type star) and several hundred other B-F type stars. Note that the possibility of this type accretion was discussed earlier by Greenstein (1949), Havnes (1971a, b), Havnes & Conti (1971), and Böhm-Vitense (2006).
In this paper we will try to find the signs of similar accretion in the atmosphere of δ Sct type star V1719 Cyg (HD200925) using our observations.
2. HISTORY OF V1719 CYG
Alania (1987) found the values of metallicity [Fe/H]=0.3, effective temperature Teff=6,700–7,300 K, and surface gravity logg=3.20–3.40 for V1719 Cyg using uvbyβ photometry. The light curve is symmetric or even the descending branch is steeper than the ascending one (Joner & Johnson 1985). Later Johnson & Joner (1986) observed V1719 Cyg and obtained [Fe/H]=0.456–0.664, Teff=7,020 K, and logg=3.44. They are similar to the values by Peña et al. (2002) obtained from the uvbyβ photometry ([Fe/H]=1.020, Teff=6,400–7,300 K and logg=3.1–3.3).
Later the photometric properties and iron abundance of V1719 Cyg was discussed by Kim & Yushchenko (2011) based on a high resolution spectroscopic observation. The atmosphere parameters were found with the method described by Yushchenko et al. (1999) and Gopka et al. (2004).
The values for effective temperature, surface gravity, microturbulence velocity and iron abundance were found to be equal to Teff=7,300 K, logg=3.25, vmicro=3.8 km s–1, and logN(Fe)=7.44±0.08 (in the scale logN(H)=12) respectively. In particular, the value for iron abundance is close to the solar metallicity logN(Fe)=7.47–7.50 (Grevesse et al. 2010;Scott et al. 2015).
Luck (2015) found for V1719 Cyg the values Teff=6,642 K, logg=3.4, vmicro=3.1 km s–1 and logN(Fe)=–0.08. Note that V1719 Cyg is a variable star. The effective temperature can vary from 6,800 to 7,300 K, as it was shown by Kim & Yushchenko (2011). Maybe the spectrum of V1719 Cyg used by Luck (2015) was observed near to the minimum of its light curve. Kim & Yushchenko (2011) mentioned V1719 Cyg to have possible overabundances of several iron group elements such as yttrium, zirconium and lanthanides. They then suggested that it can be a metallic line (Fm) star in which iron abundance is close to the solar value, but the heavier elements are overabundant. Now, we report the detailed chemical composition of V1719 Cyg, obtained from the same high resolution spectra.
3. THE USED SPECTRUM AND THE ABUNDANCE ANALYSIS
Two high resolution spectra of V1719 Cyg were obtained from the Bohyunsan Echelle Spectrograph (BOES) at the 1.8 m telescope of the Bohyunsan Optical Astronomy Observatory in Korea. The signal to noise ratio (S/N) of the spectra is about 100, with the resolving power (R) of 45,000 and the wavelength coverage of 3,800 to 9,600 Å. The observations were carried out from the Julian dates of 2,454,740.115 and 2,454,740.187. The exposure times were 30 minutes for both observations. These moments corresponds to the phases 0.78 and 0.05 – near to the maximum of its light curve in accordance with Kim & Yushchenko (2011). The example of spectrum can be found in Fig. 1 of this paper and also in Fig. 6 of Kim & Yushchenko (2011) paper. The reduction of observations was described by Kim & Yushchenko (2011). In this paper we used the same spectra.
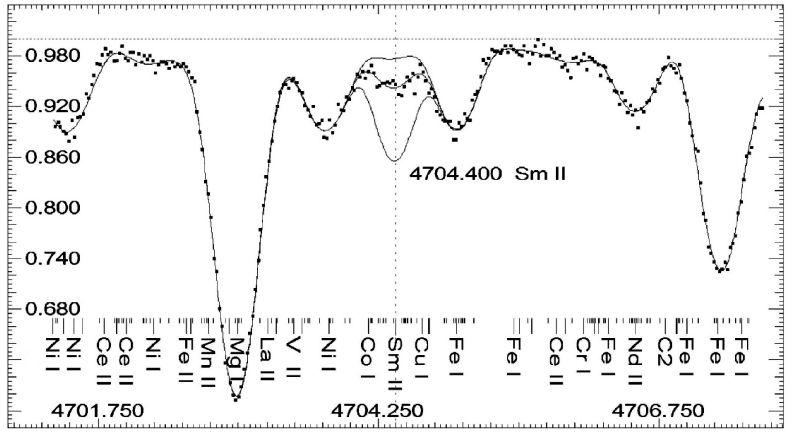
To determine the continuum level and to identify the various lines, the widely adopted Kurucz (1993) SYNTHE code was used to generate the synthetic spectrum for the whole observed wavelength region, using the stellar parameters obtained by Kim & Yushchenko (2011). The calculations of chemical abundances were made with the spectrum synthesis method. We used the last versions of Kurucz (1993) SYNTHE and Yushchenko (1998) URAN codes to make the fit of the observed spectrum by synthetic one in a semiautomatic mode. The observed spectrum was accepted to be the mean of two observed spectra. Both initial observed spectra were previously shifted to zero radial velocity.
The broadening of lines in the synthetic spectrum was made with instrumental (R=45,000) and rotational (v sin i=17 km s–1) profiles. The projected rotational velocity of V1719 Cyg was found by fitting the synthetic profiles convoluted with different values of this velocity to the observed profiles of clean lines of neutral iron.
For most of the lines we were able to find the counterparts in the solar spectrum. The abundances from solar lines were also found with the spectrum synthesis method. We used the Liege solar atlas (Delbouille et al. 1973) and Grevesse & Sauval (1999) solar atmosphere model. The adopted values of microturbulent and macroturbulent velocities for this model were 0.8 km s–1 and 1.8 km s–1, respectively. The same codes were used for synthetic spectrum calculations, line identifications, and abundance determinations.
To estimate the errors due to uncertainties of derived parameters all calculations were repeated four times. The first run was made with Kim & Yushchenko (2011) parameters, namely Teff=7,300 K, log g=3.25, vmicro=3.8 km s–1. The other three were done for atmosphere models with slightly shifted parameters, namely for those with the effective temperatures increased by 200 K, the surface gravity increased by 0.3 dex and the microturbulence velocity decreased by 1 km s–1. Atmosphere models were interpolated from Kurucz (1993) grid. Test calculations were made with Castelli & Kurucz (2003) models and no significant differences were found. Table 1 presents the mean values of abundances for 28 chemical elements, both relative and absolute, in the atmosphere of V1719 Cyg. The first two columns indicate the atomic numbers and the identifications of investigated species. The third column shows the number of used lines. The two subsequent groups of columns (eight columns in each group) present the mean abundances and its errors in the atmosphere of V1719 Cyg for four sets of atmospheric parameters, namely for the best values, and for effective temperature, surface gravity, and microturbulent velocity shifted by +200 K, +0.3 dex, and –1.0 km s–1, respectively. The first and the last groups of columns display the relative (*–⊙) and the absolute abundances. The last two columns of Table 1 are relative and absolute abundances of chemical elements in the atmosphere of V1719 Cyg taken from Luck (2015) survey.
4. DISCUSSION
The comparison of our and Luck (2015) abundances allows to claim that the agreement is satisfactory but the deviations need to be mentioned. The used values of effective temperature, surface gravity and microturbulent velocity of V1719 Cyg are different by ΔTeff = +658 K, Δlogg = +0.15, and Δvmicro = –0.7 km s–1, respectively. As it was mentioned here before, the big difference in temperatures can be easily explained by observations at different phases of the light curve.
The values of iron abundances coincide with high precision (as it was pointed in Introduction section), the differences for other 11 chemical elements are less than 0.15 dex, for 16 elements – less than 0.25 dex. The abundances of samarium differ by +0.28 dex, oxygen and neodymium – +0.30 dex, cobalt – –0.32 dex, scandium and manganese – –0.34 and +0.34 dex respectively, cerium – +0.35 dex, copper – +0.37 dex, and zirconium – –0.47 dex. Our abundances are less, than Luck (2015) values, for all above listed elements except for cobalt, scandium and zirconium. Maybe the underabundances in our calculations can be explained by difference in the methods. All our values were found by the spectrum synthesis method, and for elements with faint lines in the spectrum it gives the possibility to take into account the blending effects by lines of other chemical elements and molecules with better accuracy. It is valid for an individual star, for example V1719 Cyg, but the equivalent widths measurements give the best results for investigations of different abundance trends in big sample of stars. That is why here we will use our abundances for discussing the abundances in the atmosphere of V1719 Cyg, and all stars from Luck (2015) survey to investigate the trends in the abundance patterns.
Fig. 2 shows the relative abundances of chemical elements in the atmosphere of V1719 Cyg as a function of atomic numbers. It seems reliable to classify V1719 Cyg as a typical metallic line star. It has solar or close to solar abundances of all chemical elements with atomic numbers Z≤30. The exceptions are oxygen, titanium and vanadium. The abundances of elements with Z>30 are mainly oversolar, and the only exception is barium.
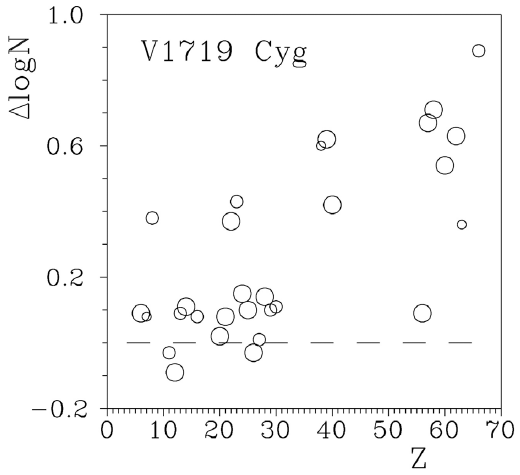
Fig. 3 is the plot of relative abundances in the atmosphere of V1719 Cyg as a function of condensation temperatures of these elements. All chemical elements with Z>30 have condensation temperatures higher than 1,200 K. Usually the lines of these elements, except for barium, are not identified in the spectra of λ Boo type stars. If we calculate the correlation coefficient of relative abundances vs condensation temperatures for elements with Z≤30 and barium, we obtain –0.07±0.22.
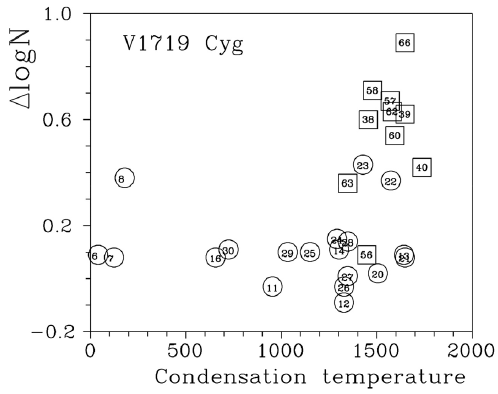
It allows rejecting the possibility of dust-gas separation scenario (Venn & Lambert 1990, 2008) for V1719 Cyg. Note, that the mentioned scenario explains the negative correlation of relative abundances vs condensation temperatures in the atmospheres of λ Boo type stars. This correlation is zero for V1719 Cyg. That is why it is possible to accept the absence of dust-gas envelope around our target star. Fig. 4 illustrates the dependence of relative abundances vs second ionization potentials. As it was discussed by Yushchenko et al. (2015) this plot can reflect the accretion of hydrogen & helium atoms from interstellar gas to stellar atmosphere. In the case of V1719 Cyg we can find no signs of this phenomena. This type of accretion, if exist, produce no noticeable disturbance in the abundance pattern – there are no clear peculiarities near the values of ionization energies of hydrogen and helium. It is necessary to mention that our value of effective temperature for V1719 Cyg is near 400 K higher than that of ρ Pup (Yushchenko et al. 2010, 2015).
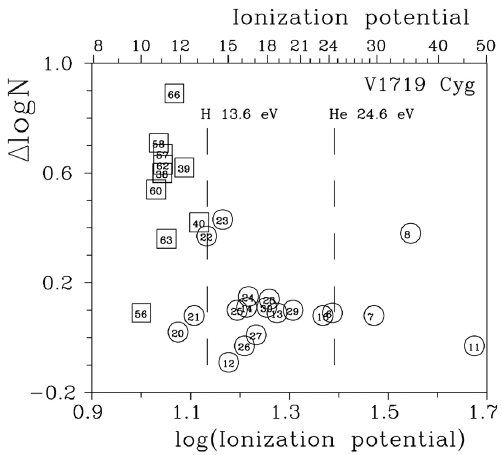
From the one side it is possible to expect that the signs of hydrogen and helium accretion, first discussed by Greenstein (1949), Havnes (1971) and Havnes & Conti (1971), can be better observed in hotter stars, but from the other side the abundance patterns of stars in this part of HR diagram are very different. Various physical effects take place in the upper atmospheres of these stars and any peculiarities can be conserved for several millions years (Proffitt & Michaud 1989). In the case of V1719 Cyg we should conclude that this star was not influenced by strong accretion in the recent few millions years. That is why the surface chemical composition of V1719 Cyg can reflect the initial chemical composition of interstellar matter at the time and place of the birth of this star.
Fig. 5 compares the abundance pattern of V1719 Cyg with solar system distribution of r-, s-processes elements. The s-process elements follow solar system distribution of s-process isotopes. Unfortunately we detected only three r-process elements. The other elements with high s-process fraction have faint lines and can not be identified in our observed spectra of V1719 Cyg, which are strongly broadened by rotational and instrumental profiles. We tried to find these lines using the comparison of observations and synthetic spectrum calculated with 0.5 dex overabundances of heavy elements, but no elements heavier than dysprosium were found. We conclude that V1719 Cyg is enhanced by s-process elements by 0.4–0.7 dex. The overabundances of r-process elements, if exist, should be of the same order or less pronounced.
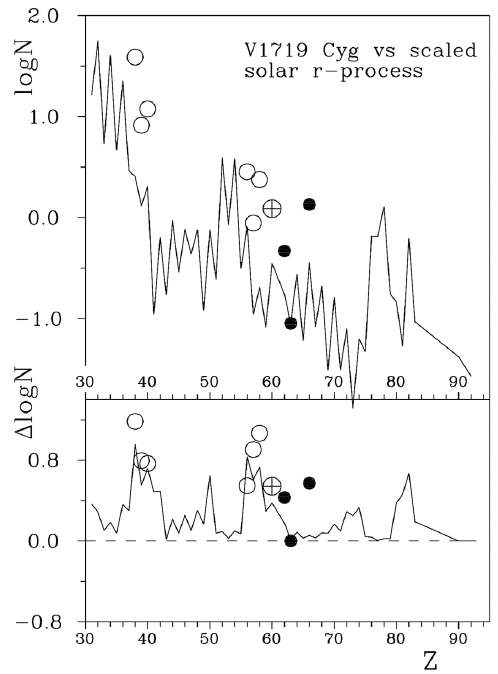
We can conclude that the atmosphere of V1719 Cyg was not influenced by accretion of matter from interstellar space. It is surprising as the star is located close to the plane of Milky Way. The proper motion and parallax allow to point that V1719 Cyg is Population I object. We can expect for its motion through the clouds of interstellar gas and dust in the past, but no results are found. The abundance pattern exhibits the clear overabundances of s-process elements and, maybe, less pronounced overabundances of r-process elements.
It should be noted that the interpretation of abundance anomalies as a function of second ionization potentials is still hypothetical. The theory was proposed by Havnes (1971a, b) and Havnes & Conti (1971), but it was developed only for stars with strong magnetic fields. For the stars with low magnetic fields it is necessary to take into account the interaction of stellar wind with interstellar matter inside and outside of the Strőmgren sphere. In the case of Sun the heliosphere, located in the outer Solar system, prevents the penetration of charged particles with low relative velocities to the inner Solar system. It is naturally to expect the similar effect for other stars.
Havnes (1971a, b) and Havnes & Conti (1971) were able to make the first step – the construction of simple model, because the strong magnetic field allowed them to neglect the other physical effects. Now it is time to collect the observational data for next step.


