1. INTRODUCTION
It is well known that the lower and upper atmospheres are highly coupled to each other on various levels. A stratospheric sudden warming (SSW) event is one representative example of such dynamical coupling between the lower and upper atmospheres via atmospheric waves that are generated in the lower atmosphere and then propagate upward to affect the upper atmosphere. The planetary waves generated in the polar troposphere propagate upward into the stratosphere and interact with the stratospheric winter jet to slow it down or even reverse it. The resulting change in the zonal mean wind induces a downward circulation in the stratosphere causing adiabatic heating (i.e., SSW) while also giving rise to an upward circulation in the mesosphere causing adiabatic cooling (i.e., mesospheric cooling) (Matsuno 1971;Liu & Roble 2002). Furthermore, it has been reported that the effects of this dynamical coupling have been observed in the polar thermosphere and the equatorial ionosphere (Goncharenko et al. 2013;Liu et al. 2013;Pedatella & Liu 2013;Kwon et al. 2018;Lee et al. 2018).
The temperature anomalies in the Earth’s atmosphere during SSW events have been reported in a number of studies using the observations of a few specific SSW events or numerical model simulations (e.g., Liu & Roble 2002;Sigernes et al. 2003;Cho et al. 2004;Siskind et al. 2005;Funke et al. 2010;Kurihara et al. 2010;Tan et al. 2012). These previous studies have confirmed that warming, cooling, and warming take place in the stratosphere, mesosphere, and lower thermosphere, respectively, during an SSW event. However, it is still uncertain whether these phenomena occur simultaneously or in a certain order, and how the atmospheric constituents vary with time and height during the event.
Furthermore, the altitude range of the temperature anomalies is also quite uncertain. For example, based on their model simulation study using the Thermosphere, Ionosphere, Mesosphere, and Electrodynamics General Circulation Model, Liu & Roble (2002) predicted that the stratospheric warming occurs at altitudes around 30–50 km, the mesospheric cooling at around 70–90 km, and the thermospheric warming at 120–135 km. Another model simulation by Liu et al. (2013) also suggested that the thermospheric warming occurs at an altitude of about 120 km in the northern polar region. A number of temperature observations during SSW events support such model predictions. Cho et al. (2004) reported mesospheric cooling at altitudes of about 87 and 94 km from the measurements of OH and O2 airglow emissions during a 2001–2002 SSW event. Meteor radar observations of the mesospheric temperature also showed similar cooling at 80–90 km altitude (Kurihara et al. 2010). Using satellite observations for temperature in the altitude range of 40–170 km, Funke et al. (2010) also reported mesospheric cooling at altitudes of 80–90 km and lower thermospheric warming at about the 120–140 km altitude range. All these observations and model simulations seem to suggest consistent altitude ranges for the temperature anomalies during SSW.
Siskind et al. (2005), however, reported that the altitudes of the temperature anomalies in the mesosphere and lower thermosphere seem to be lower than the altitudes reported in most previous studies. Using temperature data measured during SSW events obtained from the Sounding of the Atmosphere with Broadband Emission Radiometry (SABER) instrument on board the NASA Thermosphere Ionosphere Mesosphere Energetics Dynamics (TIMED) satellite, they found that the vertical extension of the mesospheric cooling layer was much shallower than predicted by Liu & Roble (2002) and that the overall altitude ranges of the mesospheric cooling and thermospheric warming are approximately 40–70 km and 80–120 km, respectively. The simulation of a 2002 SSW event by Coy et al. (2005) also showed a relatively narrow range of cooling only extending up to an altitude of about 80 km. Similarly, Azeem et al. (2010) analyzed the measurements of mesosphere and low thermosphere (MLT) temperature inferred from OH (~87 km) and O2 (~94 km) airglow observations at the South Pole, Antarctica during minor SSW events in 2002 and showed that there was a sudden cooling in OH temperature accompanied by a warming in O2 temperature.
In order to further investigate the vertical extent of temperature anomalies associated with SSW, we analyzed multi-year satellite observations of temperature and ozone in the stratosphere and mesosphere. We firstly investigate the correlation between the stratospheric and mesospheric temperatures during the periods before and after SSW events, using the multi-year observations from the Microwave Limb Sounder (MLS) instrument on the Aura satellite during the period from 2005 through 2016 as well as the behavior of ozone concentration. The analysis results for temperature anomalies in the stratosphere and mesosphere will then be discussed in comparison with a numerical model simulation performed using the Whole Atmosphere Community Climate Model (WACCM) and a discussion of ozone density variation during SSW will be presented.
2. DATA
The MLS on board the Aura satellite has been measuring thermal microwave limb emissions from several atmospheric constituents for 55 pressure levels from 316 hPa (upper troposphere) up to 0.001 hPa (near the mesopause) since the launch of the satellite on July 15, 2004. The Aura satellite was launched into a sun-synchronous near-polar (98.2° inclination) orbit at an altitude of 705 km. The MLS instrument vertically scans the limb in the orbit plane with latitudinal coverage between 82° S and 82° N and allows us to retrieve temperature data from the bands near the O2 spectral lines at 118 and 239 GHz (Waters et al. 2006). The temperature precision is typically about 1 K in the stratosphere and the effective horizontal resolution of the MLS data is about 200 km (Schwartz et al. 2008). More details on the MLS data including the procedure of temperature retrieval can be found in Waters et al. (2006), Schwartz et al. (2008), and French & Mulligan (2010). In this study, we utilized MLS version 3.3 level-2 daily temperatures for 55 levels during the period from 2005 to 2016.
We used the WACCM version 4, which is the atmospheric component of the Community Earth System Model (CESM1.0.2) developed at the National Center for Atmospheric Research. WACCM4 is a fully coupled general circulation model that extends from the ground (1,000 hPa) to about 145 km (1 × 10⁻⁵ hPa) with 66 pressure levels and a horizontal resolution of 1.9° × 2.5° in latitude and longitude (Garcia et al. 2007). The vertical intervals of the model vary with altitude: about 1 and 3 km at 20 and 100 km, respectively. As boundary conditions for the model, we used climatological sea surface temperature with sea-ice repeated every year. The boundary forcings are obtained from the monthly Hadley Center Sea Ice and Sea Surface Temperature data set averaged over the period from 1981 to 2010. The model simulation was performed for 100 years. For the first 30 years, the output of the model is discarded and 69 boreal winters (November – February) from the last 70 years were analyzed in this study. For comparison with the results from the MLS observations, we utilized daily area-mean WACCM temperatures calculated over the polar region at latitudes greater than 65° N.
3. RESULTS AND DISCUSSIONS
In the present study, the anomalies derived from Aura/MLS temperature and ozone data are used to investigate the general morphologies of temperature and ozone changes with height during the pre-, main-, and post-phases of SSW events. We selected three major SSW events which occurred in January 2006, 2009, and 2013, and defined the pre-, main-, and postphases as November, ± 3 days from the central date, and a month after 10 days from the central date, respectively. The Aura/MLS temperature and ozone data were reproduced as area-mean values by averaging over the entire polar region above 65° N latitude for each day and height level. The temperature anomaly, ΔTd, for each day is then the deviation of daily mean temperature from the long-term climatological mean of daily temperature during the period from 2005 to 2016, which is expressed as
where d is the day of the year (DOY) and N is the number of DOYs during the period. The daily mean temperature Td is the mean temperature of each day, averaged over the entire polar region above 65° N latitude.
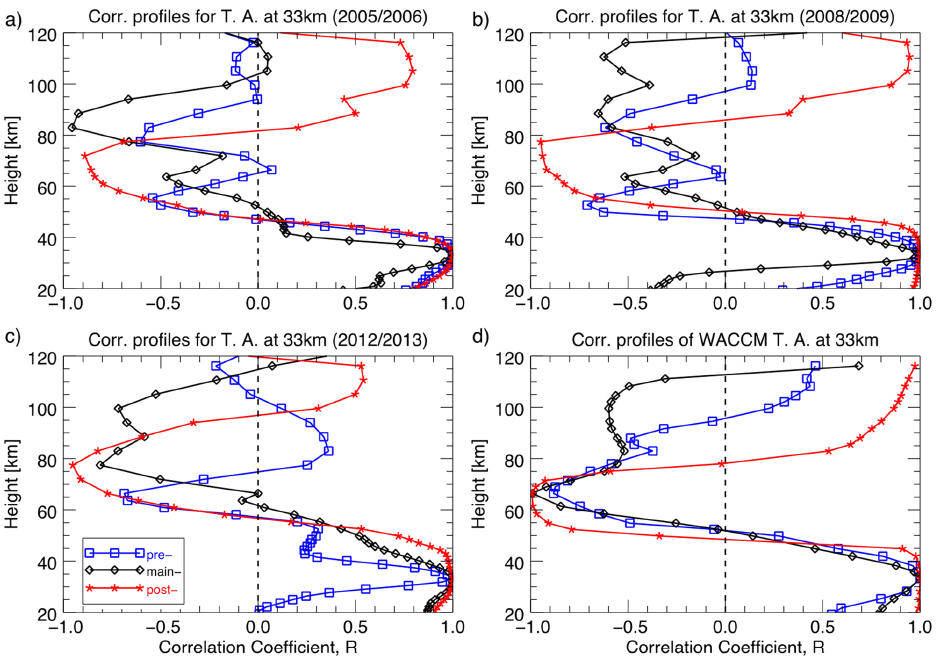
In order to investigate the altitude distribution of the temperature anomaly in response to SSW in the upper atmosphere, we calculated the correlation coefficients between the temperature anomaly at 10 hPa corresponding to an altitude of about 33 km and the temperature anomalies for 55 height levels in the altitude region from the ground to 120 km. Fig. 1 shows the height profiles of the correlation coefficients for the pre- (blue), main- (black), and postphase (red) of SSW events calculated from MLS and WACCM temperature anomalies. The noticeable feature in the profiles of the correlation coefficients in Fig. 1 is that there is a significant difference between pre- and post-phase mean coefficients. While the pre-phase mean coefficients before SSW show overall negative correlation to the stratosphere in the whole mesosphere, the post-phase mean coefficients after SSW show negative correlation only in the lower part of the mesosphere but positive correlation in the upper mesosphere and lower thermosphere. The overall negative correlation between the mesosphere and the stratosphere seems to indicate that the whole mesospheric temperature tends to decrease as the stratospheric temperature increases in the northern high-latitude region, even when there is no SSW event. In other words, an SSW event may not necessarily be required to cause mesospheric cooling, which may be a general characteristic of the temperature structure in the mesosphere and stratosphere. However, during the post-SSW event periods, the negative correlation becomes stronger but narrower, occurring only in the lower part of the mesosphere. Then, the correlation becomes positive in the upper mesosphere and continues to exist in the lower thermosphere.

This aspect of negative and positive correlations between the mesospheric and stratospheric temperatures during SSW has been reported by Siskind et al. (2005), who analyzed TIMED/SABER temperature data during three SSW events, two in the northern hemisphere (Feb. 2002 and Jan. – Feb. 2003) and one in the southern hemisphere (Aug. 2002). They also pointed out that the mesospheric cooling layer seems much shallower in depth than previously observed altitude ranges during SSW events, for example, by Liu & Roble (2002) and Cho et al. (2004). Recently, Tan et al. (2012) analyzed SABER temperature data from 2002 to 2010 as well as WACCM temperature and wind data during 54 model years, as in Siskind et al. (2005), but for a much longer period of observation, and investigated the correlation patterns over global latitudes from the stratosphere to the lower thermosphere region. However, their results in the northern high-latitude region did not show any significant difference in the correlation coefficient between the periods with and without SSWs, which disagrees both with Siskind et al. (2005) and our result. This difference may be caused by the different datasets and analysis processes used in each study. As Tan et al. (2012) pointed out, SABER covers only part of the northern high-latitude winter from mid-January to mid-March because of the 60-day yaw cycle of the TIMED satellite. Hence, they classified SABER data obtained during the period from mid-January to mid-March into two categories: with and without SSWs.
For comparison with the model simulation results, the correlation coefficients of temperature anomalies were calculated using the same method as the WACCM simulation for 70 model years and the results are presented in Fig. 1(d). A total of 33 SSW events were reproduced for 70 model years and the three phases (pre-, main-, and post-) were classified as the periods from –30 days to -20 days, central date ± 10 days, and from +15 days to +30 days. The results from the WACCM temperatures are generally in good agreement with the observations. During the post-phase, however, the transition height where the correlation turns from negative to positive in the mesosphere is significantly lower than that found in the observation data and the altitudinal extent of the negative correlation is also narrower than in the observations. This may suggest that a further improvement would be necessary for WACCM simulations of mesospheric temperatures.
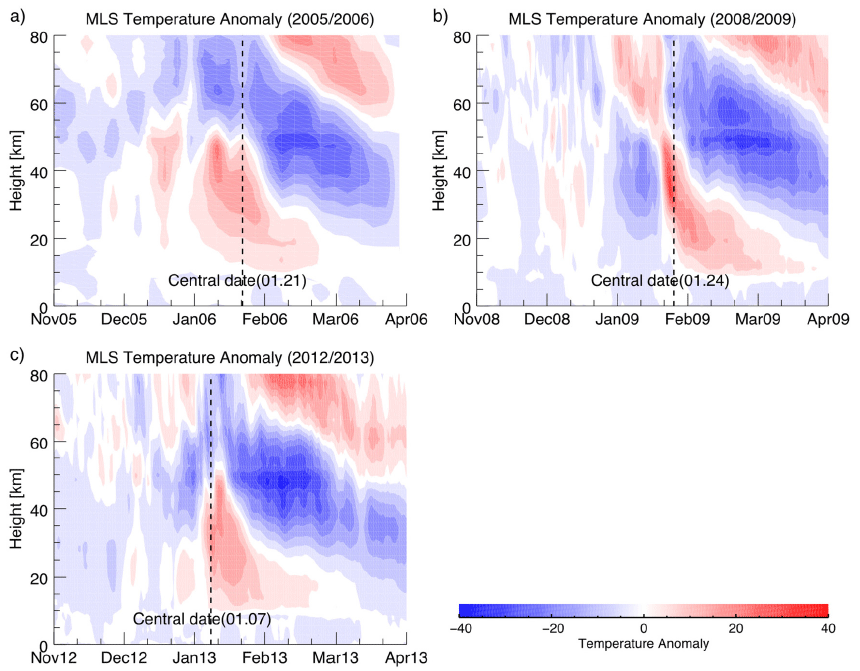
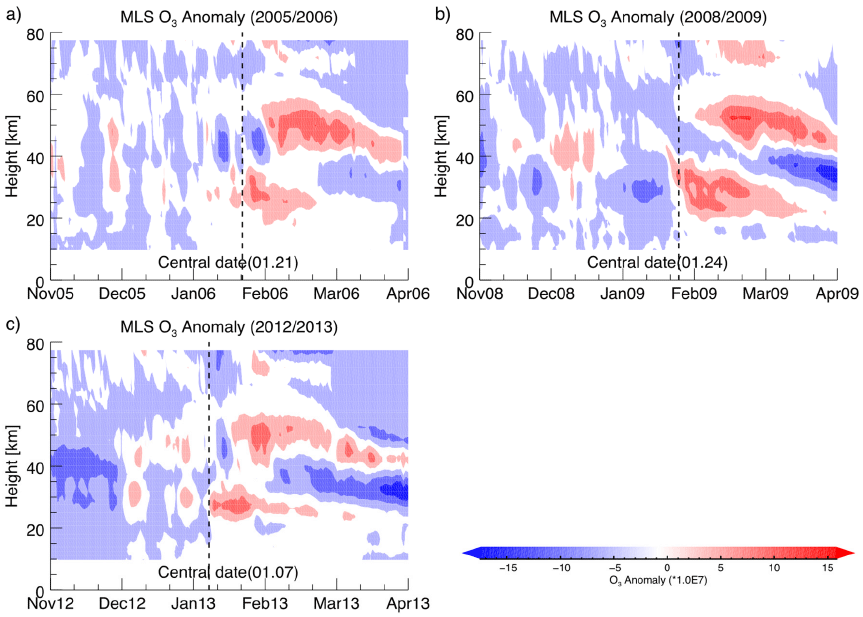
While previous studies have focused on the features in the stratosphere and mesosphere during the pre- and main-phase of SSW, it is also important to understand the changes in the temperature and atmospheric constituents during the post-phase of SSW because the post-phase lasts much longer than the other phases and the atmospheric concentrations of components such as ozone and nitrogen oxides (NOx) are significantly modulated by various processes related to SSW, especially in polar regions. In order to compare the changes in temperature and ozone during the post-phase of SSW, we plotted the time-series data for temperature and ozone anomalies from MLS measurements for the altitude range from ground to 80 km during the periods from November to March for 2005/2006, 2008/2009, and 2012/2013 boreal winter seasons, as shown in Fig. 2 and 3, respectively. In these figures, we find a few noticeable features in the changes of temperature and ozone. Firstly, the ozone densities do not show any significant change during the pre-phases in both the stratosphere and mesosphere, whereas the temperature modulations already appear tens of days before the central date of SSW events in the mesosphere. Furthermore, the changes in ozone density during the post-phase proceed gradually compared to the temperature variations. Secondly, it is noticeable that the increases in ozone density during the main- and post-phase occur in two different altitude regions: the first increase at an altitude of around 30 km is followed by the second around 50 km. It is well known that the existence of a strong vortex in the polar region causes the downward transport of atmospheric constituents including NOx from the mesosphere and lower thermosphere to the stratosphere, and then transported NOx can reduce the ozone in the stratosphere by dissociative recombination (Sinnhuber et al. 2014). This may explain why the ozone anomalies during the period before the main-phase are mostly negative. On the other hand, stratospheric ozone density in the polar region can be increased by the inflow of air from the mid-latitude region when strong SSW occurs. However, ozone density changes in the mesosphere during the post-phase period may require more comprehensive analysis of the wind data in the mesosphere, which is beyond the scope of this study.


4. CONCLUSIONS
We analyzed the long-term Aura/MLS temperature data during the period from 2005 to 2016 and compared the results with those from WACCM4 simulation of 70 model years, in order to statistically investigate the responses of stratospheric and mesospheric temperatures during SSW events. The temperature in the entire mesosphere during the pre-phase, which is considered as a period without an SSW event, showed a relatively weak and negative correlation with the variation of stratospheric temperature. During the post-phase period, however, the region of this negative correlation was confined to the region of the lower mesosphere with a stronger magnitude, while the correlation became positive in the upper mesosphere and lower thermosphere. The WACCM simulation largely agreed with these results, but the extent of the negative correlation in the mesosphere was not as large as that found in the observational data in terms of the altitude range, and the transition height was also much lower than in the observations. This result may indicate that the internal processes within WACCM used for the calculation of the mesospheric temperature during SSW need to be improved.
It was also found that the ozone densities during the three major SSW events changed significantly, especially in the main- and post-phases of SSW, but this process occurred much more gradually in comparison with the temperature variations. The increase in ozone density in the polar stratosphere during the main- and post-phase periods may be explained by the inflow of air from the mid-latitude region during an SSW event. However, in order to understand the ozone variations in the polar mesosphere during an SSW event, further investigation will be required.


