1. INTRODUCTION
Research on the TEC, which is used as an indicator for variations in the ionosphere, has been actively performed owing to the development of global positioning system (GPS) networks. Additionally, solar and geomagnetic activities have been studied as the main contributors to ionosphere changes, but recent studies have suggested that ionospheric variations may be caused by seismic activity. Liperovskaya et al. (2006) analyzed the ionosphere data observed at the Kokubunji and Akita stations in Japan to confirm that the ionospheric spread-F appeared before and after large earthquakes (magnitude M > 6.0) and proposed an association between the occurrence of spread-F and earthquakes. Additionally, Xia et al. (2011) identified the occurrence of TEC anomalies before and after three major earthquakes (M > 7.0) in Qinghai-Tibet, China. The TEC decreased 1–5 days before M ≥ 5.0 earthquakes in Taiwan (Liu et al. 2004, 2006a) and 1–6 days before M ≥ 6.0 earthquakes in China (Liu et al. 2009). In contrast, the TEC anomalously increased 1–5 days before M ≥ 6.0 earthquakes in Japan (Liu et al. 2013;Ryu et al. 2016). In a recent study, anomalies in the TEC and plasma densities in the ionosphere were observed 2 days before Indonesia’s Java earthquake with a magnitude of 7.7 in 2006 (Tao et al. 2017). Ryu et al. (2014a, b) described the phenomenon in which seismic activity around geomagnetic equatorial regions affects the equatorial ionization anomaly (EIA) strength, increasing the value of EIA during pre-seismic periods compared with the typical seasonal and spatial distribution. Later, Ryu et al. (2016) analyzed DEMETER observations for M ≥ 6 earthquakes in Northeast Asia to determine whether the connection between the seismic activity and the strengthening of the EIA was valid under mid-latitude seismic activity. For earthquakes with magnitudes of M ≥ 6.5 or hypocenter depths of Dh ≤ 30 km, it was confirmed that the normalized sequential plasma density (NEPD) index increased as an earthquake precursor. The NEPD index was defined as the ratio of the mean electron density in the geomagnetic equatorial region () to that in the mid-latitude region (). Fujinawa & Takahashi (1990) and Pulinets (2012) proposed that ionosphere variations associated with earthquakes can be caused by charged particle drift due to an anomalous electric field centered around the earthquake region, resulting in an irregular electron density. Other researchers suggested that the atmospheric gravity wave can be generated when earthquakes occur, affecting the ionosphere (Weaver et al, 1970;Hayakawa, 1999;Liu et al, 2006b).
In the present study, for earthquakes in the United States (i.e., longitude range of 150°W to 50°W and latitude range of 30°N to 50°N) between January 2013 and December 2015, i.e., the period of maximum solar activity, the changes in the ionosphere were analyzed using vertical TEC (VTEC) data provided by the National Oceanic and Atmospheric Administration (NOAA). We intended to identify TEC variations over a period of 40 days, including the times of the earthquake, for four areas with earthquakes having magnitudes of M ≥ 5.5: Ferndale (M = 6.8 on March 10, 2014; M = 5.7 on January 28, 2015), Port Hardy, Canada (M = 5.5 on August 4, 2013; M = 6.5 on April 24, 2014; M = 5.7 on September 24, 2015), Oregon (M = 5.5 on December 1, 2013; M = 5.9 on June 1, 2015), and South Napa (M = 6.0 on August 24, 2014). Earthquakes in Port Hardy, Canada are included in the study area. Additionally, the TEC variations due to earthquakes with magnitudes of 5.0 ≤ M < 5.5 in four areas were examined. We focused on large earthquakes because ionospheric changes can occur for various reasons (Jo et al. 2019;Hong et al. 2019) and the association of such changes with earthquakes may not be clear for small earthquakes.
2. METHODS
The TEC is an important descriptive physical quantity for the ionosphere, representing the total number of electrons between two points, along a tube with a cross section of 1 m2, i.e., the electron columnar number density. The TEC unit (TECU) is defined as 1016 el/m2. The TEC is important for determining the scintillation and group and phase delays of a radio wave propagating through a medium. The ionospheric TEC is characterized by observing the phase delays of received radio signals transmitted by satellites located above the ionosphere (often GPS satellites). The VTEC is determined by integrating the electron density in the direction perpendicular to the ground station route, and the slant TEC (STEC) is determined by integrating the electron density over any straight path (Wikipedia 2019).
Fig. 1 shows the locations of the earthquakes investigated with GPS stations in the United States to obtain the TEC values. The NOAA Space Weather Prediction Center collects and provides TEC data by dividing the area in the longitude range of 150°W to 50°W and latitude range of 10°N to 60°N with intervals of 1°. In this study, VTEC data with 15-min intervals obtained using radio wave signals received from GPS satellites were used. The spatial resolution of the TEC observations was 1° × 1°, which may fully cover the area where an earthquake occurred.
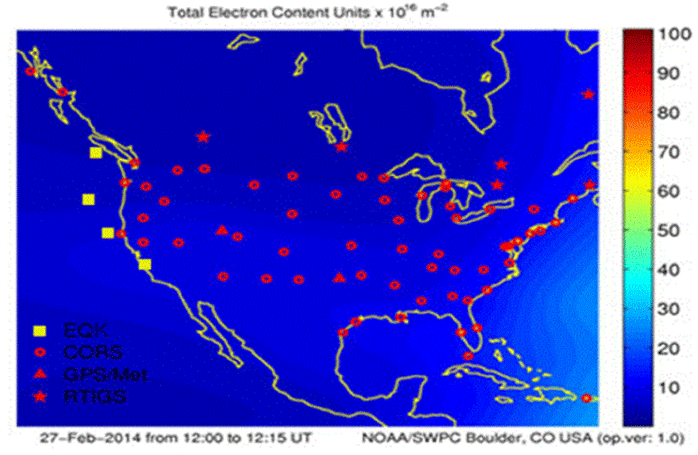
We investigated the TEC variations caused by eight earthquakes with magnitudes of M ≥ 5.5 and 12 earthquakes with magnitudes of 5.5 > M ≥ 5.0 in the United States during the solar-maximum period of 2013–2015. The seismic data in Table 1 were provided by the United States Geological Survey and were used to identify the location, time of occurrence, epicenter depth, and magnitude for each earthquake.

|
To analyze the trends of the TEC variations, the median value of the TEC data observed for 40 days before and after the earthquake was set as a representative value, and the upper and lower bounds were set as (median + 1.64 × σ) and (median − 1.64 × σ), respectively, to check for TEC anomalies (Liu et al. 2000, 2004, 2009). Here, σ represents the standard deviation. Thus, the upper bound was defined if the data were greater than the standard value Z = 1.64 (probability p = 0.05) of the standard normal distribution and the lower bound was less than Z = −1.64 (probability p = 0.05). Because TEC values can change owing to solar or geomagnetic activity, the F10.7, Kp, and Dst indices, which reflect the solar and geomagnetic activities, were examined to confirm that the earthquakes were the main factors influencing the TEC values. The TEC data were represented with the following unit: TECU = 1016 el/m2.
3. RESULTS AND DISCUSSIONS
Nine earthquakes with a magnitude of M ≥ 5.5 occurred in the western United States from 2013 to 2015, which was the maximum period of solar cycle 24. In the case of the Greenville earthquake (M = 5.7, on May 24, 2013), it was difficult to determine whether the TEC variations were caused by the earthquake or the geomagnetic activity, which was considerable. Analyses were conducted for eight earthquakes during which the geomagnetic and solar activities were relatively low or moderate. Additionally, to identify the TEC variations depending on the magnitude of the earthquake, we investigated the changes in the TEC due to earthquakes with magnitudes of 5.0 ≤ M < 5.5 in four areas (Ferndale, Port Hardy, Oregon, and South Napa) where earthquakes with magnitudes of M ≥ 5.5 occurred.
Figs. 2–8 show the changes in the TEC for the 20 days before and after earthquakes, including the observations (black line), associated median (red line), upper bound (blue line), and lower bound (green line) of the TEC. In this study, TEC values above the upper bound and below the lower bound were defined as upper and lower anomalies, respectively. The figures also present the variations of Kp, Dst, and F10.7 over time.
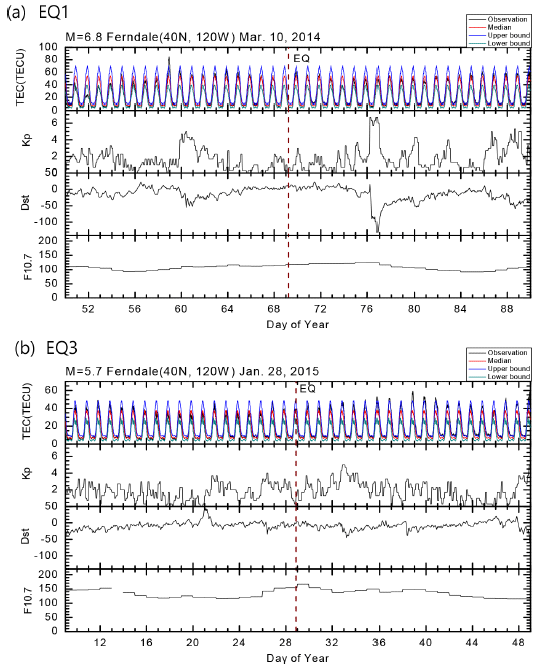
Fig. 2 shows the variations in the TEC and the Kp, Dst, and F10.7 indices over time, including the times when earthquakes (EQ1, EQ3) occurred in Ferndale. The EQ was a representation of when an earthquake occurred. Analysis of the TEC variations revealed that for the EQ1 earthquake (M = 6.8), the upper anomaly appeared 10 days before the earthquake. Additionally, for the EQ3 earthquake (M = 5.7), upper anomalies appeared 7–12 days after the earthquake; in particular, 10 days after the earthquake, a relatively high upper anomaly was observed. For the EQ1 and EQ3 earthquakes, the values of TEC, which were 33.5% and 25.0% higher than the upper bound, respectively, exhibited significant changes. When the upper anomalies were high, the Kp values were < 4, and the Dst did not fall below −50 nT, indicating that the geomagnetic activity was low. The F10.7 values were mostly < 150, indicating that the solar activity was moderate. Thus, the geomagnetic and solar activities were low or moderate, and the sudden changes in the TEC are attributed to other factors. On March 17, 2014 (Fig. 2(a)), the Kp values were > 6, and the Dst values were reduced to −132 nT, but no TEC anomaly was observed. Therefore, the TEC anomalies shown in Fig. 2 are assumed to be attributed to the effect of the earthquake.
Fig. 3 presents the changes in the TEC and the Kp, Dst, and F10.7 indices for the 20 days before and after the earthquakes (EQ6, EQ4, and EQ11) in Port Hardy. For the EQ6 earthquake (M = 6.5), the upper anomalies were observed 5 and 17 days before earthquake. For the EQ4 earthquake (M = 5.5), the upper anomalies appeared 10–11 days before and 18 days after the earthquake. For the EQ11 earthquake (M = 5.7), numerous upper anomalies appeared after 4 days of the earthquake, and a particularly high upper anomaly was observed 7 days after the earthquake. For the EQ6 and EQ11 earthquakes, TEC values of 24.6% and 48.0% (higher than the upper bound), respectively, were observed. On the days when upper anomalies were observed, the geomagnetic activity was low, as the Kp values were < 4 and the Dst values were higher than −50 nT. The F10.7 was generally < 150, indicating that the solar activity was moderate. In the case of Fig. 3(c), the Kp values were > 7, and the Dst values were lower than −124 nT, but no TEC anomaly was observed.
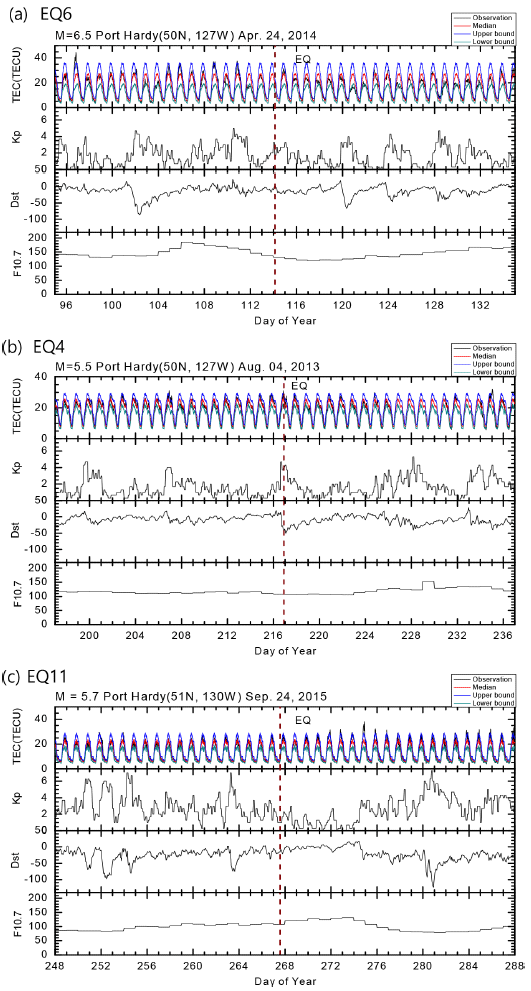
Fig. 4 presents the changes in the TEC and the Kp, Dst, and F10.7 indices for the 20 days before and after the earthquakes (EQ15, EQ19) in Oregon. For the EQ15 earthquake (M = 5.5), an upper anomaly was observed 1 day after the earthquake. For the EQ19 earthquake (M = 5.9), an upper anomaly was observed 13–15 days before the earthquake; in particular, 14 days prior to the earthquake, a high upper anomaly was observed. For the EQ15 and EQ19 earthquakes, TEC values 30.0% and 42.0% higher than the upper bound, respectively, were observed. When upper anomalies were observed, the Kp index was < 5, and the Dst index was higher than −50 nT; thus, the geomagnetic activty was moderate. The F10.7 index was generally below 150, indicating that the solar activity was moderate. In the cases of Figs. 4(a) and 4(b), the Kp values were approximately 6 and the Dst values were reduced to −80 nT, but no TEC anomaly was observed.
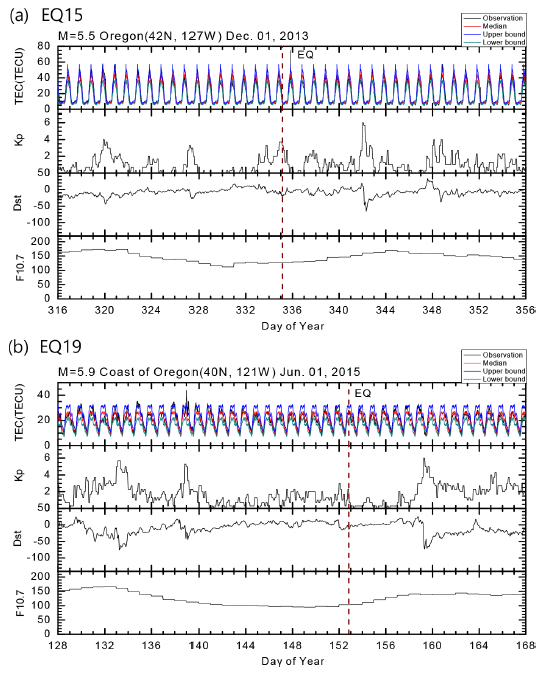
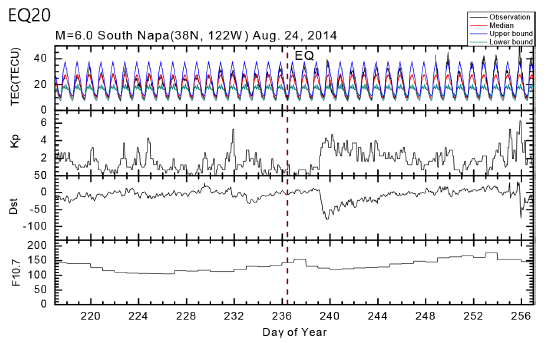
Fig. 5 presents the changes in the TEC and the Kp, Dst, and F10.7 indices over time for the earthquake (EQ20, M = 6.0) in South Napa. Numerous upper anomalies were observed after 13 days of the earthquake. The TEC values were 21.8% and 39.0% higher than the upper bound. When the upper anomalies occurred, the Kp index was < 4 13–18 days after the earthquake, and the Dst index was higher than −50 nT; thus, the geomagnetic activity was low. The F10.7 was generally < 150, indicating that the solar activity was moderate. 19–20 days after the earthquake, the Kp index was > 6, and the Dst index was reduced to −80 nT. As shown in Figs. 2 and 3(c), no TEC anomaly was observed even when the Kp index was > 6 and the Dst index was reduced to −150 nT. Therefore, it is possible that the TEC anomalies observed 20 days after the earthquake were caused by the earthquake.
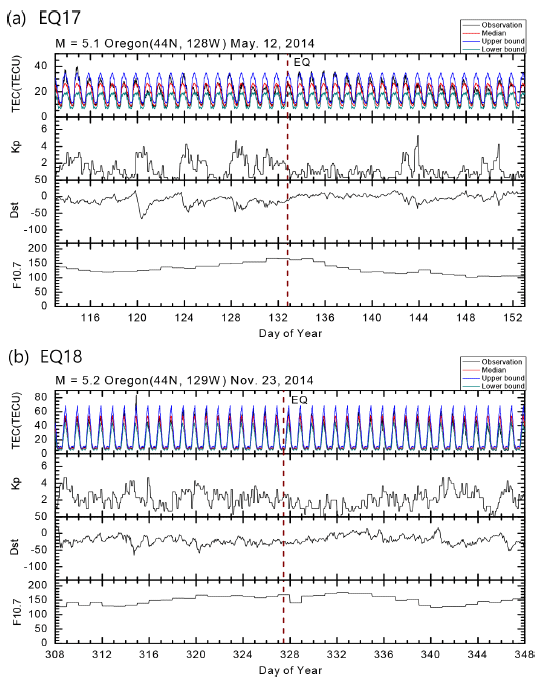
Figs. 6–8 show seven earthquakes for which anomalies were observed among the 12 earthquakes with magnitudes of 5.0 ≤ M < 5.5 in the areas of Ferndale, Port Hardy, and Oregon. The changes in the TEC and the Kp, Dst, and F10.7 indices for the 20 days before and after the earthquakes are presented.
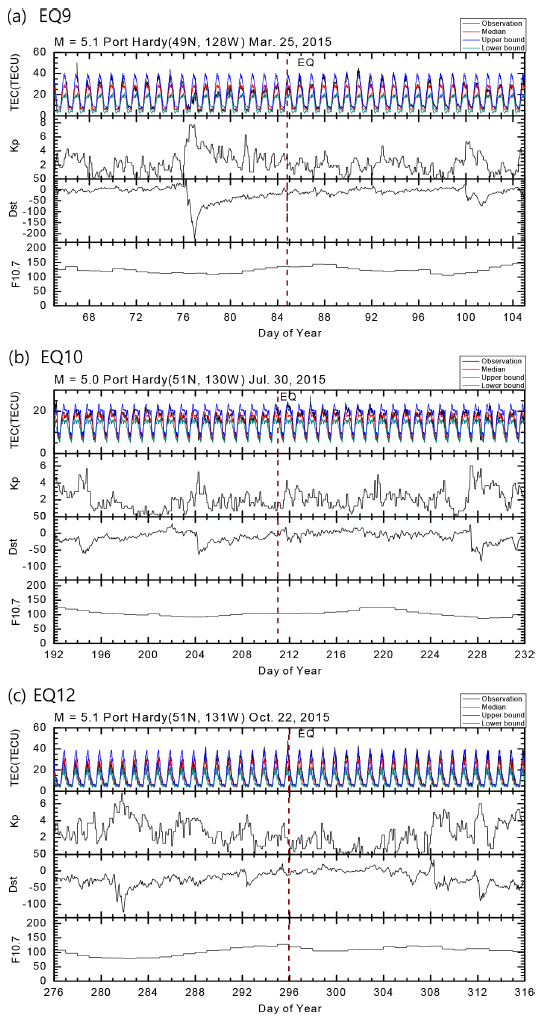
As indicated by the TEC results in Fig. 6, for the EQ9 earthquake (M = 5.1), upper anomalies were observed 10 and 18 days before and 6 days after the earthquake. For the EQ10 earthquake (M = 5.0), upper anomalies were observed 3 days after the earthquake. For the EQ12 earthquake (M = 5.1), upper anomalies were observed on the day of the earthquake, 2 and 7 days before the earthquake, and 3–7 days after the earthquake. For EQ9, EQ10, and EQ12, TEC values 36%, 15%, and 23.8% higher than the upper bound, respectively, were observed. The timing of the changes in the TEC values due to earthquakes with similar magnitudes in the same region may vary. When upper anomalies were observed, the Kp value was < 4, and the Dst index was higher than −50 nT. The F10.7 was < 150, indicating that the solar activity was moderate.
As shown in Fig. 7, for the EQ13 earthquake (M = 5.4), upper anomalies were observed 12 days before and 16 days after the earthquake. For the EQ16 earthquake (M = 5.1), an upper anomaly was observed 12 days before the earthquake. When significant TEC changes occurred, the TEC values were 39.9% and 32.6% higher than the upper bound for EQ13 and EQ16, respectively. As shown in Fig. 8, for the EQ17 earthquake (M = 5.1), an upper anomaly occurred 18 days before the earthquake. For the EQ18 earthquake (M = 5.2), an upper anomaly occurred 14 days before the earthquake. When significant changes in the TEC values occurred, the TEC values were 15.8% and 21.0% higher than the upper bound for EQ17 and EQ18, respectively. When upper anomalies occurred, for the EQ13, EQ17, and EQ18 earthquakes, the Kp value was < 4 and the Dst index was higher than −50 nT; thus, the geomagnetic activity was low. The F10.7 value was mostly < 150, indicating moderate solar activity. However, in the case of the EQ16 earthquake (Fig. 7(b)), when the upper anomaly occurred, the Kp index was close to 5 and the Dst index was lower than −100 nT, indicating high geomagnetic activity. Additionally, the F10.7 was > 150, indicating high solar activity. Therefore, for the upper anomaly in the case of the EQ16 earthquake, the effects of geomagnetic and solar activities could not be excluded.
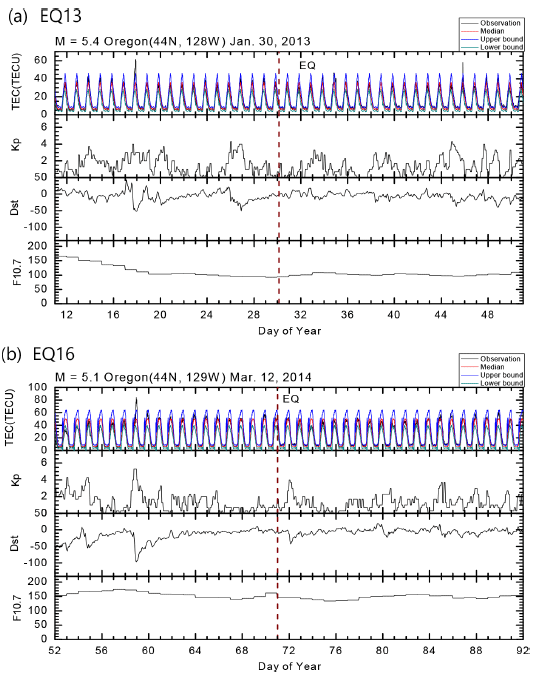
Table 2 presents the TEC variations (anomalies) and the magnitudes of the earthquakes. For the 5.0 ≤ M < 5.5 earthquakes, upper anomalies occurred 2–18 days before the earthquakes (50%, 6 of 12 events), and 1–16 days after the earthquakes (42%, 5 of 12 events). For the 5.5 ≤ M < 6.0 earthquakes, upper anomalies occurred 10–14 days before the earthquakes (80%, 4 of 5 events) and 1–18 days after the earthquakes (80%, 4 of 5 events). For the M ≥ 6.0 earthquakes, upper anomalies occurred 10 and 17 days before the earthquakes (67%, 2 of 3 events) and 13 days after the earthquake (33%, 1 of 3 events); however, further studies are needed for this condition owing to the low frequency of these earthquakes. For all the M ≥ 5.5 earthquakes, upper anomalies were observed before or after the earthquake.
4. CONCLUSIONS
We analyzed the ionospheric variations caused by earthquakes using VTEC data for the United States provided by the NOAA. For eight earthquakes with magnitudes of M ≥ 5.5 in the United States from 2013 to 2015, i.e., the maximum period of solar activity, we examined the changes in the TEC over a period of 40 days, including the times of the earthquakes. Additionally, we analyzed the TEC variations for 12 earthquakes with magnitudes of 5.0 ≤ M < 5.5 that occurred during the analysis period, for four regions where M ≥ 5.5 earthquakes occurred. The results indicated that upper anomalies occurred 2–18 days before and 1–18 days after the earthquakes. The occurrence time of the TEC anomalies varied, even for TEC anomalies due to similar magnitude earthquakes in the same area (Figs. 6–8). Among the 12 earthquakes with magnitudes of 5.0 ≤ M < 5.5, upper anomalies occurred before the earthquake in six events (50%) and after the earthquake in five events (42%). Among the eight earthquakes with magnitudes of M ≥ 5.5, upper anomalies occurred before the earthquake in six events (75%) and after the earthquake in five events (62%). These results confirm that for earthquakes with a larger magnitude, more frequent anomalies occurred. The F10.7, Dst, and Kp indices indicated low or moderate solar and geomagnetic activities. Therefore, it was presumed that the foregoing TEC anomalies were caused by seismic effects. In previous studies, TEC variations occurred in a relatively short time span. Tao et al. (2017) observed the changes in the TEC and plasma density 2 days before the 2006 earthquake (M = 7.7) in Java, Indonesia. Krankowski et al. (2015) reported that 6 days before the 2014 earthquake in Alaska, the TEC was 25%–30% higher than the average value. Jin (2016) observed the TEC changes 4 hours before the main-shock earthquake with a magnitude of 9.2 occurred in Tokyo, Japan in 2011. Additionally, using data provided by Global Navigation Satellite System, they investigated earthquakes with a magnitude of M ≥ 5.0 that occurred from 1998 to 2014 around the world and found that the TEC increased 5 days before the earthquakes. In the present research, we limited the study area to the western United States and investigated earthquakes that were weaker than those considered in previous studies. We analyzed the differences according to the magnitude of the earthquakes to obtain meaningful results.


