1. INTRODUCTION
The global temperature rise of recent decades is believed to have been driven mainly by the release of carbon dioxide into the Earth’s atmosphere by the burning of fossil fuels (e.g., Solomon et al. 2007). Determining an exact level of warming due to man-made greenhouse gases requires an unequivocal understanding of the natural causes of climate change. Provided that the Sun is the fundamental energy source in the Earth’s thermal energy budget, and that the radiative equilibrium temperature of the Earth is determined by a balance between the solar irradiation and the Earth’s energy loss by outgoing long-wave radiation, sun-climate connections as possible forces of nature that cause the global warming have been of general interest (Ney 1959;Dickinson 1975;Tinsley 2000;Roldugin & Tinsley 2004;Scafetta & West 2006;Burns et al. 2007;Haigh 2007;Burns et al. 2008;Cho & Chang 2008;Gray et al. 2010;Cho et al. 2012;Lee & Yi 2018;Muraki 2018). For instance, Eddy (1976) who showed the practical absence of sunspot activity during the period from 1645 to 1715, which is now known as the Maunder minimum (Spörer 1887;Maunder 1904), has claimed that this period coincides with an era when extremely cold weather prevailed in Western Europe including Central England. Thus, any variability in solar insolation has the potential to affect the terrestrial climate (Haigh 1996, 2007;Solanki et al. 2002;Solanki et al. 2013). It has been shown, however, that space-born radiometers providing accurate and stable measurements suggest that the value of the total solar irradiance (TSI) on the top of the Earth’s atmosphere, defined as the total power from the Sun impinging on a unit area perpendicular to the Sun’s rays, is 1,360.8 ± 0.5 Wm–2 under solar minimum conditions (Kopp et al. 2012), and it changes by less than ~0.1 % over the time scale of the solar cycle, which is clearly insufficient to account for the rise in global temperature. This small amount, however, may be sufficient to cause a significant climate effect if it is present over a long period of time or if there are nonlinear responses that amplify feedback.
On the basis of the fact that such variability is insufficient to influence Earth’s climate, nonetheless, answering the question of solar contribution to variation in the terrestrial climate seems premature. This is because the magnitude of variations in solar radiation is a strong function of wavelength. Changes in the ultraviolet (UV) range of the solar spectrum with the highest amplitude influence the structure of the middle atmosphere by affecting stratospheric chemistry through the modification of the photochemical dissociation rates of ozone (Emmert & Picone 2010;Gray et al. 2017). The resulting warming of the lower stratosphere via absorption of solar UV radiation by atmospheric ozone and other species of gas molecules may propagate its effects dynamically downwards to the troposphere, and cause both poleward shifts in position of the subtropical westerly jets, and poleward shifts of the tropical cyclone tracks, as those in El Niño periods (Kim et al. 2017;Kim et al. 2018).
The Sun may also influence the terrestrial climate in other indirect ways (Tinsley & Deen 1991;Pudovkin et al. 1997;Pudovkin 2004;Roldugin & Tinsley 2004;Haigh 2007;Bazilevskaya et al. 2008;Svensmark et al. 2009). An eminent example is by affecting the Earth’s climate by modulating the magnitude of influx of high energy galactic cosmic rays (GCRs), which has been known to change according to the magnetic characteristics of the heliosphere (Forbush 1954;Kolomeets et al. 1973;Kane 2005;Usoskin 2013). That is, incoming GCRs interact with atmospheric molecules, and subsequently induce important results in atmospheric ionization and condensation processes. One of the most important implications is modifying the coverage and physical properties of clouds, and thus the Earth’s radiative balance (Svensmark & Friis-Christensen 1997;Marsh & Svensmark 2000;Pallé Bagó & Butler 2000;Todd & Kniveton 2004;Harrison & Stephenson 2006;Pierce & Adams 2009;Singh & Singh 2010;Rawal et al. 2013;Svensmark et al. 2017). Changes in the total albedo via a GCRs-cloud interaction, therefore, may help in explaining how a relatively small change in TSI can provoke changes in Earth’s climate. There is further evidence that GCR influx is phenomenologically related to tropical cyclone activity (Cohen & Sweetser 1975;Kavlakov 2005;Elsner & Jagger 2008;Pérez-Peraza et al. 2008;Hodges & Elsner 2011;Oey & Chou 2016). Increases in GCR influx penetrating the Earth’s atmosphere during solar minima contribute to an increase in cloudiness, and therefore tropical cyclone intensification, via increases in the convective available potential energy (CAPE).
It may be helpful to briefly mention a process associated with GCRs that causes a modification in cloud microphysics, because clouds play a fundamental role in the Earth’s radiative energy equilibrium. The occurrence of clouds can be predicted by meteorological parameters, such as, humidity and temperature. In condensing water vapor to a cloud droplet, physical characteristics of clouds, including reflectivity, lifetime, coverage, size distribution, are controlled by cloud condensation nuclei (CCN) of 50– 100 nm through a series of subtle and complex processes. Two ways by which GCRs may affect the formation of cloud droplets are by the ion-aerosol clear-air mechanism and the ion-aerosol near-cloud mechanism (see Carslaw et al. 2002 and reference therein). The ion-aerosol clearair mechanism is based on the idea that the presence of ions enhanced by electric attraction force the birth and early growth of ultra-fine condensation nuclei (UCN) in the upper troposphere, which then become condensation nuclei (CN) that may eventually become CCN. The ionaerosol near-cloud mechanism is less well understood than the former. This mechanism is based on the fact that the aerosol electrical charge is different near clouds than it is in clear air. Highly charged aerosols and the electric field at cloud boundaries, the development of which is modulated by GCRs, may migrate within cloud and enhance aerosol efficacy as ice-forming nuclei. The CLOUD (Cosmics Leaving Outdoor Droplets) experiment conceived at CERN in the late 1990s was created to systematically test the link between GCRs and CCN (Kirkby 2001;Dunne et al. 2016;Gordon et al. 2017). The CERN CLOUD experiments are the most comprehensive laboratory measurements of aerosol nucleation rates so far achieved. It should be pointed out, however, that according to current measurements and simulations, the hypothesized effect is too small to account for the observed climate change due to the slow growth of UCN, though unknown mechanism may be operating to elevate the growth of UCN (Pierce & Adams 2007, 2009;Snow-Kropla et al. 2011;Dunne et al. 2012;Kazil et al. 2012;Yu et al. 2012;Yu & Luo 2014).
In this study, we explore associations between the total sunspot area and characteristics of clouds by calculating normalized cross-correlations. We note that all the phenomenological studies on the GCR-cloud relation are focused on the relative difference because the correlation between changes in low cloud fraction and changes in GCR influx was first reported by Svensmark & Friis-Christensen (1997). The total amount of low-lying cloud must be considered to calculate the albedo. However, the relative change is useful only when a background variation is trivial or the trend of the relative change is the same as that of the background variation that is to be detrended for the observed relative change. Unlike as in previous studies, we have directly employed cloud coverage with respect to the altitude ranges as a whole without detrending along with some physical properties of clouds, such as, optical depth and top temperature. We also investigated associations with the solar north-south asymmetry, having been motivated by the fact that the mean global temperature anomaly is smaller when the solar northern hemisphere is active than when the southern hemisphere is active (Cho et al. 2012). It is well known that the magnitude of GCR influx depends on the solar north-south asymmetry (e.g., Cho et al. 2011). To compare the level of possible contributions, we repeat the same analysis with the Southern Oscillation Index (SOI), which is a measure of the El Niño-Southern Oscillation (ENSO) global climate regulating phenomena. This paper is organized as follows. We begin with descriptions of the data analyzed for the present study in Section 2. We present and discuss results in Section 3. Finally, we briefly summarize and present conclusions in Section 4.
2. DATA
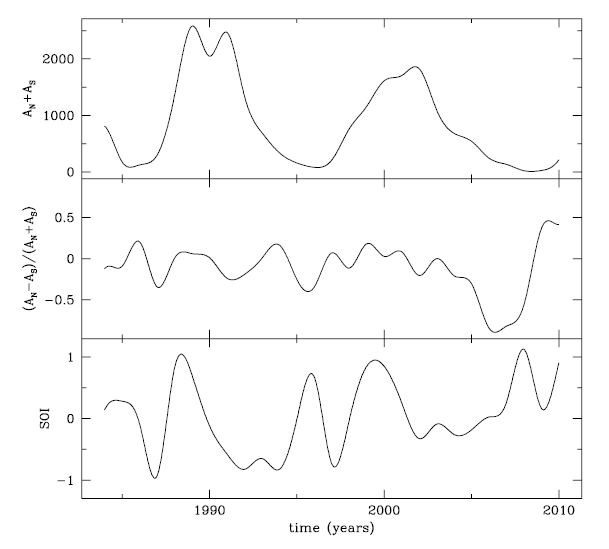
For a proxy of solar variability, we used sunspot area data from the NASA Marshall Space Flight Center website (http://solarscience.msfc.nasa.gov/greenwch.shtml). We downloaded the daily sunspot area in units of millionths of a hemisphere separately for the Northern Hemisphere, AN, and the Southern Hemisphere, AS, during the period from 1983 to 2009, approximately spanning solar cycles 22 and 23. The solar north-south asymmetry is calculated by the definition as (AS – AN) / (AS + AN). For the time-series of the SOI index, we have extracted daily data from the National Oceanic and Atmospheric Administration (NOAA) website (https://www.ncdc.noaa.gov/teleconnections), which provides various teleconnection indices representing large-scale anomalies of the pressure system in space and time that influence atmospheric circulation (Kim & Chang 2019). Having downloaded all the daily data, we averaged those data yearly so that we obtained in the normalized cross-correlations in yearly values. In Fig. 1, we show the yearly total sunspot area and the yearly solar north-south asymmetry in the top and middle panels, respectively. In the bottom panel, we show the yearly SOI index.
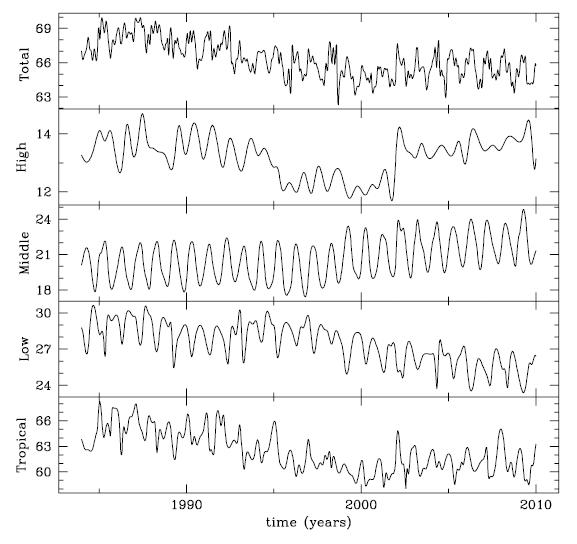
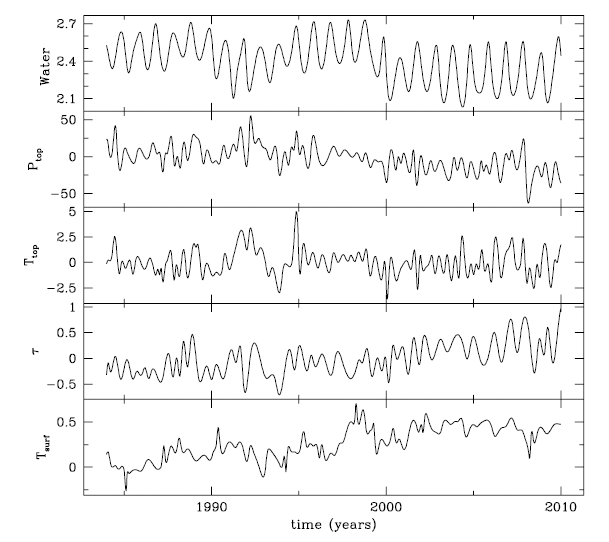
The International Satellite Cloud Climatology Project (ISCCP) began in 1982 as a part of the World Climate Research Program (WCRP) to compile weather satellite radiance measurements, and it developed a climatology of cloud radiative properties (Schiffer & Rossow 1983). The legacy dataset known as ISCCP D series ended in 2009 and was upgraded to the H series. The resolution of the D2 product is 280 km in equal-area grid. Taking advantage of the classification of cloud type in the latest ISCCP D2 product, we downloaded cloud quantities in percentages from the ISCCP website (https://isccp.giss.nasa.gov/ products/browsed2.html). In Fig. 2, we show the yearly coverage of cloud in terms of total cloud, high cloud, middle cloud, and low cloud for the whole globe, and cloud in tropical regions (15°N–15°S) during the period from 1983 to 2009, from top to bottom panels, respectively. Cloud over fraction (%) represents the fractional area covered by clouds as observed by satellites. The altitude ranges covered by cloud are: greater than 680 mbar (0–3.2 km) for low cloud, 440–680 mbar (3.2–6.5 km) for mid-level cloud, 50–440 mbar (6.5–16 km) for high cloud. In Fig. 3, we show the total column water vapor in cm used to calculate the column mass density of the cloud, the top pressure in mbar representing the location of the radiating top of the cloud, the top temperature in K from which the top pressure can be calculated, the cloud optical depth representing the optical thickness of the cloud at visible wavelengths (approximately 0.6 μm), the global surface air temperature in K during the period from 1983 to 2009, from the top to the bottom panel, respectively.
3. NORMALIZED CROSS-CORRELATION
As a measure of similarity between two physical quantities, one may calculate the normalized cross-correlation which is essentially similar to a convolution in nature. That is, the normalized cross-correlation is defined by
where
and
where τ is the displacement and u* (τ) is the complex conjugate of u (τ). For all t, . By this normalization, the cross-correlation becomes a time-dependent Pearson correlation coefficient, that is, z(0) becomes the Pearson correlation coefficient. Note that the argument of the function at the extremum is called the lag if it is positive, or the lead if it is negative. In other words, if the argument of w(t) is positive the first quantity follows the second quantity by the amount of its value, and vice versa. The correlation of a signal with itself is called the autocorrelation.
In Fig. 4, we show the normalized cross-correlation resulting from the coverage of total cloud, cloud in the tropics, high-level cloud, medium-level cloud, and lowlevel cloud, in columns from left to right, respectively. In the top row, the normalized cross-correlations are calculated between the solar north-south asymmetry and those parameters mentioned just above, respectively. In the middle row, the normalized cross-correlations are calculated between the total sunspot area and those shown in Fig. 2, respectively. In the last row, for comparison, the normalized cross-correlations are calculated between the SOI index and those data shown in Fig. 2, respectively. For the solar north-south asymmetry, the coverage of highlevel cloud shown in panel (c) is positively correlated with approximately +7 years and the cloud coverage of low-level cloud in panel (e) is marginally correlated with approximately –2 years. Hence, the coverage of highlevel cloud is at a maximum when the solar north-south asymmetry is approximately at a minimum, or when more sunspots appear in the northern hemisphere of the Sun, in the sense that the periodicity of the solar north-south asymmetry is ~12 years. The coverage of low-level cloud is maximum around one or two years after the solar northsouth asymmetry is at a maximum, or when more sunspots appear in the southern hemisphere of the Sun. For solar activity based on the total sunspot area, only the coverage of low level-cloud shown in panel (j) is positively correlated with approximately +3–4 years. That is, the coverage of lowlevel cloud is at a maximum during the descending phase of solar activity. For the SOI index shown for comparison, surprisingly, any cloud coverage is unlikely to be correlated (e.g., see Wang & Su 2015).
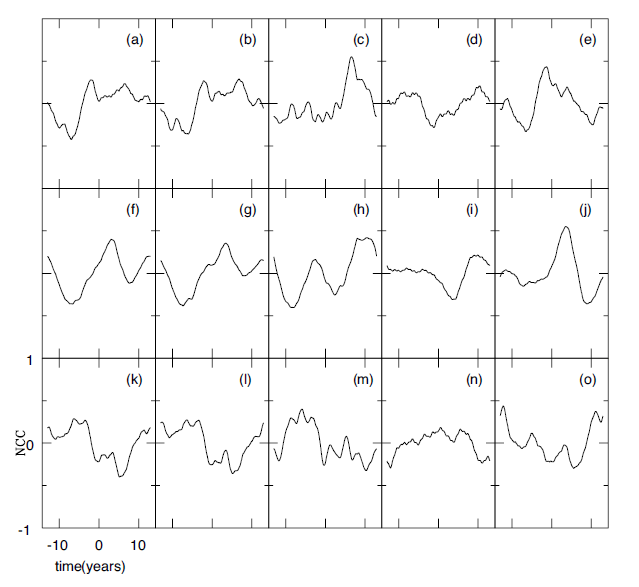
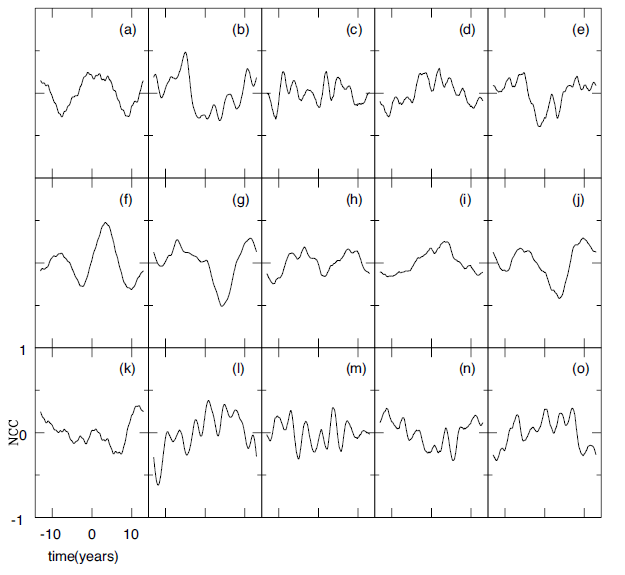
In Fig. 5, we show the normalized cross-correlation resulting from the total column water vapor, global surface air temperature, top temperature, top pressure, and cloud optical depth in columns from left to right, respectively. From top to bottom, as in Fig. 4, the normalized crosscorrelations are calculated using the solar north-south asymmetry, the total sunspot area, and the SOI index, respectively. For the solar north-south asymmetry, the global surface air temperature shown in panel (b) is positively correlated with approximately –5 years and the cloud optical depth in panel (e) is marginally anticorrelated with approximately –0.5 years. That is, the global surface air temperature reaches a maximum five years after the solar north-south asymmetry is at a maximum, as Cho et al. (2012) claimed earlier. The optical depth is at a minimum around when the solar north-south asymmetry is at a maximum. For solar activity based on the total sunspot area, the total column water vapor shown in panel (f ) is correlated with approximately 3 years, the global surface air temperature in panel (g) is anticorrelated with approximately 4 years and the cloud optical depth in panel (j) is marginally anticorrelated with approximately 4 years. Hence, the total column water vapor is at a maximum about 3 years after the solar maximum. This finding may correspond to what Svensmark et al. (2009) found, i.e., low clouds contain less liquid water following the Forbush decrease. Furthermore, the global surface air temperature and the cloud optical depth are at a minimum during the descending phase of solar activity, rather than exactly during the solar minimum. Any of the physical properties of cloud are unlikely to be correlated with the SOI index shown for comparison.
4. CONCLUSIONS
GCRs modulated by solar activity are one of principal agents of solar variability in the changes to Earth’s climate. Motivated by the fact that GCR influx may modulate the coverage of low-level cloud by involving cloud processes such as forming CCN, and in turn may modulate the Earth’s radiation budget, we investigated associations between solar variabilities and the characteristics of clouds using normalized cross-correlations. We also explored the influence of the solar north-south asymmetry, comparing it with that of the SOI index. Unlike previous studies, we employed cloud data extracted from the ISCCP website as a whole time-series without detrending. We believe this to be crucial because the relative difference only yields a meaningful result when the relative change is similar to the overall trend, which is clearly not the case as shown in Figs. 2 and 3. The properties of cloud, including the cloud coverage, vary primarily by the distribution of cloud over the continents and oceans. The next most important agents of change are seasons and climatic oscillations, such as, ENSO, the North Atlantic Oscillation (NAO).
In this paper, we calculated the normalized crosscorrelations of the total sunspot area, the solar northsouth asymmetry, and the SOI index with cloud coverage at different altitude ranges, total column water vapor in cloud, global surface air temperature, cloud top temperature, cloud top pressure, and cloud optical depth. As a result, our main findings are:
(1) The coverage of high-level cloud is at a maximum when the solar north-south asymmetry is approximately at a minimum. The coverage of low-level cloud is at a maximum around one or two years after the solar northsouth asymmetry is at a maximum. The global surface air temperature reaches a maximum 5 years after the solar north-south asymmetry is at a maximum. The optical depth is at a minimum when the solar north-south asymmetry is at a maximum.
(2) The coverage of low-level cloud is at a maximum during the descending period of solar activity. The total column water vapor is at a maximum one or two years after the solar maximum. The global surface air temperature and the cloud optical depth are at a minimum during the descending phase of solar activity.
(3) Surprisingly, the SOI index, shown for comparison, is unlikely to be correlated with any cloud coverage, or any of the physical properties of cloud. Thus, our findings can be considered significant.


