1 INTRODUCTION: MOTIVATION OF THE PRESENT RESEARCH
The present study was conducted considering the following background. Periodicities of 11 and 22 years have been found in the growth rates of tree rings in trees that have survived on Yaku Island for 1,924 yr (Muraki et al. 2015). Yaku Island is located at 30°20′N, 130°30′E in southern Kyusyu, Japan. Quite surprisingly, the aforementioned periodicities are related to the Wolf Minimum, at 1290–1350 CE; the Spörer Minimum, at 1440–1550 CE; the Maunder Minimum, at 1650–1725 CE; and the Dalton Minimum, at 1810–1840 CE. These periods are well known as grand minima of solar activity.
To investigate the reason for the appearance of 11-year and 22-year periodicities in the tree rings, we analyzed the meteorological data of Yaku Island. Fortunately, records have been kept since 1938 for temperature, rainfall, and daylight hours and are available from the Japan Meteorological Agency (JMA 2017). The data analysis revealed only a oneyear periodicity for temperature and rainfall data. In the daylight hours (insolation) dataset, however, an 11-year periodicity as well as a 22-year periodicity were found.
The 11-year periodicity was found in June, when the island is shaded by thick clouds caused by the monsoon, whereas the 22-year periodicity was observed in July and August, when the island is usually affected by subtropical high atmospheric pressure. Cloudiness affects the growth rate of cedar trees in terms of photosynthesis. Therefore, we considered that the amount of clouds over the island may be affected by solar activity. However, the origin of the 22- year periodicity remains unclear.
The remainder of the present paper is organized as follows. In the next section, we explain the coupled harmonic oscillator model and present an application to solar activity. The model is then applied to El Niño–southern oscillation (ENSO). We demonstrate that the 22-year periodicity found in the Yaku cedar tree rings may be attributed to ENSO. Finally, we discuss the origin of the coupled harmonic oscillator model by comparing recent helioseismological observations.
2 APPLICATION OF THE COUPLED OSCILLATOR MODEL TO SOLAR ACTIVITY
First, we assume that two oscillators exist in the Sun with slightly different periodicities. Solar magnetic activity can be described by the superposition of each amplitude of the oscillators.
We refer to the two oscillators having slightly different angular frequencies of ωA and ωB as Oscillator-A and Oscillator-B, respectively. Then, the respective oscillations may be described by sin(ωA∙t) and sin(ωB∙t) waves. Considering each phase, i.e., α and β, these oscillators may be expressed as sin(ωA∙t+α) and sin(ωB∙t+β), respectively. For simplicity, we take β = 0, and the absolute amplitude of each oscillator is set at 1.0. Then, the combined amplitude of the two oscillations is given by
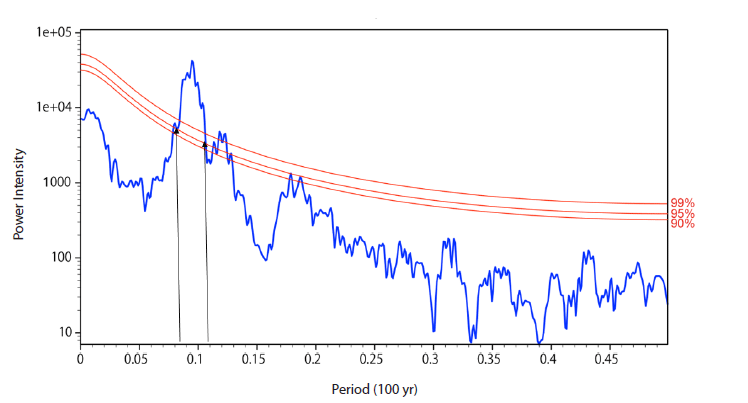
Herein, we let TA and TB denote the longest solar cycle and the shortest solar cycle observed between 1700 and 2015 CE (ωA = 2π/TA, ωB = 2π/TB), which are 12.05 yr and 9.52 yr, respectively. These values were selected on the basis of Fourier analysis of the 315 yr sunspot activity. The results of the Fourier analysis are shown in Fig. 1. We selected the above values from the crossing points of the 2σ line (95 % confidence level). The angular frequencies ωA and ωB are 0.521 and 0.660, respectively.
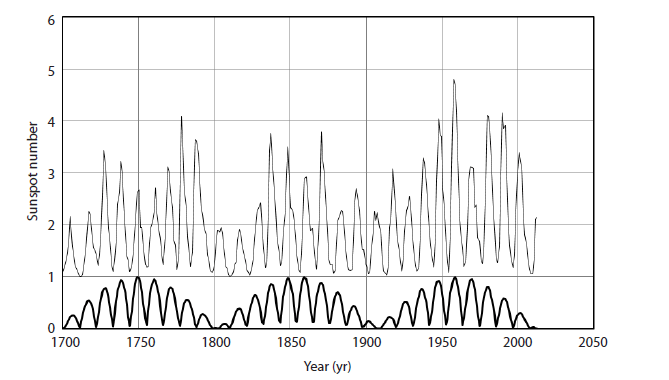
Here, the term sin{(ωA+ωB)/2×t} expresses an average 10.6 yr periodicity, whereas the term cos{((ωA−ωB)/2×t} corresponds to a 89-year periodicity. The 89-year periodicity is known as the Gleissberg periodicity (Peristykh & Damon 2003). Quite interestingly, the same periodicity has been independently detected in a different sample of Yaku cedar tree rings based on C13 measurement (Kitagawa & Matsumoto 1995). However, we were unable to reproduce the 22-year periodicity. In Fig. 2, we compare our simple expression with actual sunspot data.
3 APPLICATION OF THE COUPLED OSCILLATOR MODEL TO EL NIÑO–SOUTHERN OSCILLATION
ENSO is observed as oscillation of the equatorial ocean temperature between the east coast of Indonesia and the west coast of Peru. In this study, we examine whether ENSO could produce the 22-year periodicity by using the coupled oscillator model. Details on ENSO may be found elsewhere (Hare & Mantua 2000; Barlow et al. 2001; Schneider & Miller 2001). Periodicities of 5.35 and 3.55 yr were used as the two fundamental oscillation frequencies (Guilyardi 2006). These numbers were obtained from actual observation data; considering the breadth of the actual data, the two periodicities can be described appropriately as (5.35±0.6) yr and (3.55±0.25) yr, respectively.
The combined amplitude of the two oscillations can then be expressed numerically as
Here, the angular frequencies of ωA and ωB are 1.769 and 1.185, respectively. From the term sin{(ωA−ωB)/2∙t}, we can obtain the 21.5 yr periodicity; considering the breadth of the fundamental modes, the value is described as 21.5 ± 5 yr. Therefore, we believe that the 22-year periodicity found in the Yaku cedar tree rings are related to ocean oscillation rather than solar activity.
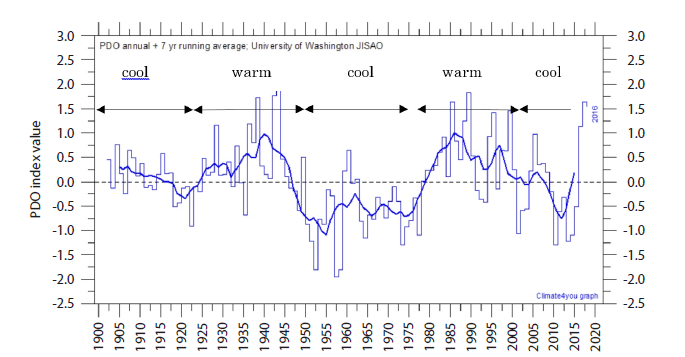
The teleconnection process from the equator to the Pacific Ocean induces several oscillations over the ocean surface, such as Pacific decadal oscillation (PDO; Minobe et al. 2004). Nitta (1990) also reported oscillation arising from the La Niña phenomenon. When La Niña appears, the high tropical atmospheric pressure affecting the Japanese coastal region is depressed. The frequent appearance of clouds is then expected over Yaku Island. This effect gives rise to variation in the growth rate of the tree rings via photosynthesis. A similar phenomenon was observed in the west coast of USA (Horel & Wallace 1981).
4 MERIDIONAL CIRCULATION OF SOLAR PLASMA AND THE COUPLED OSCILLATOR MODEL
In this section, we discuss the correspondence of the two coupled harmonic oscillators and actual solar activity. Thus far, our discussion has been based on complete phenomenological examination. Here, we compare the proposed model with actual observations of solar activity and attempt to understand the dynamics of the Sun relative to the coupled oscillator model.
Based on helioseismological data obtained by the solar dynamic observatory (SDO)/Michelson Doppler imager, Zhao et al. (2013) reported the following results on the solar convection zone. The meridional circulation of the plasma flow is formed by double layers. The plasma flow of the outer layer is carried from the equator poleward and perhaps returns through the shallow interior path from the polar side toward the equator; the corresponding depth is r = 0.82−0.91 Rʘ. At the deeper layer of the convection zone, at r = 0.70−0.82 Rʘ, the plasma is assumed to flow from the equator poleward, at r = 0.70 Rʘ and likely takes the return path through the middle region of the convection zone, at r = 0.85 Rʘ. In the northern hemisphere, the plasma gas flows counterclockwise in the upper cell and clockwise in the lower cell. To this point, only observational results have been considered. Based on these observation results, our model is hereinafter proposed.
We assume that the currents in the upper and inner cells constitute an oscillator and interact. In the northern hemisphere of the Sun, the toroidal current of the upper cell produces a poloidal magnetic field that provides south polarity (S) around the north pole region of the Sun. The toroidal currents of the outer and inner cells constitute the coupled harmonic oscillator.
If we assume that the strength of the poloidal magnetic field at the north pole region is on the order of 10-4 T, then the maximum strength of the toroidal current can be estimated as 3×10¹¹ A by the following equation: B = μI(2√8·r). Here, we adopt a value of μ = 4π×10-7. It should be noted, however, that because denser matter exits in the convection zone, μ requires a correction. We set r to 6×10⁸ m. In the parallel flow region at radius r = 0.85 Rʘ, the distance between the two cells (plasma loops) were rather short in comparison with that in the other region. If we assume a distance approaching 700 km between the two cells, a much higher magnetic field of approximately 1,000 G is expected to be induced by turbulence in that region. This magnetic field is on the same order as that in the sunspots. The 22-year variation of the solar magnetic field is induced by the competition of the two currents between the inner and outer cells; this allows the overall features of the solar magnetic field to be determined. The coupled oscillator model is pictorially represented in Fig. 3.
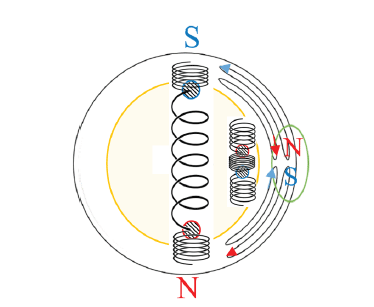
Fig. 3 shows the solar minimum reported in 1986. Here, the N- and S-magnetic poles, which correspond to the plumbs of the coupled harmonic oscillator, are pictorially represented. The plumbs of the inner loop approached the closest distance, whereas those of the outside loop remained at the farthest distance. At the equatorial region of the Sun, the embryos of the magnetic monopoles collide with each other and may result in pair annihilation, or cancellation. The energy of the cancellation in that region is estimated as ~3×10²² Mx [G∙cm2]. Some parts are lost through coronal mass ejection (CME); the remaining embryos are pulled back by the attractive force between the N and S poles.
The correspondence described here can be compared with the relationship between the thermodynamics and statistical mechanics of solar activity. The former describes the thermal phenomena from a macroscopic perspective, whereas the latter explains the phenomena from a microscopic perspective.
The meridonal circulation crossing the inhomogeneous magnetic field (-∂B/∂t ≠ 0) may have produced the toroidal current (-∂B/∂t = rotE) (Zhao et al. 2014). In this paper, however, we do not join the historical debates on the origin of the magnetic field (Babcock 1961; Hotta et al. 2014; Belucz et al. 2015; Zharkova et al. 2015). Instead, we simply assume that two toroidal currents each exist in the inner cell and the outer cell. For example, the current in the outer cell becomes stronger, according to the law of Lentz, and an inverse current may be induced in the inner cell. In addition, a poloidal magnetic field with opposite polarity may be generated by the inner cell. Thus, the currents in the inner cell and outer cell constitute a coupled harmonic oscillator. Two coupled oscillators exist in the Sun: one each in the northern and southern hemispheres. These oscillators are shown pictorially in Figs. 4 and 5 (Zhao et al. 2013).
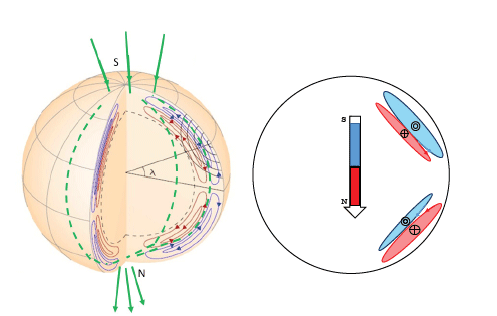
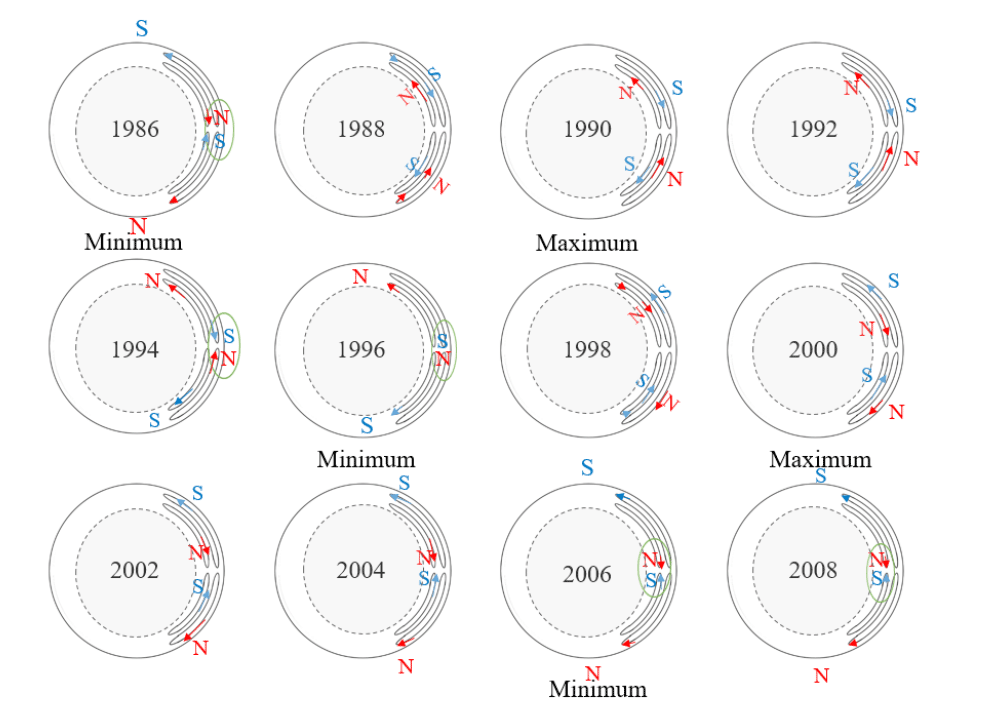
In closing, we consider two factors. The first is the average speed of the meridional flow of the inner and outer loops. Taking the average speed of the inner flow as <vin> ≈ 6.1 m/s and that for the outer flow as <vout> ≈ 5.5 m/s, the 9.5 yr and 12.1 yr circulation periodicities of the plasma flow can be reproduced. According to the actual observation, the meridional flow is very slow near the equator, whereas at higher latitudes, the meridional flow increases to approximately 10 m/s (Zhao et al. 2013). The second factor is that sunspot embryos may be produced at r = 0.85 Rʘ at the middle latitude of the Sun when the two cells approach the nearest distance. The embryos of the magnetic poles, which are tiny magnets composed of plasma vortex, are produced by interaction of the two flows, which produces turbulence. These embryos surface by the magnetic levitation mechanism (Choudhuri et al. 1995; Charbonneau 2010).
5 VARIATION OF COSMIC RAY INTENSITY OBSERVED BY NEUTRON MONITORS AND THE PROPOSED MODEL
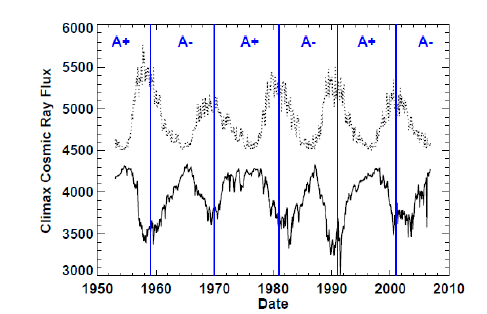
In this section, we provide an interpretation of the cosmic ray intensity measured for a long period by using neutron monitors. As known by cosmic ray physicists, the shapes of the intensity distributions of the solar minimum during the periods 1969–1980 and 1992–2000 differ significantly from those of 1960–1968, 1980–1991, and 2004–2012 (Fig. 6; Hathaway 2010). The data obtained between 1969 and 1980 and between 1992 and 2000 have a flat distribution of cosmic ray intensity, whereas the intensity of that obtained during the other periods exhibited a sharp peak. We point out this difference based on the coupled oscillator model presented herein. The discrepancy may be attributed to differences in oscillator position, such as whether the solar minimum was induced by the outer or inner oscillator. In the solar minimum produced by the outer oscillator, such as that occurring in 1986, the magnetic poles were formed by the outside loop. The magnetic field produced by the outer oscillator is stronger than that produced by the inner oscillator owing to differences in the current radius.
6 SUMMARY
The conclusions of the present study are summarized as follows.
-
We use a coupled oscillator model to investigate a possible explanation of solar activity.
-
By taking the periods of the two oscillators as 12.5 yr and 9.5 yr, the 89-year Gleissberg cycle can be reproduced.
-
We speculate that the two oscillators represent ring currents induced by plasma motions of the inner and outer loops of the meridional circulations.
-
Two types of variation in cosmic ray intensity during the solar minimum may be related to the position of the oscillators, i.e., whether they are induced by the outer or inner layer of the convection zone.
-
The coupled harmonic oscillator model can be applied to ENSO. The 22-year oscillation of the solar environment, reproduced as shown in Fig. 7, is related to ENSO rather than solar activity. Moreover, the coupled oscillator model has successfully explained other astrophysical objects (Osaki 1975; Aizenman et al. 1977).
