1. INTRODUCTION
The fluxgate magnetometer (FGM) is an essential instrument used in various applications such as space environment monitoring, navigation, and space physics research. Although FGMs are generally designed to measure along three orthogonal axes, orthogonality errors among the axes can degrade the accuracy of magnetic field measurements. Thus, the ground-based orthogonality correction is important and essential for accurate measurements. Magnetometers mounted on satellites are typically calibrated on the ground before additional in-flight calibration during satellite operations (Merayo et al. 2000; Auster et al. 2008; Balogh 2010; Connerney et al. 2015, 2017; Magnes et al. 2020).
Ground-based orthogonality correction of magnetometers is typically performed using Helmholtz coils to collect the calibration data, followed by mathematical calculations. Conventional calibration methods involve generating precise magnetic fields using Helmholtz coils and deriving correction matrices through mathematical calculations. During this process, data is collected by rotating the magnetometer to various angles, requiring auxiliary equipment such as collimators and rotation jigs to ensure accurate alignment and rotation (Chiang et al. 2015; Connerney et al. 2017). However, even with precise rotations, accurate calibration cannot be achieved if the orthogonality of the Helmholtz coil’s axes is not guaranteed. Addressing these issues often necessitates additional experimental designs and data processing, particularly when magnetic fields must be applied along all three axes of the Helmholtz coil.
In our case, it was challenging to generate accurate magnetic fields on two of the three axes of the Helmholtz coil, making it difficult to apply conventional methods. To overcome this limitation, we designed a novel calibration method that utilizes only one axis of the Helmholtz coil actively while two axes just compensate the Earth magnetic field. By not relying on the other two axes, our approach eliminates uncertainties arising from the orthogonality of the Helmholtz coil system. Additionally, it simplifies the calibration process by removing the need for supplementary experimental setups or calculations related to orthogonality of Helmholtz coil. This method reduces dependence on the orthogonality of the Helmholtz coil, and mitigates the complexity of experimental settings and data processing, while maintaining precision of calibration results. We also review the orthogonality correction results of the FGM on the CAS500-3 satellite and discuss the linearity and noise of the FGMs observed during the calibration process.
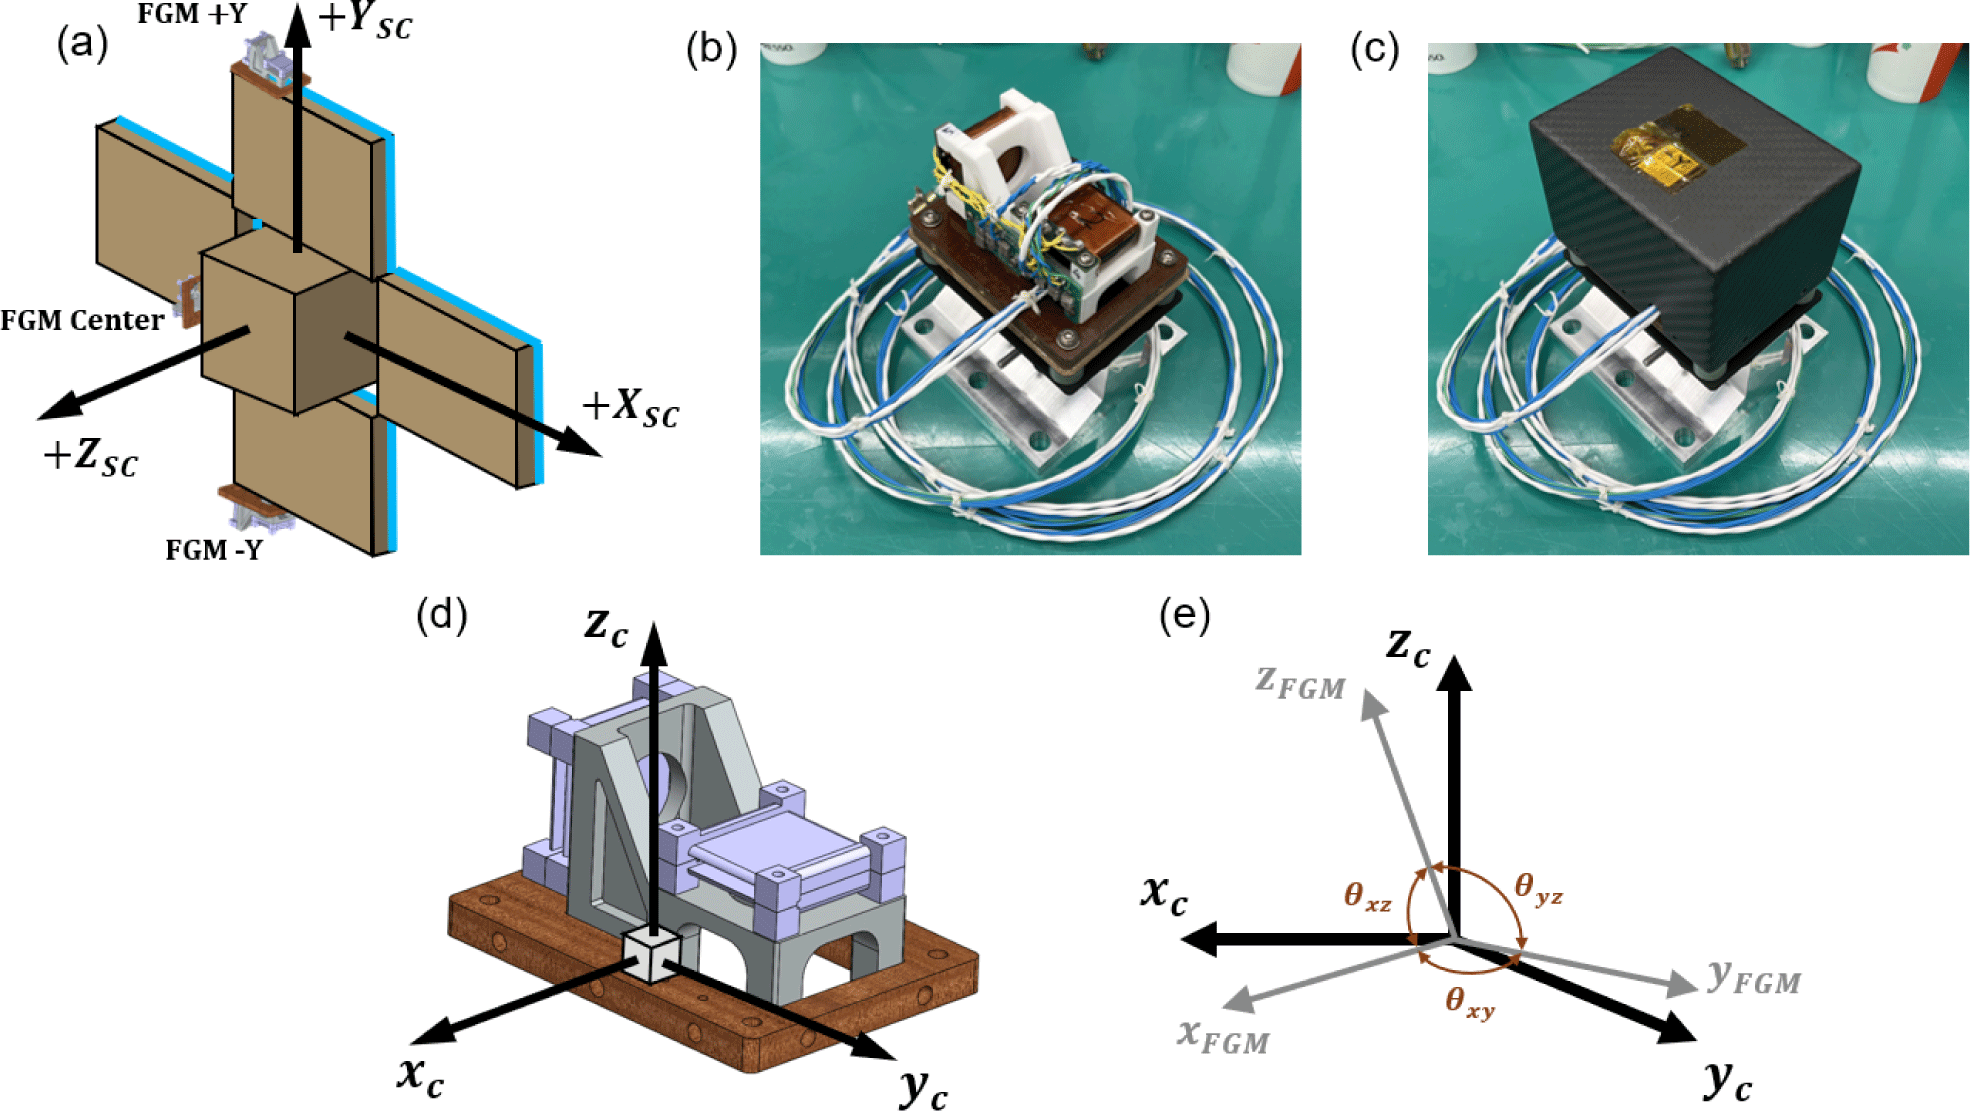
Adaptive in-phase magnetometer (AIMAG) is a ring-core type FGM capable of measuring three-axis magnetic fields, and it is scheduled to be mounted and launched on the CAS500-3 satellite (Ryu et al. 2022). Main purpose of the AIMAG is measuring the magnetic field generated by equatorial electrojet (EEJ) which can be observed near equatorial region in the low Earth orbit. The structure and operation principles of the AIMAG have been described in previous studies (Lee et al. 2023). Fig. 1 shows the position, structure and coordinate system of the AIMAG. As shown in Fig. 1(a), three FGMs are planned to be positioned on each side of the solar panels (FGM -Y, FGM +Y) and one on the satellite body (FGM Center). The reference coordinate system for the measurement is based on the alignment cube, as shown in Fig. 1(b). Due to the practical limitation of the manufacturing process, the axes of the FGM are not orthogonal, resulting in a discrepancy between the cube coordinate system and the mechanical coordinate system of the FGM, as illustrated in Fig. 1(e). The limitations of the manufacturing process of the magnetometer can be classified into two main categories. The first category includes machining errors that occur during raw material processing, which can result in slight deviations in the dimensions or shapes of the components. The second category involves assembly errors, as the magnetometer is not constructed as a single integrated structure. These errors arise during the assembly process when individual components are aligned and joined, potentially causing further deviations from the intended orthogonal configuration. These factors collectively contribute to the misalignment between the mechanical and reference coordinate systems of the FGM.
2. METHODOLOGY
To generate magnetic fields necessary for orthogonality correction of AIMAG, we utilized the three-axis Helmholtz coil in the non-magnetic laboratory of the Korea Research Institute of Standards and Science (KRISS; Park et al. 2002). The Helmholtz coil is suitable for orthogonality correction as it generates a uniform magnetic field in a single direction. The Helmholtz coil at KRISS can maintain a uniform magnetic field within a cube with ~10 cm edge length, inside a 1.8 m diameter coil, and it can generate a pure magnetic field in the -z direction while keeping the magnetic fields in the x and y directions near 0 nano tesla (nT). Since only the magnetic field along z-axis of the Helmholtz coil can be controlled, the experiment was designed accordingly, as explained in more detail in Section 2.3.
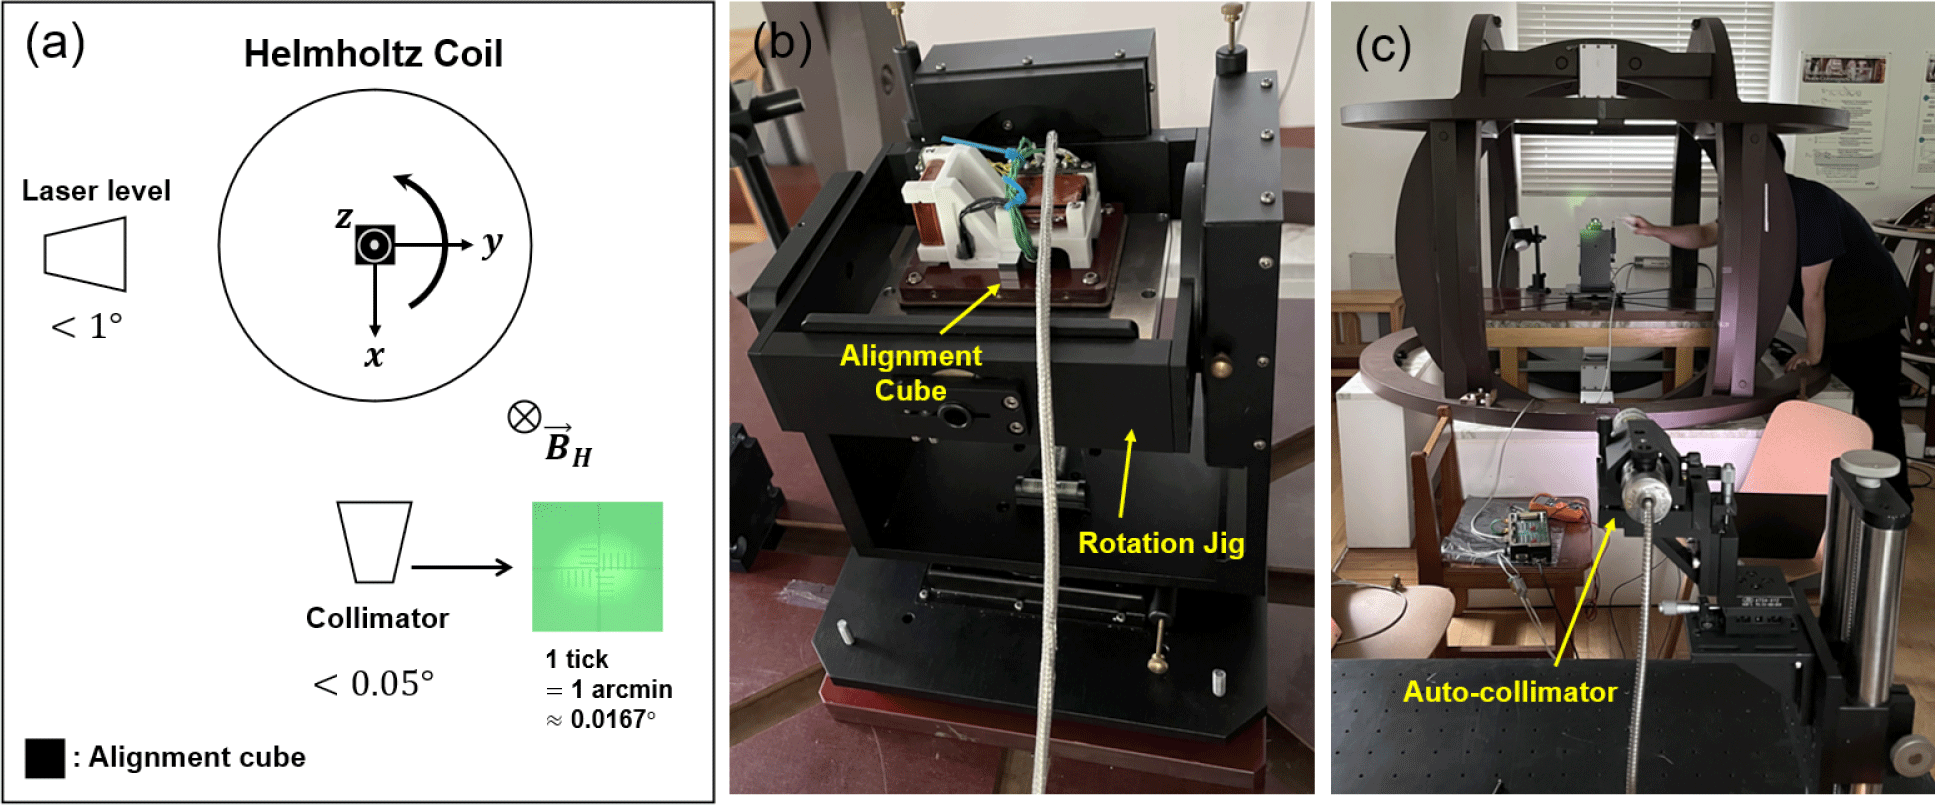
Fig. 2 shows the experimental setup. To rotate the sensor, a non-magnetic rotation jig was used (Fig. 2(b)). For precise rotation, an alignment cube, autocollimator (Fig. 2(c)), and a laser level were utilized. The alignment cube with an edge length of 1 cm, attached to the side of the FGM, serves as the reference for the FGM’s coordinate system. The cube is manufactured with a precision of 2 arcsec in all orthogonal directions. A collimator was placed in front of the cube and a laser level on the side to ensure that the FGM was rotated by 90°, as exact as possible. After each rotation, the collimator and laser level were used to verify that the front face alignment error did not exceed 0.025° and the side alignment error remained below 1.0°.
The experiment was executed in sequence with applying magnetic fields in the -z direction through the Helmholtz coil and increasing the field from 15,000 nT to 55,000 nT in 5,000 nT steps while collecting the FGM’s output data. The magnetic field measurements were taken with a time resolution of 40 Hz. Each axis was measured individually for 30 sec, resulting in a total of 1,200 data points per step. This process was repeated sequentially for each of the three axes. The data consists of the FGM’s output in voltage, corresponding to the applied magnetic field from the Helmholtz coil for each axis. This data was then used to obtain the calibration data necessary for orthogonality correction.
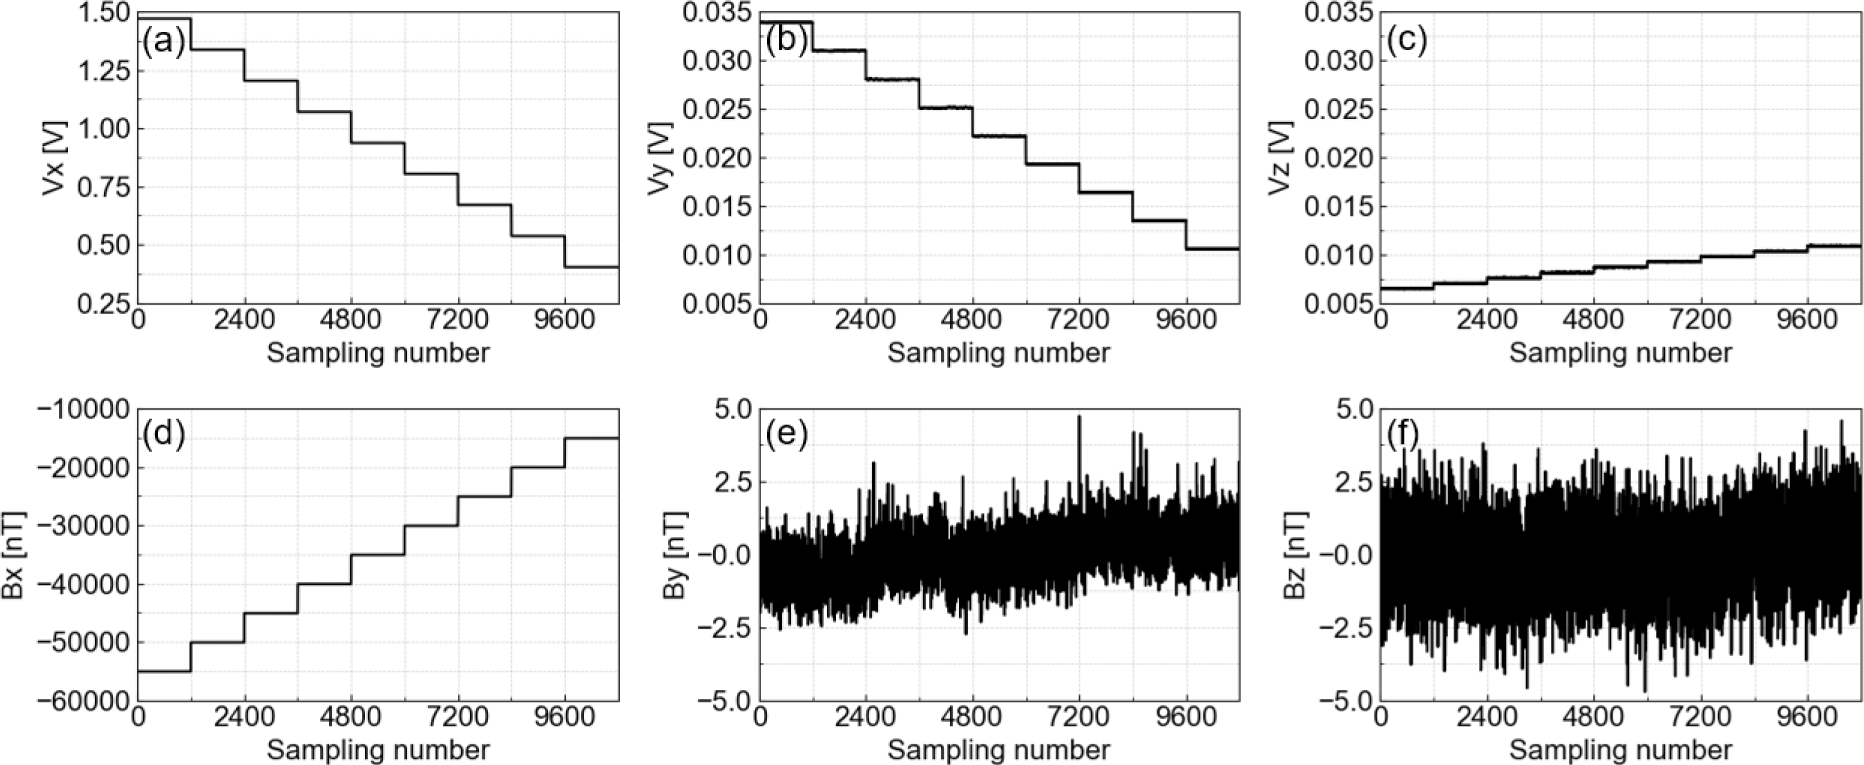
The FGM was aligned such that one of its axes was parallel to the Helmholtz coil’s magnetic field. Ideally, if the FGM’s axes were perfectly orthogonal, one axis would show a stepwise increase corresponding to the Helmholtz coil’s magnetic field strength, while the other two axes would remain constant. However, due to orthogonality errors, the other two axes also showed stepwise changes corresponding to the applied magnetic field as shown in Fig. 3, which indicates the presence of orthogonality errors that could cause measurement inaccuracies during the satellite operation.

The orthogonality correction for the FGM was performed using the method proposed by Trinh et al. (2019). This method involves placing the magnetometer inside a Helmholtz coil and applying specific magnetic fields along the x, y, and z axes without rotating the magnetometer. The magnetometer’s output is then used to calculate the correction matrix. However, our experimental setup has a limitation in that only the magnetic field along the z-axis of the Helmholtz coil can be actively controlled, while the magnetic field along the x- and y-axes can only be passively controlled. In this context, “actively controlled” refers to the ability of the system to input a desired magnetic field value along a specific axis (in this case, the z-axis) and generate it with precision. On the other hand, “passively controlled” refers to the state in which the x- and y-axes of the Helmholtz coil are limited to compensating for the external magnetic field rather than precisely generating specific magnetic field values. This limitation arises due to misalignment in the Helmholtz coil’s axes, restricting their role to auxiliary compensation. To overcome this limitation, a new approach was designed, as illustrated in Fig. 4. This approach is less sensitive to the alignment of the axes of the Helmholtz coil compared to conventional methods, making it less dependent on the precision of the Helmholtz coil system.
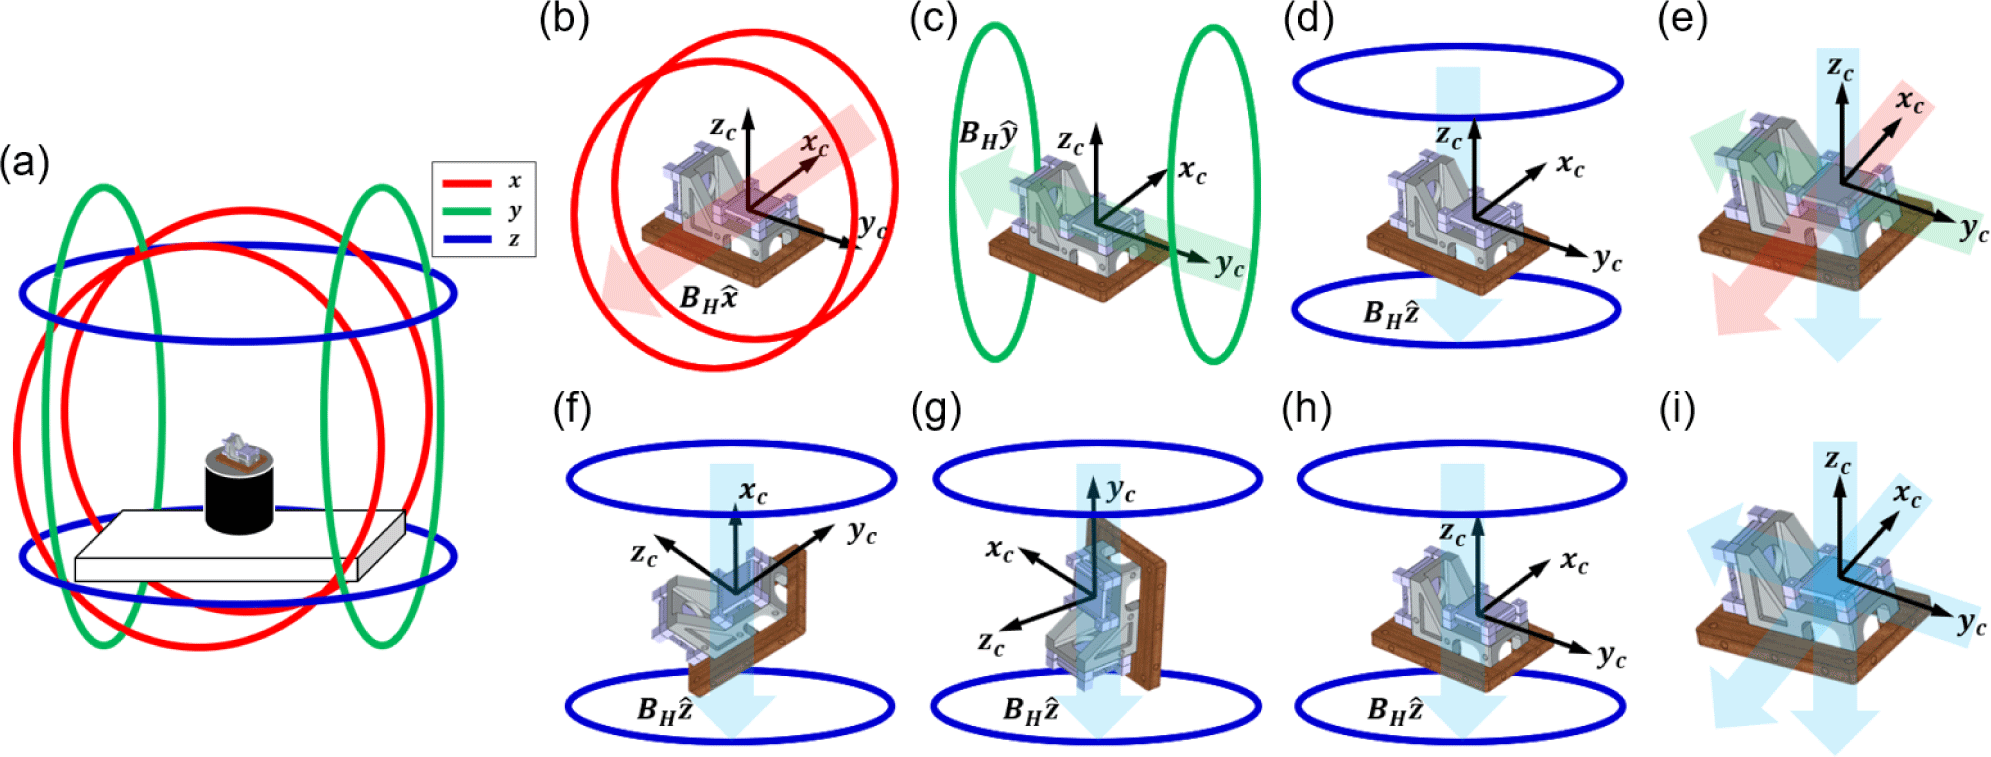
In this setup, applying magnetic fields along the x, y, and z axes using the Helmholtz coil is equivalent to applying a magnetic field along the z-axis and manually rotating the sensor by 90° between each measurement. This design is possible because the Helmholtz coil maintains a uniform magnetic field within a cubic region of ~10 cm edge length, and the use of the alignment cube and collimator ensures precise rotation.
The orthogonality correction of the FGM is equivalent to finding the coefficients in the following matrix equation:
where B is the magnetic field applied by the Helmholtz coil, V is the FGM’s output, and A is correction matrix. Correction matrix A is calculated from the experimental data and is used to correct the FGM’s output, removing orthogonality errors and providing more accurate magnetic field measurements.
When adjusting the equation to match the experimental setup, the modified correction matrix is as follows:
where Bxx, Byy, Bzz represent the applied magnetic fields in the x, y, and z directions, respectively, and Vix, Viy, Viz (i = 1,2,3) are the FGM’s output voltages for each corresponding rotations state. The correction matrix A, which accounts for the FGM’s orthogonality errors, is calculated as:
This matrix provides the angles between the FGM’s axes and the reference cube which are illustrated in Fig. 5. The cube’s axes xc, ŷc, ẑc are assumed orthogonal, serving as the reference coordinate system. The FGM’s axes xFGM, yFGM, zFGM, however, are not orthogonal due to structural errors, and thus do not coincide with the cube’s coordinates. The angles θxy, θxz, θyz representing the angles between the FGM’s axes should ideally be 90°. The angles αx, βx, γx represent the angles between xFGM, yFGM, zFGM and the cube’s axes xc, ŷc, ẑc, respectively. If the FGM’s axes coincide with the cube’s axes, the angles αx = βy = γz = 90°, and all other angles would be 90°.

The FGM coordinates xFGM, yFGM, zFGM can be expressed using the cube reference coordinates ̃c, ŷc, ẑc as follow:
Using these expressions, the output of the FGM can be represented as follows:
where Si = dV / dB (for i = x, y, z) represents the effective sensitivity. The sensor outputs for each axis are not identical because the effective cross-section of the coils corresponding to each axis differs. These differences can be checked at correction matrix, with the diagonal elements which represent the effective sensitivity for each axis. By the properties of direction cosines, cos2αi + cos2βi + cos2γi = 1. Using this, the effective sensitivity can be calculated as:
The inverse of the correction matrix A–1 is given by:
The angles in Fig. 5 can be calculated as follows:
The angles between the FGM axes θ can also be calculated using the cube reference coordinates ̃c, ŷc, ẑc:
In conclusion, the correction matrix can be used to adjust the three axes of the FGM, which are not orthogonal, so that they become orthogonal. The correction matrix calculates the angles between the FGM’s mechanical coordinate and the reference coordinate and corrects the sensor output accordingly. Thus, this process does not require aligning the FGM’s axes with the cube’s reference axes. In other words, the calculation of the correction matrix involves a mathematical process that transforms the output values of each axis into values corresponding to the reference coordinate system, irrespective of the alignment state between the mechanical coordinate system of the FGM and the reference coordinate system.
3. EXPERIMENTAL RESULTS
The correction matrix A was calculated using the data collected from the experiment. To exclude the effect of offsets, the value Bxx, Byy, Bzz used in the actual calculations were derived by taking the difference between measurements at two different magnetic field strengths within the range of 15,000 to 55,000 nT. The difference between the FGM’s output at 30,000 nT (the most stable range) and 25,000 nT represents a 5,000 nT magnetic field. Therefore, correction matrix can be rewritten as follows:
Using this method, we calculated the correction matrix A and the angles between the cube’s reference axes and the FGM’s axes (see Table 1). The correction matrix effectively corrected orthogonality errors in the output of each axis, as confirmed by the corrected data, which now matched the expected values for all axes.
Table 1 summarizes the correction matrices and inter-axis angles for the three FGMs (FGM Center, FGM -Y, FGM +Y). During the manufacturing process of the FGMs, some sensing axes had their winding directions reversed, but it does not affect the performance of the magnetometer. Instead of reworking the hardware, we decided to leave the FGM hardware as it is and make use of the matrix to recover the field values. This sign discrepancy was addressed during the calculation of the correction matrix. This is reflected in the negative values of the diagonal components and explains why the angles αx of FGM Center, αx of FGM -Y, and γz of FGM -Y approach 180°.
Using the calculated correction matrix, the FGM’s output in voltage can be converted into the magnetic field values in nT. Since offsets were not considered initially, the offsets must be calculated to correct the measurements to true magnetic field values. The offset was calculated as the difference between the applied magnetic field from the Helmholtz coil and the value obtained by multiplying the FGM’s voltage output by the correction matrix as following calculation.
The offset vector is computed as:
From this, the calculated offsets are (–115.9 nT, –52.1 nT, 314.2 nT) for FGM Center, (–114.4 nT, 16.9 nT, –243.3 nT) for FGM -Y, and (33.8 nT, 126.9 nT, 1.2 nT) for FGM +Y.
Fig. 6 shows the FGM output before and after correction when the x-axis of FGM -Y is aligned with the magnetic field direction of the Helmholtz coil. After applying the correction matrix to the data, it was observed that the stepwise variations, which were present in the axes not aligned with the Helmholtz coil’s magnetic field, disappeared. This indicates that the orthogonality correction effectively removes the errors. Furthermore, an evaluation of the sensor’s linearity across the measurement range confirmed that linearity was preserved after the correction. If the sensor output is not linear, the step heights of the data in Fig. 6(a)–(c) will appear inconsistent. As a result, residual values in a stepwise pattern caused by nonlinearity remain in the corrected data. In this case, a correction matrix needs to be calculated for each linear interval. Fortunately, AIMAG successfully maintains the linearity of the sensor output using a feedback circuit, so additional calculations are not required. The corrected data also closely matched the magnetic field applied by the Helmholtz coil, further validating the effectiveness of the orthogonality correction method.
Additionally, the correction matrix A can be decomposed into an orthogonal matrix Q and an upper triangular matrix R using QR decomposition (Anderson et al. 1992). The QR decomposition includes the Gram-Schmidt orthogonalization process to obtain the orthogonal matrix Q, where each column vector of Q represents the orthogonalized axes of the magnetometer. If the orthogonality correction is successful, these vectors should be orthogonal to each other.
The QR decomposition of the correction matrix was used as a tool to assess the accuracy of the correction results. The Q matrix was utilized to calculate the angles between the orthogonalized axes of the magnetometer. For FGM -Y, the Q and R matrices, and column vectors of Q were calculated as follows:
The diagonal components of the R matrix are similar to scale factors that convert the sensor output in volts along a single axis to magnetic field units. However, in the case of a tri-axis sensor, the angles between the axes also affect the conversion process, meaning that these diagonal components do not directly correspond to scale factors.
The corrected inter-axis angles were calculated as:
Through this process, the initially measured angles θxy, θxz, θyz = (88.83°, 90.07°, 89.75°) presented in Table 1 were corrected to orthogonal angles.
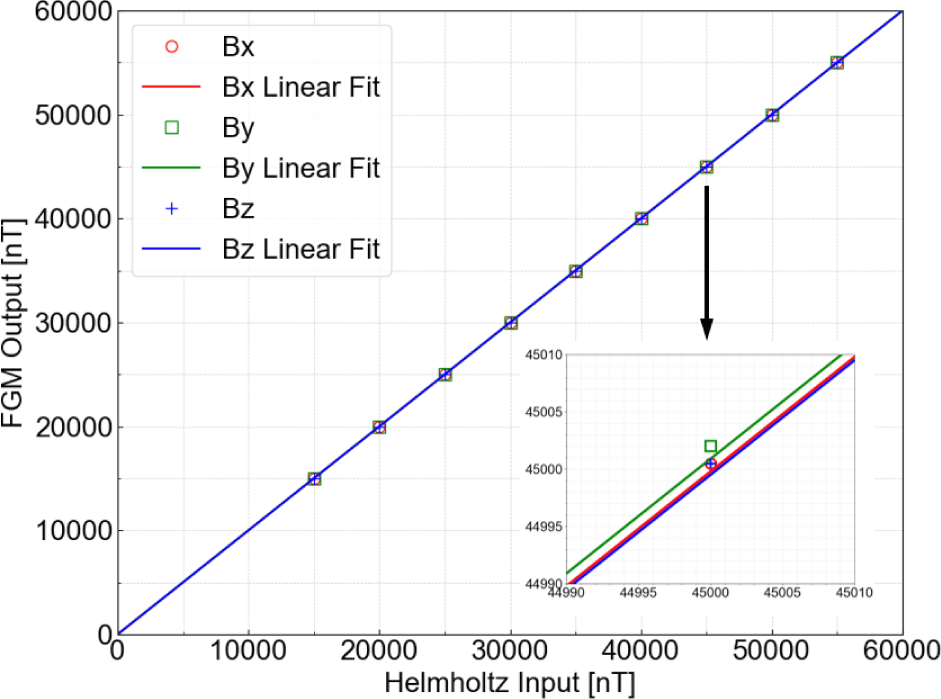
After the orthogonality correction and calibration process, we evaluated the linearity and noise levels of FGMs. Table 2 presents a summary of the linearity and noise for each axis of the FGMs. The data used to calculate the linearity were obtained from the orthogonality correction process described in Section 2.2. Linearity represents how consistently the sensor output responds to changes in the applied magnetic field and is calculated as the difference between the FGM output and the Helmholtz input, normalized by the FGM’s dynamic range, then multiplied by 100 to express the result as a percentage. The AIMAG utilized the pickup coil, also known as sensing coil as a feedback coil, achieved through a feedback loop system in the circuit. The output signal of the pickup coil is fed into an integrator. The output of the integrator is input to the analog to digital converter (ADC) while simultaneously being used as a feedback signal for the pickup coil to nullify the external magnetic field. Through feedback system, the sensor output provides a stable and linear response even across a wide measuring range with high output value.
Fig. 7 shows the linearity of the FGM Center along the x, y, and z axes, with linearity value of 0.00165%, 0.00215%, and 0.00247%, respectively. As shown in Table 2, all linearities are below 0.01%, which indicates that the output remains highly proportional to the magnetic field being measured across the full operational range. Additionally, these values are comparable to those of the FGM used on the low orbit pearl satellites for EEJ studies (Zhu et al. 2021). The minimal differences in linearity across the axes indicate consistent performance, with no significant axis-related variations in the characteristics of the FGMs.
In addition, we evaluated the noise levels of the FGMs. For noise measurements, we utilized a Helmholtz coil in conjunction with a magnetic shielding can (Fig. 8). The sensor was placed inside the shielding can, positioned at the center of the Helmholtz coil. The external magnetic field was nulled using the Helmholtz coil, and the sensor output was recorded over a 20-minute period. Noise was quantified as the power spectral density (PSD) at 1 Hz, calculated using a Welch’s method (Welch 1967) with a flat-top window. The window size was set to encompass 84.1% of the data, in line with the methodologies described by Miles et al. (2017) and Heinzel et al. (2002).
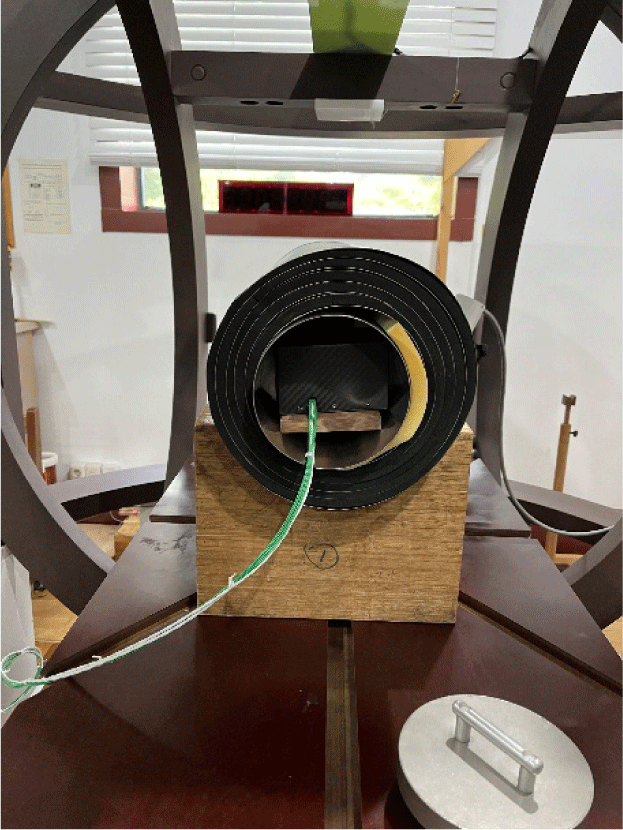
Fig. 9 illustrates the PSD of each sensor axis as a function of frequency. It is evident that the PSD values of the FGM Center and FGM -Y are higher compared to FGM +Y, with notable harmonics observed at 1, 2, and 3 Hz. This non-uniform noise is believed to be caused by digital processing interference from the microcontroller unit (MCU). Also, the noise level of the FGM +Y are higher than other FGMs. The high noise level of the FGM +Y is presumed to be due to the signal processing circuit for the axis being located closest to the MCU’s digital circuit on the printed circuit board (PCB). Electromagnetic interference from the digital circuit is likely causing the FGM +Y circuit to experience higher noise levels. To mitigate this noise in future data collections, adjustments in time resolution could be beneficial. Setting a longer time resolution (low sampling rate) results in an averaging effect between samples, which tends to reduce noise caused by data fluctuations.

Otherwise, even if only one sensor performs optimally, noise reduction in the other sensors can be achieved through post-processing techniques or by modifying the sampling rate, thus minimizing any potential adverse impact on mission objectives.
4. CONCLUSIONS AND FUTURE WORK
In this study, we utilized an orthogonality correction method for a satellite-mounted FGM using Helmholtz coils and a rotational setup. A distinctive feature of this method is that calibration is performed by actively controlling the magnetic field along one axis of the Helmholtz coil, while the other two axes are used just to compensate the external magnetic field. By utilizing only a single axis, this approach is less sensitive from the influence of the orthogonality of the Helmholtz coil system on the calibration process, while maintaining the reliability of the calibration results. The validity of this method was verified through experiments, demonstrating its effectiveness in significantly reducing orthogonality errors in the FGM. This method can be applied to any vector magnetometer that measures three axes, not just FGM (Chiang et al. 2015; Luong et al. 2017). In future research, we plan to further analyze and correct any residual errors after the initial orthogonality correction to achieve even more precise calibration. The correction matrix calculated in this study provides valuable insight into the characteristics of the manufactured FGM. This matrix will be used during the in-flight calibration process of the CAS500-3 satellite, in which the FGM’s measurements will be compared to the international geomagnetic reference field (IGRF) model or to the magnetic field measurements from nearby satellites to ensure accurate in-flight magnetic field measurements.
