1. INTRODUCTION
Space radiation dosimetry is one of the most significant challenges in radiation protection due to the complex radiation fields encountered in low Earth orbit (LEO) and interplanetary space. As human exploration shifts from LEO missions to long-duration interplanetary missions, addressing radiation protection becomes a critical technological issue that must be resolved. In outer space, humans are continuously exposed to natural ionizing radiation, which can cause various harmful biological effects. Therefore, it is crucial to quantitatively assess exposure levels to estimate radiation hazards during manned space missions (Semkova et al. 2014; Wilson et al. 2002).
Low Earth orbit space radiation dosimeter (LEO-DOS) is a science payload of the next generation small satellite-2 (NEXTSat-2), which was launched successfully on May 25, 2023. The NEXTSat-2 (Fig. 1) orbits the Earth every 100 minutes, in an orbit with an inclination of 97.8° and an altitude of about 550 km (Jang et al. 2022). LEO-DOS has two types of instruments, a particle dosimeter (PD) and a neutron spectrometer (NS). The PD measures the effects of ionizing energy loss in matter due to penetrating solar energetic protons (SEP) and galactic cosmic rays (GCR), specifically in silicon solid-state detectors and after interactions with tissue-equivalent plastic (TEP), a synthetic analog of human tissue. The PD investigation quantifies the linear energy transfer (LET) spectrum in materials directly through measurements within the space radiation environment, particularly focusing on interactions of ions with energies above 40 MeV. The NS instrument is based on a stilbene organic scintillator (C14H12), enabling it to function as a neutron dosimeter for fast neutrons in the energy range of 1.6 to 8 MeV.
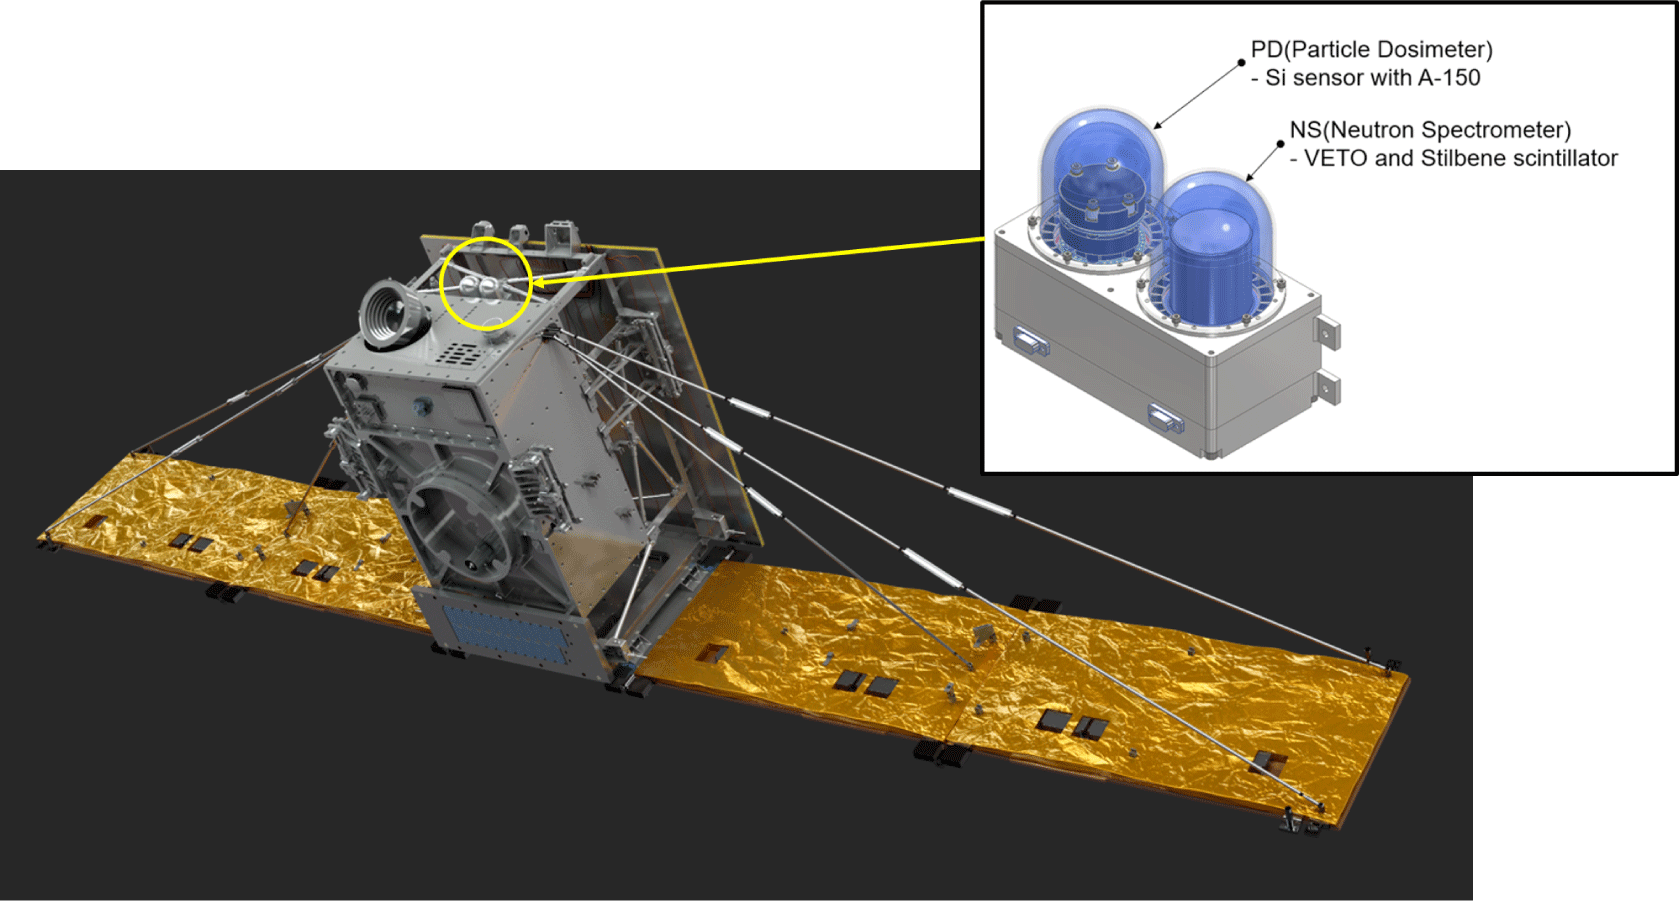
LEO-DOS objectives are
-
To create a global map of absorbed dose and dose equivalent of space radiation from charged particles and neutrons.
-
To study changes in space radiation and the impact of the space environment during the increasing phase of the solar activity cycle.
-
To analyze the space radiation risk to astronauts, considering neutron weighting factor in near-Earth space.
-
To assess the effect of space radiation on electronic components due to neutrons in near-Earth space.
We conducted a radiation dose analysis based on the initial results of LEO-DOS, measured from June 2023 to September 2023. To validate the observations of LEO-DOS, we categorized the data into four source categories as described in the reference paper (Dachev et al. 2017): (i) GCR particles; (ii) the South Atlantic Anomaly region (SAA) of the inner radiation belt (IRB); (iii) relativistic electrons and/or bremsstrahlung in the outer radiation belt (ORB); and (iv) solar energetic particle (SEP) events. In this paper, we present the design, calibration, and early flight data analysis of the LEO-DOS instrument. Detailed descriptions of the instrument configuration and design are provided in Section 2. Section 3 covers the calibration of the instrument, followed by the radiation source separation process from the measurements in Section 4. Finally, Sections 5 and 6 provide this paper’s analysis, discussion, and conclusions..
2. LOW EARTH ORBIT SPACE RADIATION DOSIMETER (LEO-DOS) INSTRUMENT DESCRIPTION
LEO-DOS has a compact, low-mass package (1.7 kg) and a total dimension of 190 × 85 × 144 mm3. The PD is designed to cover a range of 0.3–700 keV/μm LET spectra of charged particles in LEO. On the other hand, the NS consists of a combination of a stilbene organic scintillator and a plastic scintillator for VETO in a compact package that covers a range of 2–8 MeV of fast neutron energy range.
The LEO-DOS PD and NS are mounted on the satellite, with potential shielding from the electronic box, satellite body, and solar panel. However, GCR, the main dose contributor to the PD, has very high energy (several GeVs) and can penetrate most satellite materials. SEP and SAA protons also have sufficient energy so the aluminum body shields only a small fraction. Additionally, the mean chord length value used in dose calculations is the same whether the field of view (FOV) solid angle is 4π steradians or 2π steradians (refer to Eq. (2)). Radiation from behind is not effectively shielded due to the satellite structure. For NS, fast neutrons have a low cross-section for aluminum, allowing most to pass through the satellite body. Consequently, the FOVs of PD and NS are considered omni-directional.
Table 1 summarizes the main specification of the LEO-DOS instrument, including physical resources, key design values, and measurement performance metrics. These properties of the as-delivered flight model represent the optimal values resulting from science and engineering trade studies completed throughout the instrument development.
The PD of LEO-DOS employs a silicon photodiode particle sensor, which is situated between two 10 mm layers of A-150 TEP, as illustrated in Fig. 2. This configuration, with one layer above and one below the sensor, allows for the assessment of the effective dose to the human body in accordance with ICRP Publication 103 (Charles, 2008). The particle sensor for the PD is a n-type silicon photodiode sensor with an effective area of 20 × 20 mm and 650 ± 30 μm thickness, developed for the application to the cosmic ray energetic and mass for the international space station experiment for the International Space Station (ISS) in Korea. Its properties as a particle detector are investigated in reference (Hyun et al. 2015).
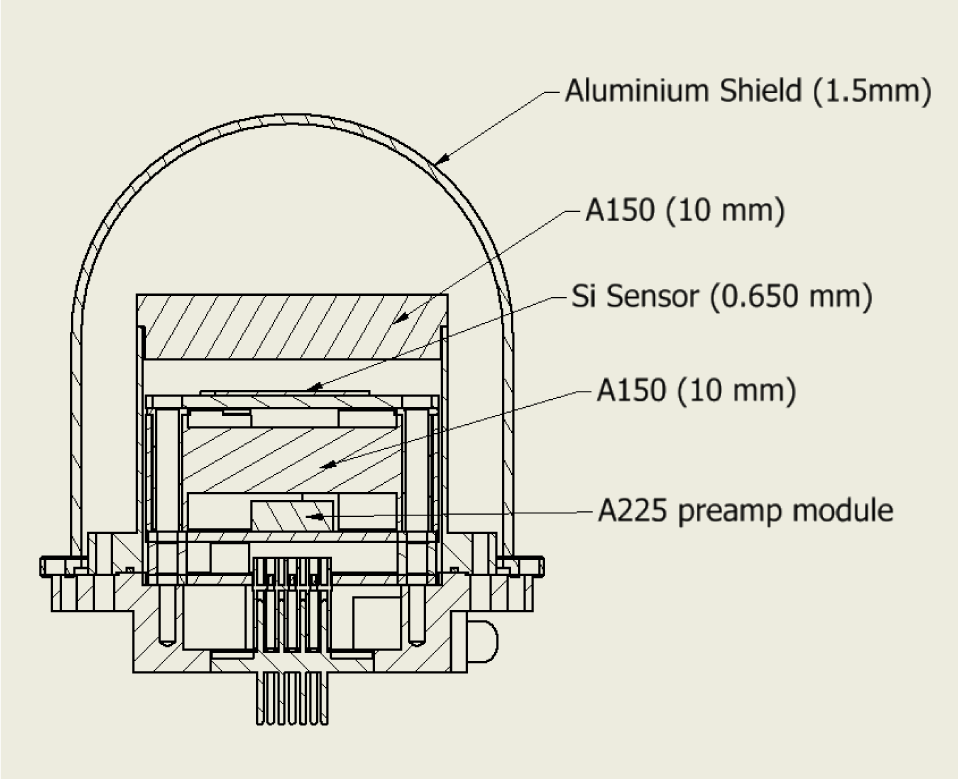
The absorbed dose for charged particles with a silicon detector is calculated by dividing the sum of the deposited energy in the silicon sensor by the mass of the silicon sensor. The calculation formula for the absorbed dose in silicon can be expressed as follows:
where Ni is the count of the i-th channel, εi is the energy of the i-th channel, and m is the mass of the silicon sensor.
DSi is converted to DH20 by converting LET in silicon (LSi) to LET in water (LH20) through the Benton equation (Benton et al. 2010) as follows:
where l̅ is a mean chord length of the PD of 919 μm obtained by dividing the thickness of the silicon sensor of PD of 650 μm by cos (45°) considering the isotropic incidence of the charged particles in space.
The biological effectiveness factor, also known as the quality factor (Q(L)) can be expressed as a function of LET (L) according to ICRP publication 60 as follows (ICRP 1991):
The dose equivalent can be expressed as the product of absorbed dose and mean quality factor (Qmean) as shown in the following equation:
Fig. 3 presents a schematic view of the NS configuration. A 1.5” × 1.5” stilbene (C14H12) organic scintillator was adopted as a sensor of a fast NS. To mitigate the influence of charged particles in near-Earth space, a hollow plastic sensor (EJ-200, ELJEN Technology, Sweetwater, TX, USA) coated with EJ-510 reflective paint is installed around the stilbene sensor, serving as a VETO sensor to filter out these particles. Each scintillator sensor is optically coupled with an array of SiPMs (J-series 60035, SensL, now ON Semiconductor, Cork, Ireland). The stilbene sensor is coupled with a 4 × 4 SiPM array, while the VETO sensor is coupled with a 24-SiPM array.
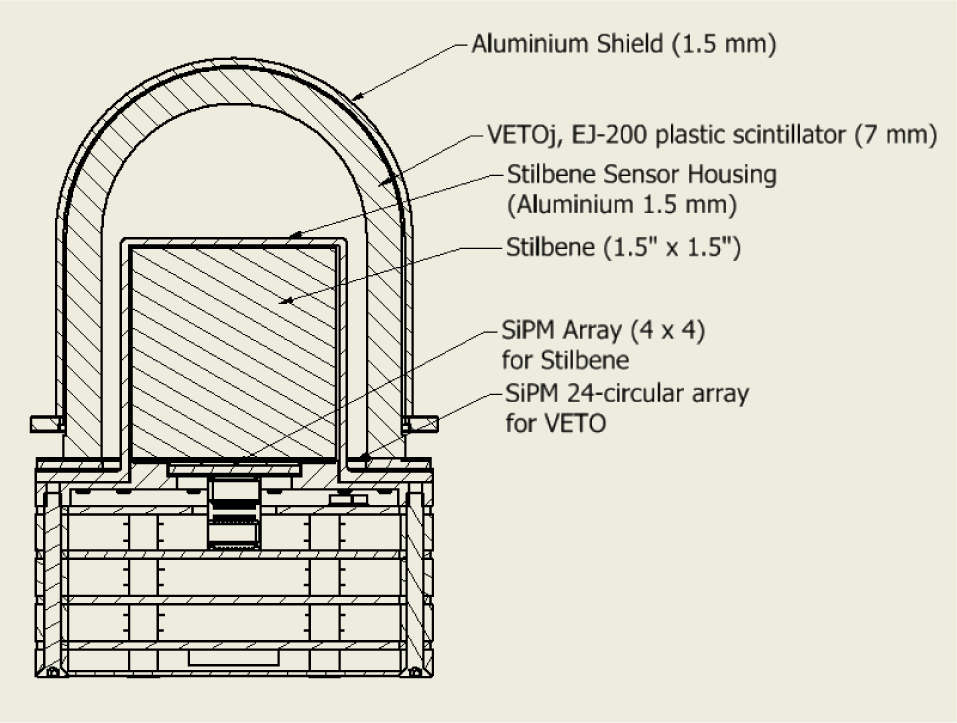
The advantage of using stilbene for a fast neutron dosimeter is that it does not require an unfolding algorithm to obtain dosimetric parameters such as the absorbed dose (D) and equivalent dose (H) (Miller et al. 2020). Additionally, since the stilbene sensor has tissue-equivalent characteristics, the impact of neutrons in LEO on the human body can be evaluated through the stilbene absorbed dose.
The absorbed dose (Dstilbene) in stilbene is calculated by dividing the sum of the recoil proton energy in the stilbene crystal by the mass of the stilbene sensor. The calculation formula for the absorbed dose in stilbene in the energy range from 2 to 8 MeV neutrons can be expressed as follows:
where Ni is the count of the i-th channel, εp,i is the recoil proton energy of the i-th channel, and m is the mass of the stilbene crystal.
Since the stilbene scintillator in NS has a quenching effect, the measured electron equivalent energy (εee) in stilbene was converted to proton energy (εp) using the light output function to obtain the recoil proton energy (Hansen et al. 2002).
The equivalent dose (Hstilbene) for neutrons in low Earth orbit, measured by the stilbene sensor, can be obtained by multiplying the stilbene absorbed dose (Dstilbene) by the radiation weighting factor (wR) according to the energy of the neutron, as suggested in ICRP 60 (ICRP 1991). In ICRP 60, the radiation weighting factor is 10 for neutrons in the range of 2–20 MeV. The equivalent dose in the stilbene in the energy range from 2 to 8 MeV neutrons is as follows:
The circuit configuration of the LEO-DOS system comprises a PD, NS, and a Space Craft Interface (SCIF) electronics, as illustrated in Fig. 4. All components used in the LEO-DOS readout electronics are commercial off-the-shelf parts, screened to withstand a total ionizing dose level of 30 krad.
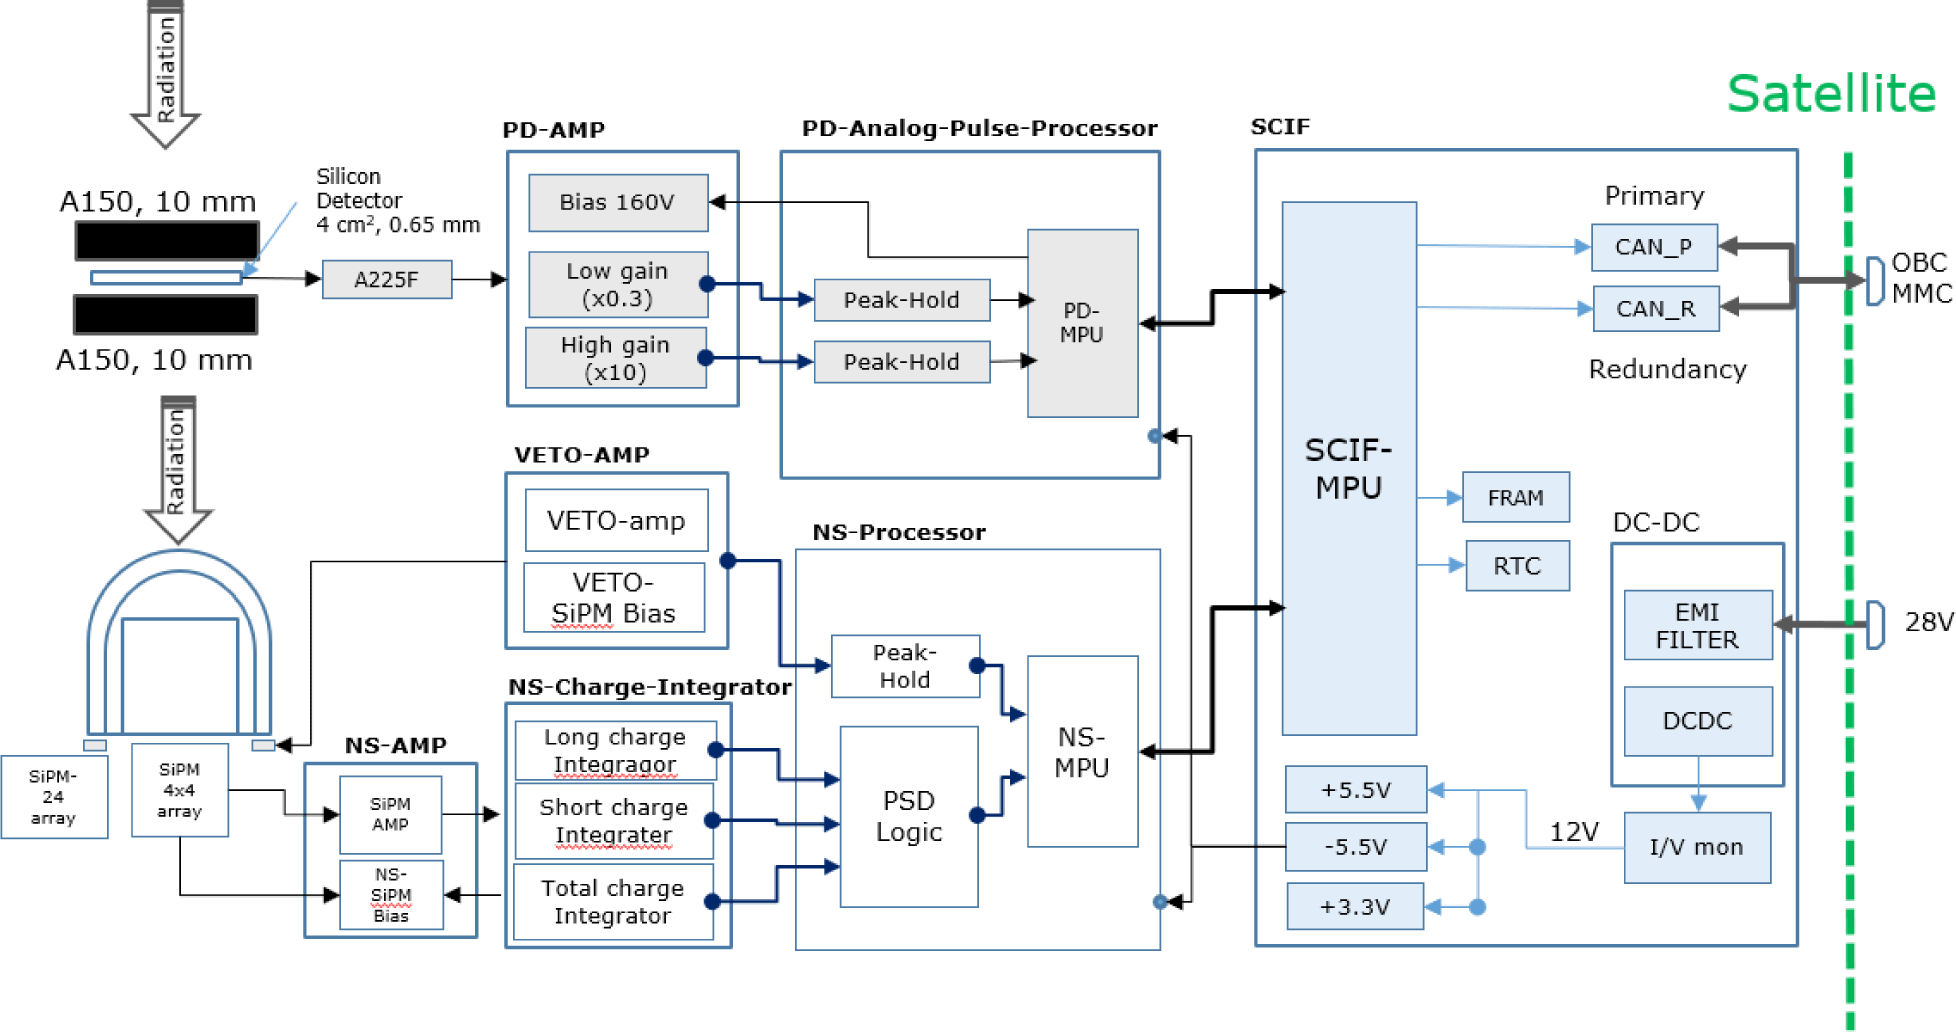
The electronics developed for the PD signal processing consist of silicon sensor preamplifier and PD-amp (amplifer), a analog pulse processor (PD-APP) as shown in Fig. 4. The silicon sensor, positioned between two 10 mm thick A150 TEP plates, is biased at 160 V. The signal from the silicon sensor is amplified using the AMPTEK A225 (https://www.amptek.com), a preamplifier and shaping amplifier with a sensitivity of 5.2 V/pC and a peaking time of 2.4 μs. To achieve a wide range of LET spectra (0.3–700 keV/μm), we utilized two gain modes: high-gain and low-gain, with a gain ratio of 30:1. In the PD-analog pulse processor part, the signals from the high-gain and low-gain amplifiers are peak-held and digitized by a 12-bit analog-to-digital converter. The conversion time is set to 40 μs to achieve a fixed dead time. After being reduced to 9-bit (512 channels) data, the digitized data are stored as histograms using the PD-MPU (MSP432P401R, https://www.ti.com), resulting in a spectrum with 512 ADC channels.
A cylindrical 1.5” × 1.5” Stilbene (C14H12) scintillator was optically coupled with a 4 × 4 Silicon photomultipliers (SiPM) array. SiPMs are a solid-state alternative to PMTs for detecting faint scintillation light. Individual SiPMs consist of arrays containing thousands of avalanche photodiode pixels operating in Geiger mode. Although SiPM parts are relatively small (e.g., the SensL J series is available in 6 × 6 mm square formats), arrays of SiPMs with uniform output can cover larger areas.
The bias voltage 27.5 V for the SiPM was supplied from the C14156 (https://www.hamamatsu.com), bias power supply with built-in temperature compensation function. The outputs of the 16 individual SiPMs were passively summed and amplified through an OPA656N(https://www.ti.com) trans-impedance amplifier. The output signals were connected to a pulse shaping discrimination (PSD) circuit, enabling the separation of gamma signals and neutron signals. For the PSD function, the total charge integrator (T), short charge integrator (S), and long charge integrator (L) are implemented in the NS-Charge-Integrator circuits. To quantitatively distinguish neutron and gamma-ray interactions, we define a PSD parameter as the charge ratio:
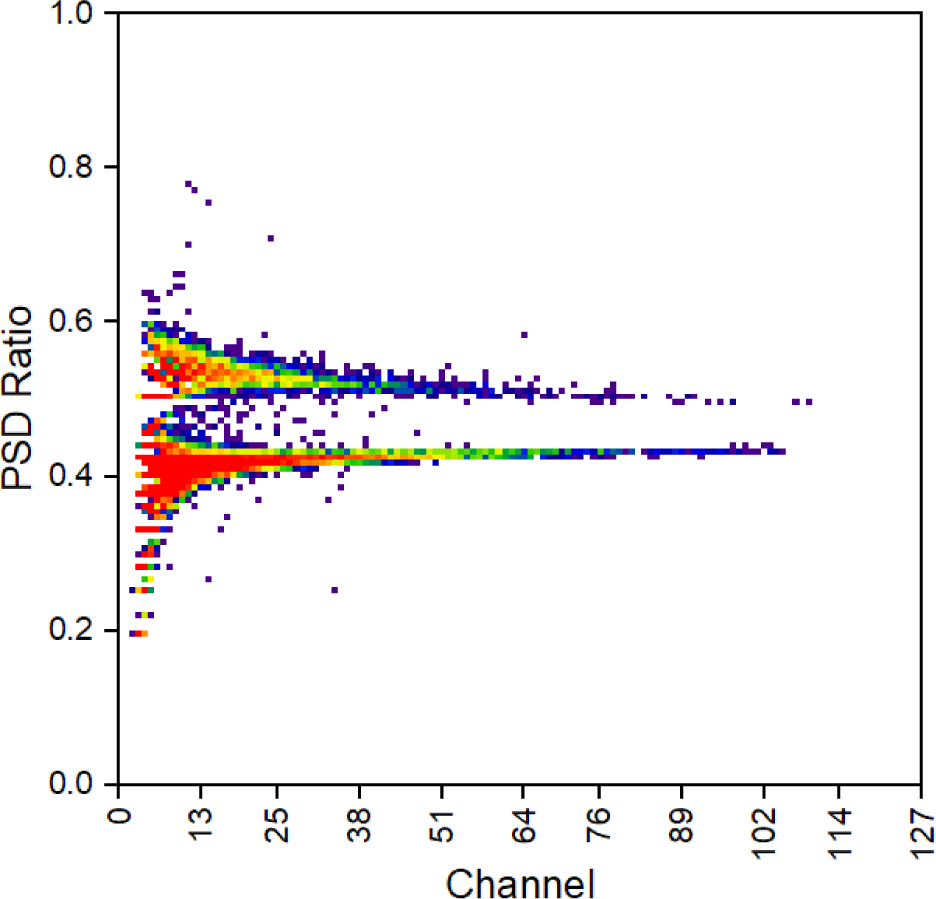
The PSD image construction is conducted in the NS-Processor circuit, with the PSD ratio plotted against the total energy, represented on the x-axis. In the PSD image shown in Fig. 5, two distinct bands emerge for scintillators that respond differently to neutrons and gammas. The upper band corresponds to the neutron response, while the lower band corresponds to the gamma response. Often, a figure of merit (FOM) is defined as the distance between the two bands in a particular energy range, divided by the sum of the full-widths at half-maximum (FWHM) of the PSD ratio bands. A high FOM is usually interpreted as a good indicator of how well a certain scintillator device can distinguish between neutrons and gammas. The FOM is then computed by dividing the difference between the centroids by the sum of their FWHM:
where Xn and Xγ are the peaks of the neutron and gamma-ray bands, respectively, and FWHMn and FWHMγ are the full widths at half maximum of the two distributions.
In the NS-AMP circuit, a trigger signal is generated using the level discriminator of the SiPM output signal. The trigger signal creates integration time windows of 10, 0.2, and 0.5 μs for total integration, short integration (S), and long integration (L), respectively. The output of three integrator circuits were digitized using the 12-bit ADC embedded in the MSP432P401R, which serves as the NS-MPU. The PSD image with 128 × 128 pixel was constructed and stored in the MPU’s SRAM. A good FOM of more than 4.2 was obtained with our circuit. The VETO scintillator was also optically coupled with a 24 SiPM array. In the VETO-AMP, the summed SiPM array output is shaped and amplified, and the VETO spectrum is then obtained in the NS-MPU. Meanwhile, before processing the PSD logic in the microprocessor, the presence or absence of a VETO signal is determined. If the VETO signal exceeds the set VETO threshold value, it is considered a charged particle; if it is lower, it is classified as a neutron signal. Due to the difficulty in experimentally determining the VETO threshold value for distinguishing between neutrons and charged particles, it was set to 0.5 MeV based on simulation results (see Section 3).
In the LEO-DOS Space Craft InterFace (SCIF), 28 V is supplied from the satellite and converted to 12 V DC using a DC-DC converter. This is then used to generate +3.3 V, +5.5 V, and –5.5 V DC power with good regulation quality. The SCIF-MCU, which utilizes the MSP432P401Y microprocessor, includes radiation-hardened MRAM (MR25H256ACDF) for data storage, Flash ROM (MT29F2G01ABAGSDSF-ITG) for storing system control parameters, and a watchdog (TPS3828-33DBV). The PD and NS units of the LEO-DOS are interfaced via UART (RS-232) serial communication with SCIF board. LEO-DOS data packages are transmitted to the satellite on-board computer through CAN communication according to the operation sequence. To monitor the health of the LEO-DOS, it is equipped with three temperature sensors each for the PD and NS, an additional temperature sensor for the LEO-DOS body.
The scientific data products of LEO-DOS are categorized into three groups: primary science data, secondary science data, and housekeeping data. The primary science data products are measured at 120-second intervals and include the following: low-gain spectrum (512 channels, 2 bytes), high-gain spectrum (512 channels, 2 bytes) for PD, neutron spectrum (512 channels, 2 bytes), gamma spectrum (512 channels, 2 bytes), VETO spectrum (512 channels, 2 bytes) and PSD images (78 × 128 pixels, 3 bytes) for NS. The secondary science data products of LEO-DOS, when combined with satellite attitude information to calculate the dose, are provided as the following dataset: UT date and time, altitude (km), longitude (deg), latitude (deg), L-value, PD-D/F ratio (nGy cm–2 particle–1), PD-Flux (cm2 s–1),PD-absorbed dose rate (DSi, μGy h–1), PD-absorbed dose rate in water (DH2O, μGy h–1), PD-Q value, PD-dose equivalent rate in water (HH2O, μSv h–1), PD-temperature, NS-absorbed dose rate (Dstilbene, μGy h–1), NS-equivalent dose rate (Hstilbene, μSv h–1), and NS-temperature. Housekeeping data are measured at 3-sec intervals and, when combined with satellite information, provide the following details: UT date and time, altitude (km), longitude (deg), latitude (deg), SCIF temperature, SCIF power voltage and current, count rate (cps) of PD, count rate (cps) of NS, silicon sensor bias voltage, SiPM bias voltage and current monitoring for NS and VETO.
3. INSTRUMENT CALIBRATION
For each instrument PD and NS, the relationship between the energy deposited in the detector and the digitized height of the shaped pulse in terms of the ADC value is derived considering various radioisotopes of well-known energies in the laboratory.
The LET spectrum of PD was calibrated using a 137Cs gamma source, a 90Sr beta source and a 241Am alpha source. In order to determine the dose calibration factors of PD should be obtained for both low-LET and high-LET regions. Dose calibration is conducted using the 137Cs gamma source in KORASOL (Seoul, Korea), radiation calibration company in Korea and by using the MCNP simulation. It was confirmed that the LET spectrum and the absorbed dose rate of the 137Cs gamma source obtained through the Monte Carlo simulation using MCNP version 6.2 (Werner et al. 2017) and measurement at KORASOL were very similar. The detailed calibration results were reported in the reference (Youn et al. 2023). The calibration results of the PD are presented in Table 2.
For the Stilbene and VETO sensors of LEO-DOS NS, the energy calibration was carried out using three gamma peaks: the 662 keV gamma peak from a 137Cs source and the 511 and 1,274.5 keV gamma peaks from a 22Na source. A good FOMstilbene value of 4.3 for the PSD of the NS was confirmed using a 252Cf radioactive source. The VETO threshold to discriminate neutrons and charged particles was determined through the Monte Carlo simulation using MCNP. The LEO neutron and GCR proton responses of the EJ-200 plastic scintillator, which constitutes the VETO sensor, were confirmed through the simulation (ANSI 2004; Sato et al. 2006). The VETO threshold value of 0.5 MeV, which can accept 91% of neutrons and reject 98% of protons in the region below 0.5 MeV, was determined. The operating temperature range of the NS was confirmed to be 5°C to 30°C using a thermal/vacuum chamber at KASI. The calibration results of the NS are presented in Table 3.
4. INITIAL OBSERVATION RESULTS
LEO-DOS aboard NEXTSAT-2 was launched on May 25, 2023, at 6:24 PM. The launch and early orbit phase (LEOP) for LEO-DOS was successfully conducted from June 8 to June 15, and normal observations have been ongoing since June 22. During the LEOP period, NEXTSat-2 maintained a stable altitude and temperature, ensuring the proper operation of LEO-DOS. Throughout the day, the temperature of the LEO-DOS increased from 15°C at initial power-on to 20°C after approximately 4 hours, and then stabilized between 20°C and 30°C, depending on the attitude of NEXTSat-2.
Fig. 6 illustrates the daily variation in the dose measured by LEO-DOS on June 25, 2023, during the LEOP period. The presented data, measured at 120-second intervals, are plotted against UT. The average altitude of the satellite was 556 ± 9.29 km over 15 orbits. It shows 9 passes through the SAA regions, 30 passes through the high-latitude GCR regions of both hemispheres, 30 passes through the geomagnetic equator. The SAA pass time was approximately 9 minutes, and the GCR region pass time was around 20 minutes.
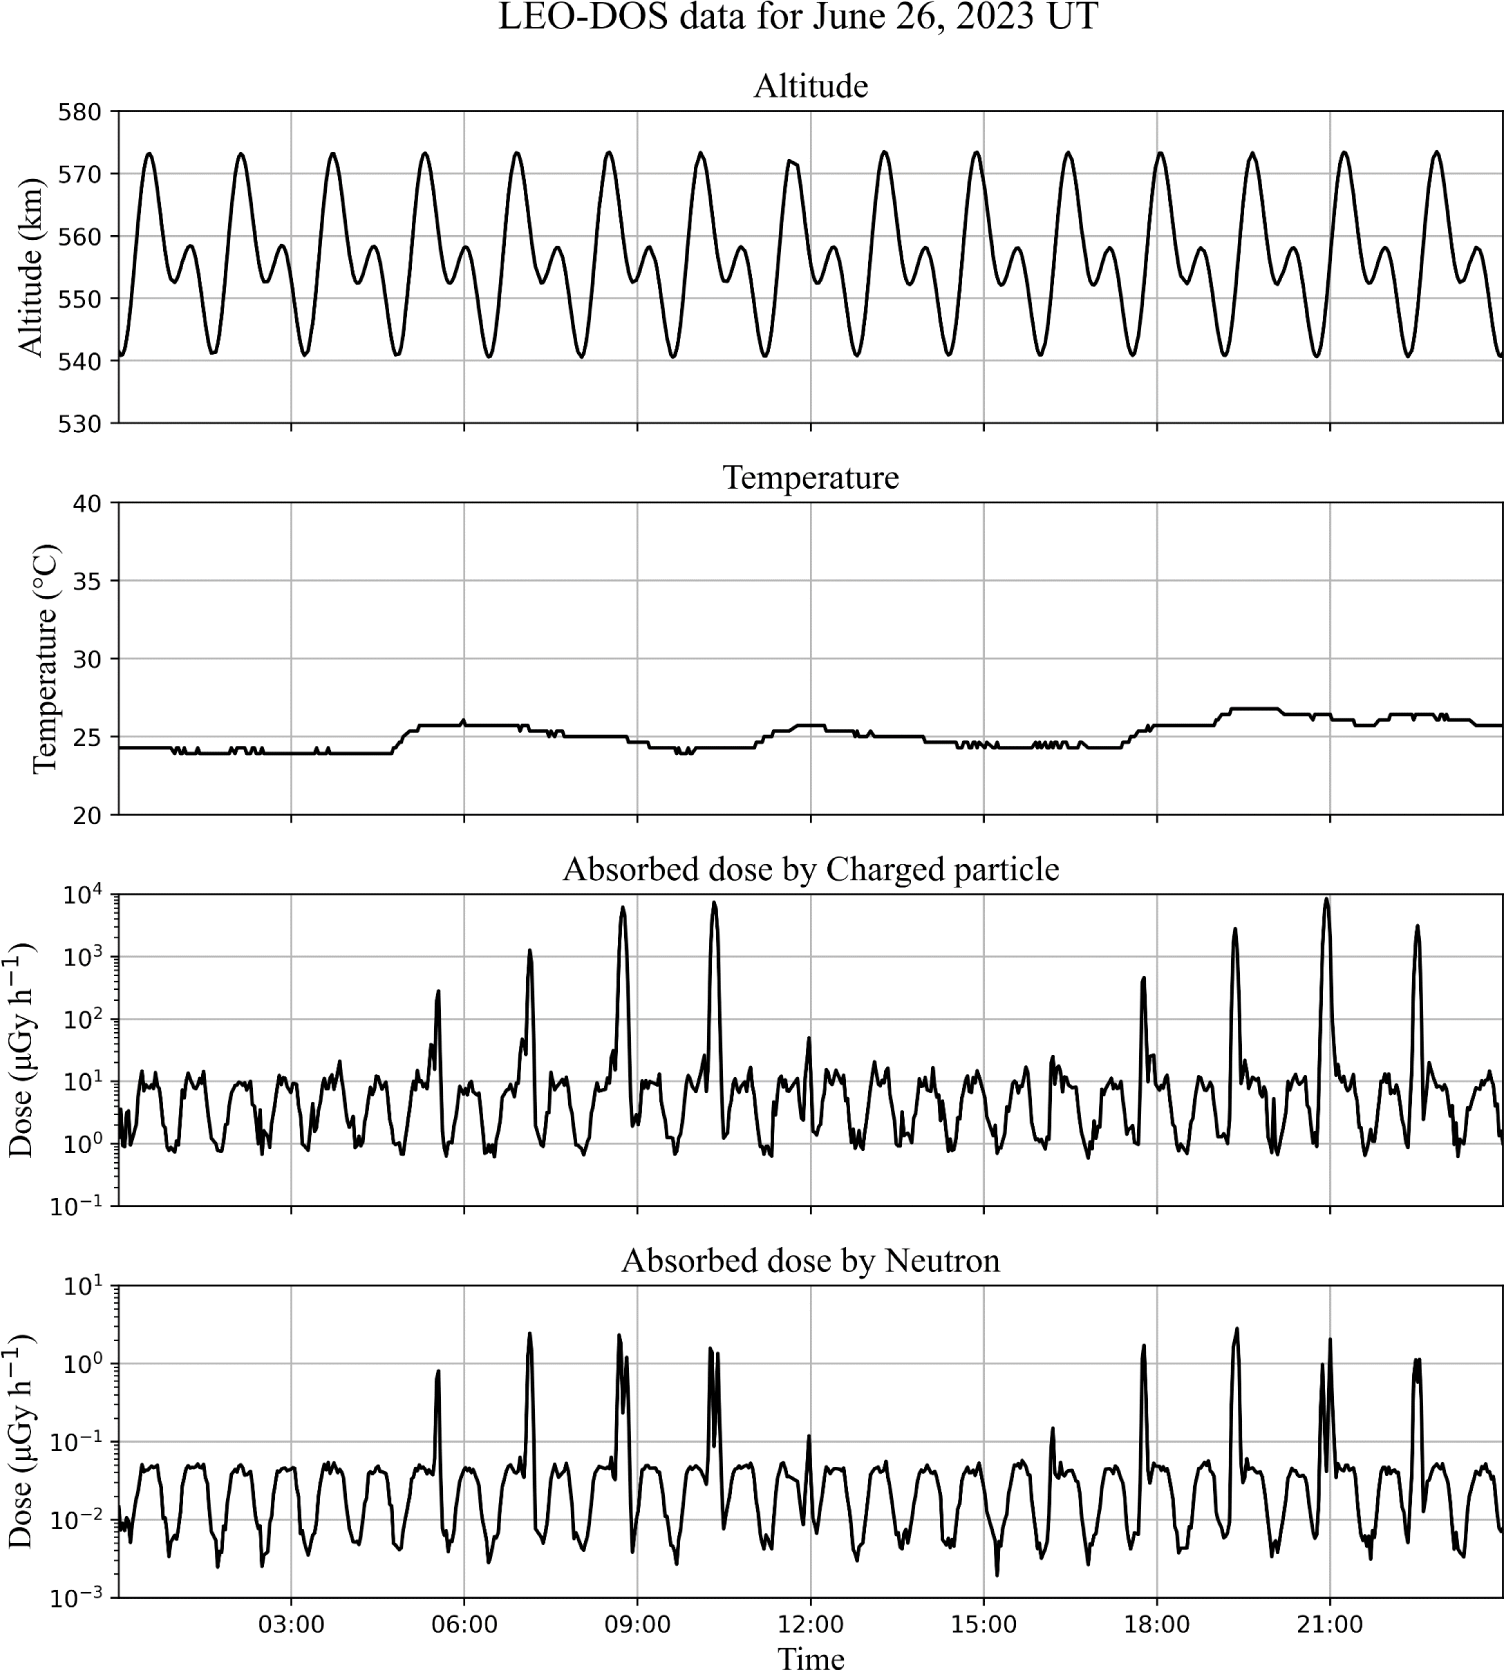
The SAA dose rates reached the highest value of 8,445 μGy h–1 for PD and 2.8 μGy h–1. The GCR dose rates varied from 0.6 to 15 μGy h–1 for PD and from 0.002 to 0.04 μGy h–1 for NS. The daily average GCR dose rates were 4.98 μGy h–1 for PD, 0.02 μGy h–1 for NS. This variation in dose according to the orbit showed reasonable agreement with the dose variation measured on the ISS (as shown in Fig. 4 of Dachev et al. 2015), confirming that the observations are consistent and normal.
The geographical distribution of the dose rate for charged particles and neutrons, measured by the LEO-DOS, is shown in the two panels of Fig. 7, where horizontal axis is the longitude, vertical axis is the latitude, and the dose rate intensity is color-coded. Measurements for the three-month period from June 2023 to September 2023 are plotted. In the case of PD, the maximal dose rates are recorded in the region of the SAA from the trapped protons. In the case of NS, most observations in the SAA region were vetoed due to the influence of strongly trapped charged particles, causing the SAA region to appear empty. Occasionally, when a SEP event occurred, traces of SEP were observed along the satellite’s trajectory in the ORB region.
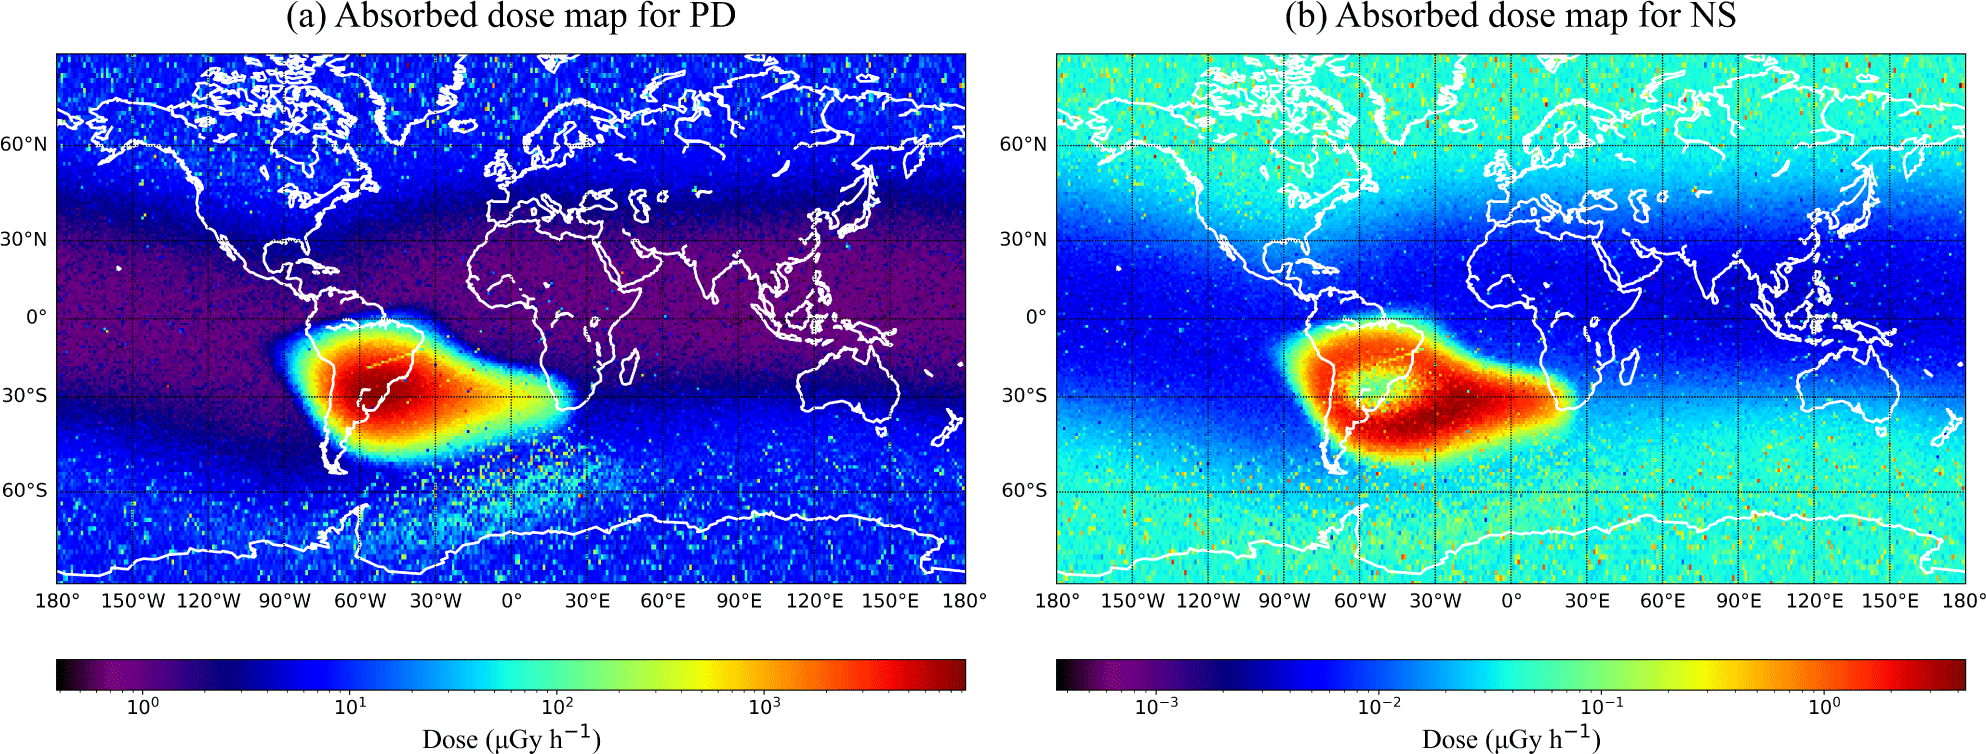
We can now create a detailed global radiation map using LEO-DOS for radiation sources such as GCR, IRB, ORB, and SEP in LEO, including dosimetric parameters such as absorbed dose and equivalent dose for charged particles and neutrons, following the source selection process described in Section 4.3.
The typical radiation sources in the LEO are GCR coming from beyond the solar system, trapped protons in the SAA region of the IRB, trapped electrons from the ORB, and SEP. In this section, we treat the source selection method according to the data selection procedure established by Dachev (Dachev 2009; Dachev et al. 2015).
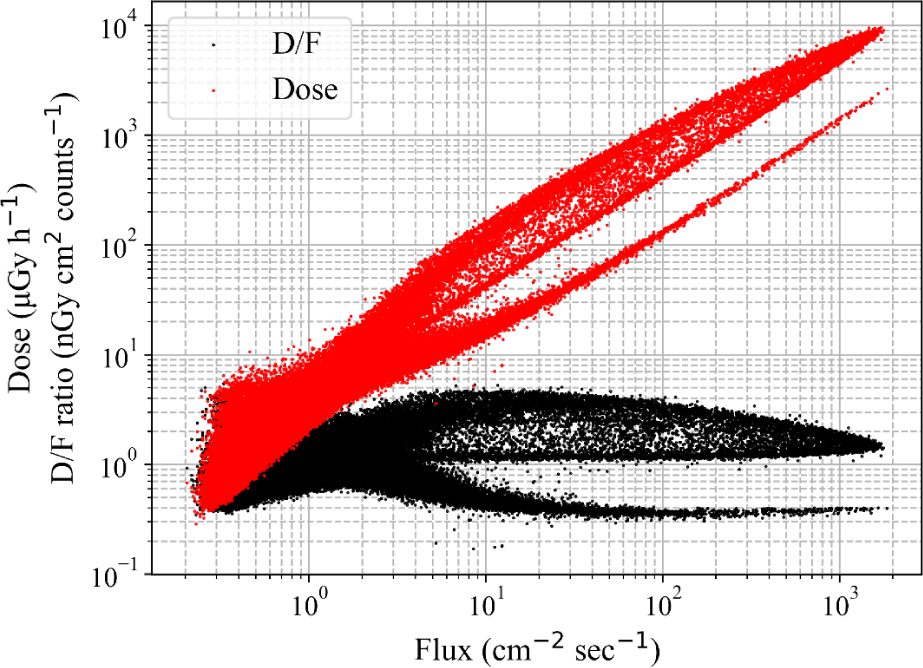
Fig. 8 characterizes the predominant radiation sources detected by LEO-DOS, using dose rate from flux and dose to flux (D/F) dependencies. The abscissa plots the measured flux in cm–2 s–1, while the ordinate shows the dose rate in μGy h–1 and the D/F ratio in nGy cm–2 particle–1 from July to September 2023. The red experimental points along the diagonal represent dose rate values that are linearly dependent on the flux, while the black points lying almost horizontally indicate the D/F ratio. From this figure, when the dose to flux ratio (D/F) exceeds 1.12, it can be characterized as an IRB source, whereas when the D/F ratio is less than 1.12, it can be characterized as an ORB source (Dachev 2009). However, the GCR, IRB, and ORB sources in dose rate < 15 μGy h–1 region are intermixed each other, making it difficult to distinguish between them. Regions with flux < 4 cm2 s–1 exhibit values of 15 μSv h–1, and this value was used as the criterion to differentiate between GCR and ORB sources.
Due to the difficulty in categorizing radiation sources based on the D/F and flux relationship, the L-value was used to distinguish the radiation sources. The L-value, L-shell or McILwain L-parameter is a parameter used in space physics to describe the location of a magnetic field line in the Earth’s magnetosphere (Dachev et al. 2017). It corresponds to the radial distance from the Earth’s center to the point where the magnetic field line crosses the magnetic equator, measured in Earth radii, if the magnetospheric magnetic field is a dipole field.
Fig. 9 shows the distribution of the dose rates measured with the LEO-DOS instrument against McIlwain’s L values. Fig. 9(a) represents the SAA and GCR regions, generated during the period from August 17 to August 18, 2023. The SAA is an area where the IRB comes closer to the Earth’s surface due to a displacement of the magnetic dipole axes from the Earth’s center. The IRB is located at altitudes ranging from 0.2 to 2.0 Earth radii at the geomagnetic equator. Within the SAA region, electron energies can reach up to 10 MeV, while proton energies extend up to 700 MeV. The SAA region is characterized by L-values ranging from 1 to 2.5. These findings are in good agreement with the referenced literature (Dachev et al. 2017). In this region, the radiation dose rate of the LEO-DOS is measured at 8,774 μGy h–1. The maximal particle fluxes at an L-value of approximately 1.24 are recorded as 1,706 particles cm–2 s–1. From LEO-DOS data, SAA events are characterized by dose rate > 15 μGy h–1, L value < 2.5 and D/ F > 1.0 nGy cm–2 particle–1.
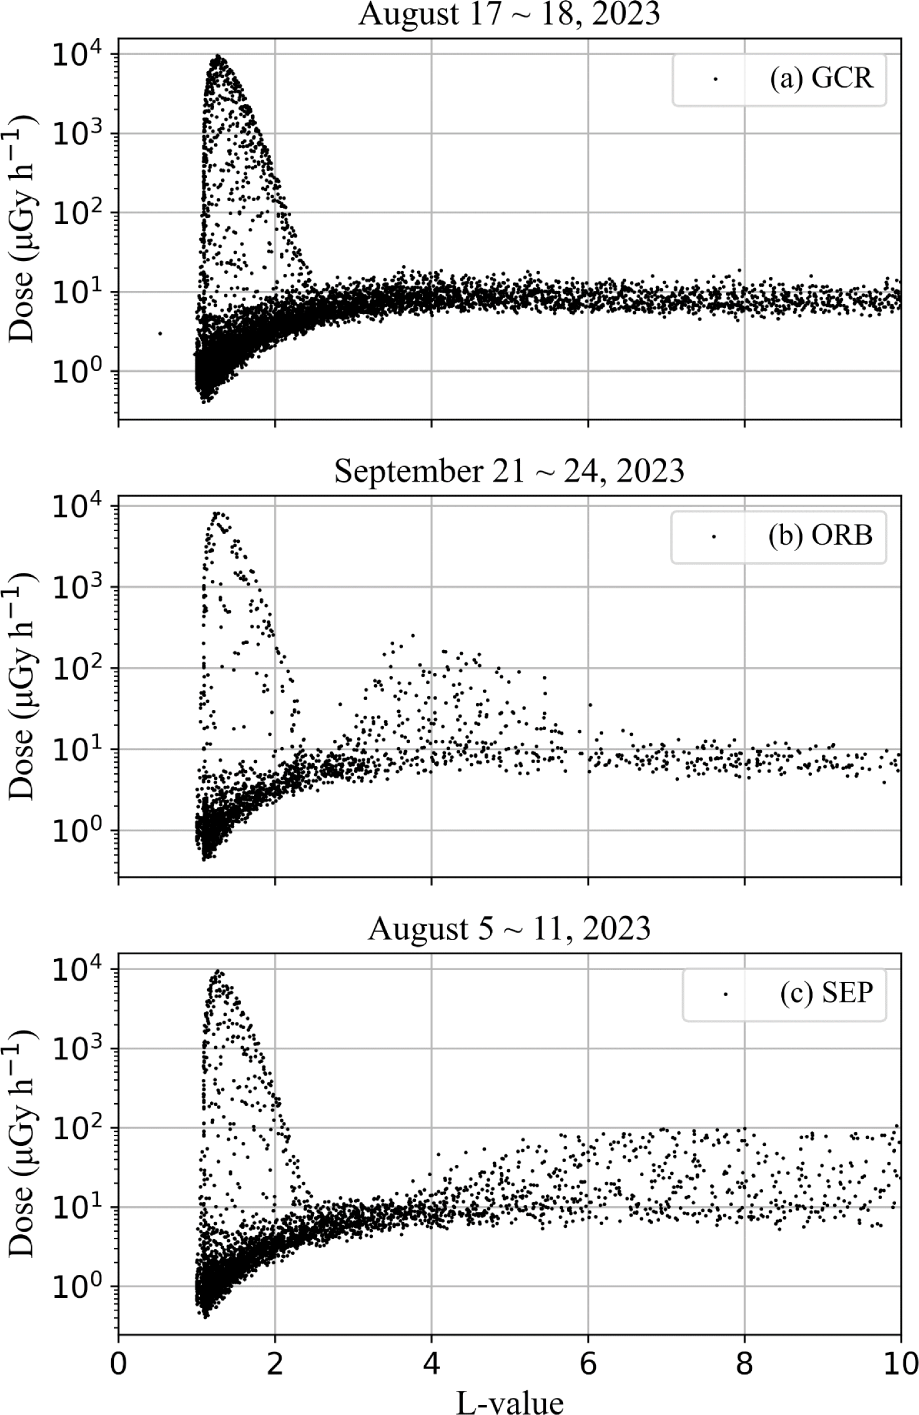
GCR is charged particle that originated from sources beyond the solar system and consists of 98% proton and heavy ions (baryon component), 2% electrons. GCR are seen everywhere and at all times. In regions where L > 4, the energy deposited in the silicon sensor exhibits a spectrum similar to that of GCR (Dachev et al. 2017). The GCR plot in Fig. 9(a) was generated by selecting a period from October 17 to October 30, 2023, during which ORB events were not distinguished. From this plot, we adopt an upper GCR value of D < 15 μGy h–1 as the selection criterion.
Fig. 9(b) illustrates the ORB region generated during the period from September 21 to September 24, 2023, when ORB events were characterized by very high ORB fluxes and dose rates. Sporadic high-energy electrons are seen mainly at 3 < L < 7 where the ORB is usually situated. It primarily contains electrons with energies extending up to a few MeV. Thus, they are characterized by dose rate D < 15 μGy h–1, D/F < 1.12 nGy cm2 particle–1 and flux > 4 cm–2 s–1. These criteria are essential for understanding and mitigating radiation effects in space environments. The ORB poses challenges for spacecraft and satellite design due to its elevated radiation levels.
Fig. 9(c) depicts the dose variation caused by SEP events during period from October 5 to October 9, 2023. SEPs are primarily produced by solar flares and are associated with intense solar activity. SEPs cause a clear increase in the dose in L > 4 when an event occurs. The ion energies of SEPs typically range between a few MeV and larger per nucleon. They are characterized by dose rate > 15 μGy h–1, L > 4 and D/F > 1.12 nGy cm2 particle–1. These criteria are crucial for assessing the impact of SEPs on spacecraft, satellites, and astronaut health during space missions. Understanding and mitigating the effects of SEPs is essential for safe space exploration.
5. RESULTS AND DISCUSSION
Table 4 presents the statistics for radiation sources based on selected criteria from July to September 2023. These include the average dose rate (Dsi) (μGy h–1) and (DH2O) (μGy h–1), the average quality factors (Qav), and the dose equivalent rates (H) (μSv h–1) for PD, as well as the average dose rate (D) (μGy h–1) and the equivalent dose rates (H) (μSv h–1) for NS. Additionally, four SEP events during the same period are also presented.
The average absorbed dose rate (Dsi) of GCR measured with LEO-DOS PD during no quiet conditions was 4.72 μGy h–1, which is higher than the average absorbed dose of GCR measured through Liulin onboard the ISS of 2.78 μGy h–1 (Dachev et al. 2017). This difference is likely due to the inclination of the ISS, where Liulin is mounted which orbits the Earth with an inclination of 51.6°, while the NEXTSat-2, where the LEO-DOS is mounted, orbits the Earth with an inclination of 97.8°. Due to the higher inclination of the NEXTSat-2 orbit, the LEO-DOS passes through the polar region with a higher L-value, resulting in higher radiation exposure.
The average absorbed dose rates of PD for SEP and IRB sources show a more significant difference from Liulin’s measurement value than that of GCR. The reason for this difference is that the low energy protons dominant in SEP and IRB sources can be effectively shielded by the 10 mm TEP surrounding the PD, while the GCR has very high energy, most of which easily passes the 10 mm TEP. Due to this difference, a significant difference in the dose rates occurs for sources with a high proportion of low energy protons in PD with a 10 mm TEP shield and Liulin with a thin aluminum shield. In the case of the ORB region, most of the electrons below 3 MeV, which make up the majority of the ORB environment, are shielded by the 10 mm TEP of the PD, resulting in a huge difference in dose rates from Liulin’s measurement results.
Radiation protection is crucial for understanding how harmful space radiation doses are to the human body during space travel, especially in LEO. Using the tissue equivalent sensor, LEO-DOS measured the absorbed dose (D), quality factor (Q), and dose equivalent (H) of space radiation for charged particles and neutrons.
The cumulative dose over 30 days for charged particles was approximately 0.164 Sv, significantly lower than the maximum recommended safety level of 1.5 Sv for skin in LEO by the National Council on Radiation Protection (NCRP 2000). These results are consistent with those observed by Dachev et al. (2017) in the ISS radiation environment. For neutrons, the observed value was approximately 1/100th of that for charged particles, indicating a much safer level.
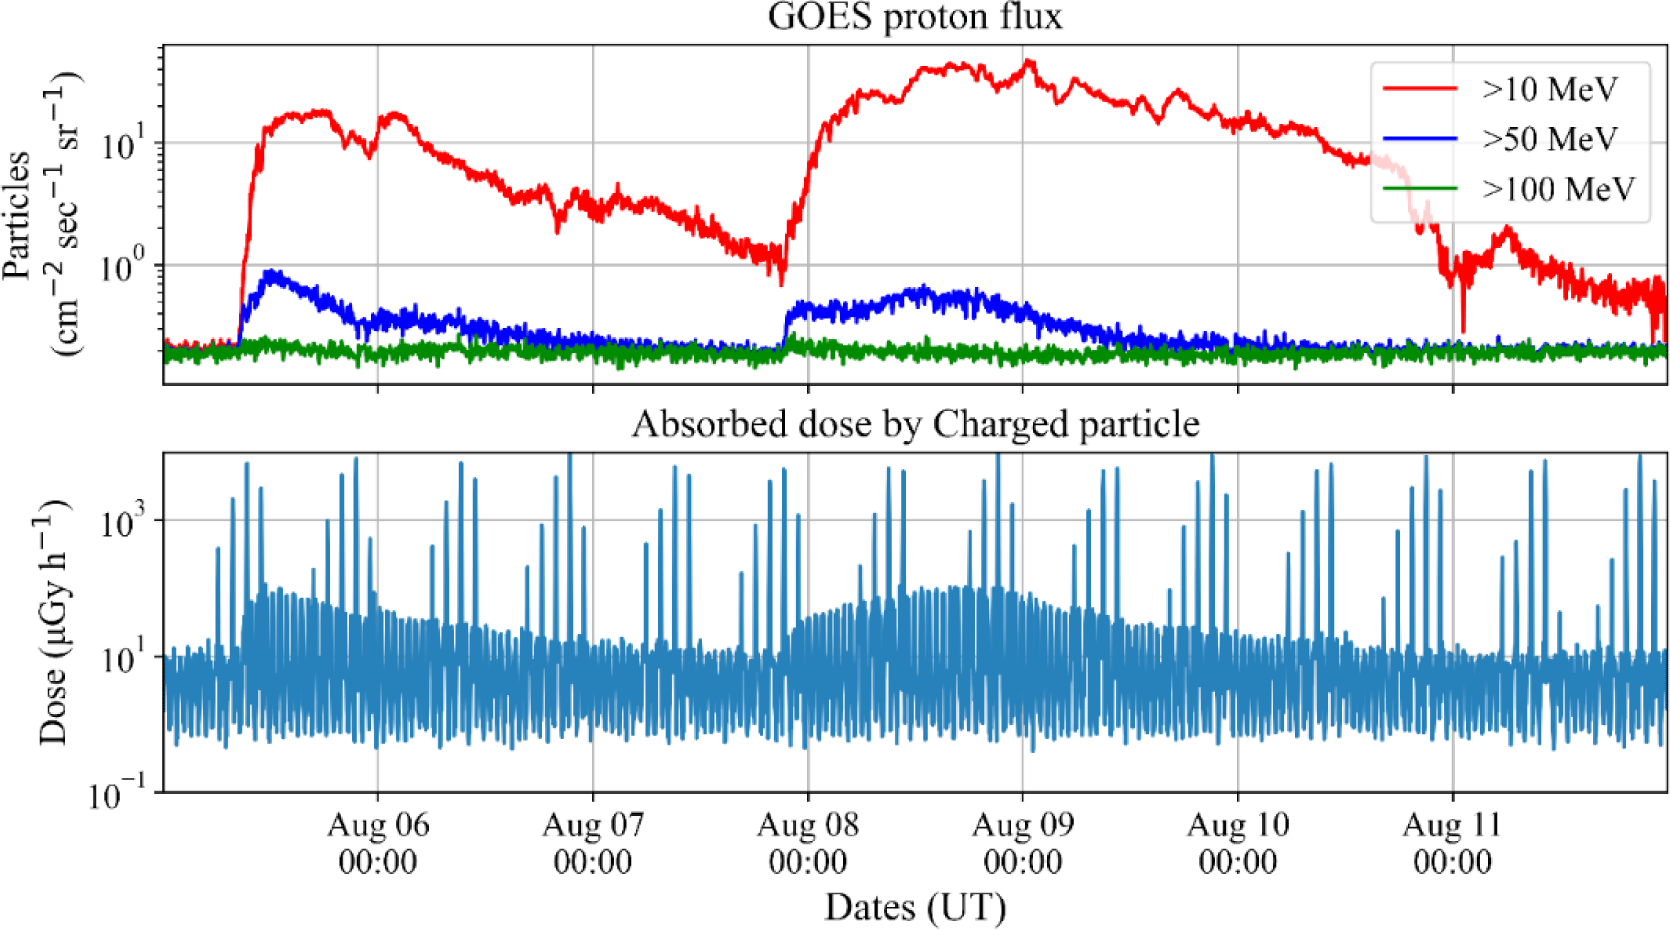
Fig. 10 illustrates the variations in SEP events from August 5 to August 12, 2023. The dose measured by LEO-DOS PD, plotted alongside the solar proton fluxes recorded by GOES-16 in geosynchronous orbit, shows the solar proton fluxes in the upper panel and the dose variation at 120-second intervals in the lower panel. The strong responses that regularly appear in the daily dose rate are associated with peaks from SAA encounters, as shown in Fig. 6. Excluding the SAA region, the dose variations measured by LEO-DOS show good agreement with the >50 MeV proton energy data from GOES-16. This is because the LEO-DOS PD has a self-shielding effect for proton energies below 40 MeV, as shown in Table 1.
In the case of NS, the measured absorbed dose (D) in the GCR region was 0.03 μGy h–1. This value was higher than the simulated value of 0.013 μGy h–1. In the MCNP simulation in this study, the absorbed dose and equivalent dose of NS were calculated using the neutron spectrum without shielding at 380 km altitude and 51.6° inclination obtained through simulation by Sato et al. (2006). The lower dose values in the MCNP simulation are due to the spectrum used in the simulation corresponding to a lower altitude and inclination compared to the LEO-DOS mission. Due to the high inclination of the LEO-DOS mission, NS passes through a polar region with low vertical cutoff rigidities, which can cause the generation of more albedo neutrons due to the higher GCR intensity (Dachev et al. 2023). Considering these points, it was concluded that the measured values showed good agreement with the values predicted by the simulation.
Radiation protection is crucial for understanding how harmful space radiation doses are to the human body during space travel, especially in LEO. Using the tissue equivalent sensor, LEO-DOS measured the absorbed dose (D), quality factor (Q), and dose equivalent (H) of space radiation.
Based on three months of observations with LEO-DOS, the measured biological effectiveness Q values for different radiation sources were 4.36 ± 0.27 for GCR and 1.73 ± 0.25 for SAA. Considering the detector geometry and the satellite’s inclination of 97.8°, these values are reasonably similar to those obtained by Dachev et al. (2017), which were 3.5 for GCR and 1.3 for SAA. Meanwhile, for the PD of LEO-DOS using a 10 mm TEP, the Q value for SEP was 2.82 ± 0.65, which is similar to the value of 2.5 measured on the ISS using a 40 mm TEP (Semkova et al. 2014).
6. SUMMARY and CONCLUSIONS
Since its successful launch on May 25, 2023, LEO-DOS has been operating normally up to 2024. This paper summarizes the results of an initial analysis of the data observed up to September 2023. One of its objectives, the creation of a global dose map for charged particles and neutrons in LEO, has been successfully achieved. Radiation source selection techniques, including GCR, IRB, ORB, and SEP, have been established. The observational results were validated by comparing them with measurements taken in the ISS orbit (Dachev et al. 2015). This has enabled quantitative analysis of the LEO-DOS observation for the space radiation environment study in LEO.
From July 2023 to September 2023, four SEP events were observed. The dose variations due to SEP were consistent with changes in proton energy > 50 MeV as measured by GOES. Neutron dose was successfully measured, with an absorbed dose of 0.03 μGy h–1 and an equivalent dose of 0.3 μSv h–1 in the GCR region. The dose for neutrons was 1/100th of the dose from charged particles.
Currently, research on the biological effects of the near-Earth space environment is being conducted through long-term LEO-DOS observation results and energy deposition analysis on the sensor. In conclusion, the LEO-DOS results will help improve models that simulate biological doses during long-term human space travel and provide accurate radiation risk estimates for future interplanetary manned flights. Additionally, the technical heritage of the LEO-DOS instrument will be applied to the development of the lunar vehicle radiation dosimeter (LVRAD) for the lunar radiation environment.
