1. INTRODUCTION
The distribution of minerals on the lunar surface provides a clue to how the Moon has evolved from the thermal and chemical standpoint. The Moon which we see today is the consequence of evolution as it went through the late heavy bombardment, magma oceans, differentiation of the mantle and crust, impacts, and volcanic activity. Much of the detailed mineral properties came to light when the Apollo program returned with lunar rock samples. Since there has been no plan to explore the Moon since the Apollo program until recently directly, studies on mineral property have been conducted mainly in the form of remote sensing, and as a result, mineral maps have been produced for the entire Moon (Nozette et al. 1994;McEwen et al. 1997;Lemelin et al. 2019;Lucey et al. 2000).
Lunar minerals are affected by various factors such as lunar evolution and space environment, etc. Thus, lunar minerals can be studied from various perspectives. Lunar evolution, space weathering on the lunar surface, and volcanic activities such as magma eruptions, impacts, or melting are typical examples of them. Among those, lunar volcanic activity is the primary contributor to the formation of current lunar topography, and lava tubes, which are common in volcanic regions on Earth and have been discovered on Mars, have attracted attention among various terrains (Cushing et al. 2007;Cushing 2012;Hong et al. 2014;Jung et al. 2014, 2016).
Unlike the Earth, the Moon, which does not have a strong magnetic field and a thick atmosphere, is exposed to smallscale collisions by high-energy particles such as solar wind, cosmic rays, and micro meteorites introduced from external space. Hence, the physical and structural characteristics of the lunar regolith change gradually over time. This phenomenon is called space weathering. Direct observation of this phenomenon was made through analysis of samples from the Apollo program (McCord & Johnson 1970;McCord & Adams 1973). The effect of space weathering on minerals can be identified through spectral lines of minerals. In the visible light region, reflectance decreases and looks darker, and in the near infrared region, the depths of the mineral absorption lines are becoming shallower and absorption lines shift to a longer wavelength (McCord & Adams 1973). It has been found that nanophase iron (np-Fe0) in minerals is the cause of the variation in the spectral lines of minerals depending on space weathering (Pieters et al. 1993, 2000;Pieters & Noble 2016). From the spectral lines, which show space weathering over time, the relative age of various topography on the lunar surface can be estimated (Lucey et al. 1995, 2000;Grier et al. 2001;Yi et al. 2015;Sim et al. 2017;Sim & Kim 2018). In addition, solar wind particles are trapped in minerals to produce hydroxyl (OH), which could be a clue to the existence of lunar water (Kim et al. 2018).
It is known that the lunar topography can be largely divided into highlands and maria, with lunar maria mainly composed of basalt and highlands composed of anorthosite. The reason why the lunar maria looks dark is because of Fe and Mg, which constitute basalt, and minerals rich in these two elements are called mafic minerals. The lunar mafic minerals comprise olivine (Ol) and pyroxene primarily. Ol are known to originate from the mantle and are sometimes referred to as ultramafic because of their very high iron content (Wieczorek et al. 2006;Melosh et al. 2017). In order to understand the evolution of the Moon from the past, studies on the mantle as well as the lunar surface must be conducted. However, humans cannot reach the depth of the mantle directly in the Earth up until now, not to mention the Moon. Therefore, Ol that exist on the surface of the Moon can be said to be a clue that has information about the mantle, which is difficult for humans to reach directly. Hence, Ol are essential minerals for understanding the evolution of the Moon. However, care should be taken as Ol may not necessarily be originated from the mantle but may be a plutonic rock created by magma intruding into the lunar crust (Yamamoto et al. 2010).
Lunar Ol is a solid solution of Fe and Mg. While Ferich Ol are called fayalite (Fa, Fe2SiO4), Mg-rich Ol are called forsterite (Fo, Mg2SiO4) (BVSP 1981). The current mainstream explanation for the lunar evolution is as follows (Ringwood & Kesson 1976;Hess & Parmentier 1995;Elardo et al. 2011;Charlier et al. 2018;Li et al. 2019b). As the lunar magma ocean cools down and differentiates, the dense mafic minerals are crystallized first, forming Ol which sink into the lower mantle. After that, as pyroxene crystallizes, it takes the metals contained in magma, and plagioclase (Pl) of low density crystallizes on the lunar surface. Crystallized Pl form the crust and become the current lunar highlands, while Ol and pyroxenes continue to crystallize and sink down. When entering the final stage of magma crystallization, the lunar crust composed of Pl gradually thickens, and ilmenite (Ilm, FeTiO3) crystallize just below the crust. However, Ilms are denser than Ol sunk down already, creating a gravitational instability in the magma, and eventually, overturn of a positional reversal between the high-density minerals in the lower crust and Ol in the lower mantle occurs. Mg-rich Ol among the Ol after the overturn are located in the lower crust and are called Mg-suite rock (or Mg-suite magma). These are rarely found over the lunar surface. Also, volcanic activity such as magma eruption appears on the lunar surface due to the movement of magma. At the end of magma crystallization, potassium (K), rare earth elements (REE), and phosphorus (P) which are abundant in residual magma, crystallize in the lower crust to create the KREEP layer and stay at the same level as the Mg-suite rock.
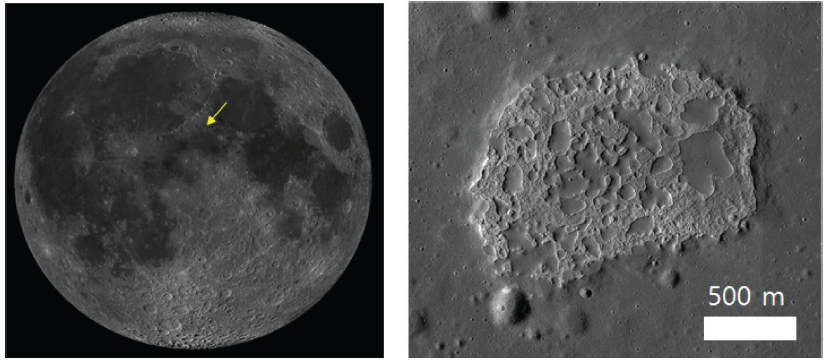
Irregular mare patch (IMP) is a recently discovered terrain and has been explored with the distribution of highresolution images of the Lunar Reconnaissance Orbiter Camera Narrow Angle Camera (LROC NAC) due to its small spatial scale. Ina, as shown in Fig. 1, is the first IMP discovered and is located at 18.66°N, 5.3°E the Lacus Felicitatis (Lake of Happiness). It was discovered in the images taken by Apollo 15 in 1971 due to its big size unlike other IMPs (Whitaker 1972). Based on the observation data at the time, Strain & El-Baz (1980) proposed that Ina was a topography created by magma erupted from the fissure. After high-resolution imaging became available, Garry et al. (2012) speculated that it was created by the expansion of lava flow, as there was no eruption spot of magma such as a crack in Ina.
Braden et al. (2014) searched for IMPs all over the Moon and found 70 of them, and updated location information of 91 IMPs is being distributed by NASA Planetary Data System (PDS) currently. 3 out of the 70 IMPs are estimated to be less than 100 million years old, and it is believed that after the volcanic activity completely stopped, these were created by small magma eruptions. Wilson & Head (2017) proposed a magmatic foam model to explain the IMP formation process. In this model, even after the surface of erupted magma is hardened, the active underlying magma below the surface is extruded through fissures on the hardened surface to form IMPs. According to this model, it is believed that most of the IMPs were created billions of years ago. Qiao et al. (2020) claimed that most IMPs were created in lunar maria that formed 3 billion years ago, coinciding with the peak of lunar volcanic activity. Byron et al. (2022) analyzed the thermal characteristics of the 8 largest IMPs and found that, unlike the general lunar maria, the thermal inertia was low. For the reason of this, they speculated that the materials comprising IMPs include small rocks weaker in strength than the general lunar regolith.
Since the IMP is a recently discovered terrain, there is not much research on it, and the origin of the IMP is being disputed by various studies. Previous studies have mainly analyzed optical images to derive scientific results, and no results of spectroscopic image analysis that can confirm mineral properties have been published yet. Therefore, in this study, deconvolution of spectral images is applied to areas of IMPs where olivine, a mafic mineral, is abundant to analyze mineral characteristics.
2. DATA AND METHOD
The spectral characteristics of minerals appear mainly in the range of infrared (IR), and IR wavelengths have been observed by spectrometers mounted on orbiters whose main mission is to observe minerals in planetary or lunar exploration (Bibring et al. 2006;Pelkey et al. 2007;Ohtake et al. 2008;Green et al. 2011;Chen et al. 2020). The data used in this study are the spectral observation data of the Moon mineralogy mapper (M3) built by Brown University in USA, which was mounted on the Indian Space Research Organisation (ISRO) Chandrayaan-1 (Green et al. 2011).
The spectral observation data are presented in the form of a three-dimensional array consisting of two-dimensional images for each wavelength range. The observed wavelength range is 446–3,000 nm, and the global mode data used for the analysis has a spectral resolution of 20–40 nm per each band, that is, 20 nm for short wavelength range and 40 nm for long wavelength range. There are total of 86 wavelength regions in a hyper-spectral type. While the spatial resolution is up to 140 m per pixel, but in actual data, it is about 200 m per pixel since the orbital altitude of Chandrayaan-1was elevated due to an operation issue (Green et al. 2011). The data is distributed by NASA PDS and consists of raw data, radiance, and reflectance divided by three data processing steps, and in this analysis, reflectance data are used. Since the document of distributed reflectance data mentions the ground truth correction which was not applied to the data (Isaacson et al. 2013). Thus, we performed a ground truth correction.
The wavelength range used for this analysis is limited to 550–2,600 nm. The data in the short wavelength region are distributed hidden in the reflectance data, because it is not worth using for analysis since it does not contain any meaningful values in the image. Clark et al. (2011) and Li & Milliken (2016) pointed out that the spectral lines may be deformed in the wavelength region around 3,000 nm because the effect of heat remains even after thermal correction is performed. In addition, the analysis method to be applied is based on the mineral spectral library generated in the laboratory, and the wavelength range of the spectral data in the list is up to 2,600 nm.
Spectral data deconvolution uses a modified Gaussian model (MGM). MGM is proposed by Sunshine et al. (1990) and it is a technique to decompose spectral lines into Gaussian curves according to the initial conditions set by the user, and each Gaussian curve represents the characteristics of the mineral. Calculation code uses the one distributed by Brown University’s NASA reflectance experiment laboratory (RELAB).
Ol shows a change in the shape of spectral lines depending on the composition ratio of Fe and Mg (Fo# = [(Mg2+ / (Fe2+ + Mg2+)) × 100]) and has a characteristic that the center of the largest absorption line shifts as a shorter wavelength (King & Ridley 1987). Sunshine & Pieters (1998) decomposed the absorption lines around 1,000 nm into three Gaussian curves while applying MGM to Ol, and showed that Relative Fo# could be determined from the trend of variation in the central wavelength of each Gaussian. Isaacson & Pieters (2010) showed that analysis could be made for Ol by decomposing absorption lines into three Gaussian curves using lunar rock samples. Isaacson et al. (2011) presented an effective continuum removal method for spectral lines with added continuum due to thermal effects while applying MGM to four Ol-rich regions with M3 spectral data. China’s Chang’e-4 mission’s Yutu rover is equipped with an IR spectrometer, which landed on the von Karman crater on the far side of the Moon. By applying MGM to the Ol data obtained by direct observation which has a higher signal to noise ratio (SNR) compared to remote sensing such as M3, it was revealed that the Ol in the landing area was of mantle origin (Li et al. 2019a;Gou et al. 2020).
Minerals on the lunar surface are unlikely to exist as a single mineral of Ol, and are likely to be present as a combination of various minerals. Therefore, when applying MGM to the mineral spectral lines, other minerals must be taken into account, and representative examples are pyroxene and Pl. Depending on the content of Ca, lunar pyroxene is classified into orthopyroxene (Opx) with low Ca and clinopyroxene (Cpx) with high Ca. Pyroxene with low Ca content is composed of Fe and Mg. Sunshine & Pieters (1993) showed that by applying MGM to pyroxene, the relative composition ratio of Opx and Cpx can be obtained with the depth of the Gaussian curve. Denevi et al. (2007) confirmed the relative composition ratio of Ca and Fe in pyroxene using the central wavelength of the Gaussian curve. Kanner et al. (2007) analyzed pyroxene on Mars and estimated the relative composition ratio of Opx and Cpx through the normalized band strength ratio (NBSR) of the Gaussian curve, however, due to the limitations of remote sensing with a low SNR, the accuracy decline was about 10% and it was pointed out that careful approach is needed for the analysis. Trang et al. (2013) showed the effect of impurities other than specific minerals on the MGM results for each spectral line of Ol and pyroxene, and showed that the relationship between impurities and Fe content deforms the spectral lines.
Pl are distributed throughout the Moon, but their spectral characteristics are not prominent compared to mafic minerals. Thus, in the general observation data, the characteristics of Pl are masked by other minerals, especially when combined with Ol (Cheek & Pieters 2014). From the non-laboratory observation data, pure anorthosite regions which are rare on the Moon show the strong spectral characteristics of Pl (Ohtake et al. 2009).
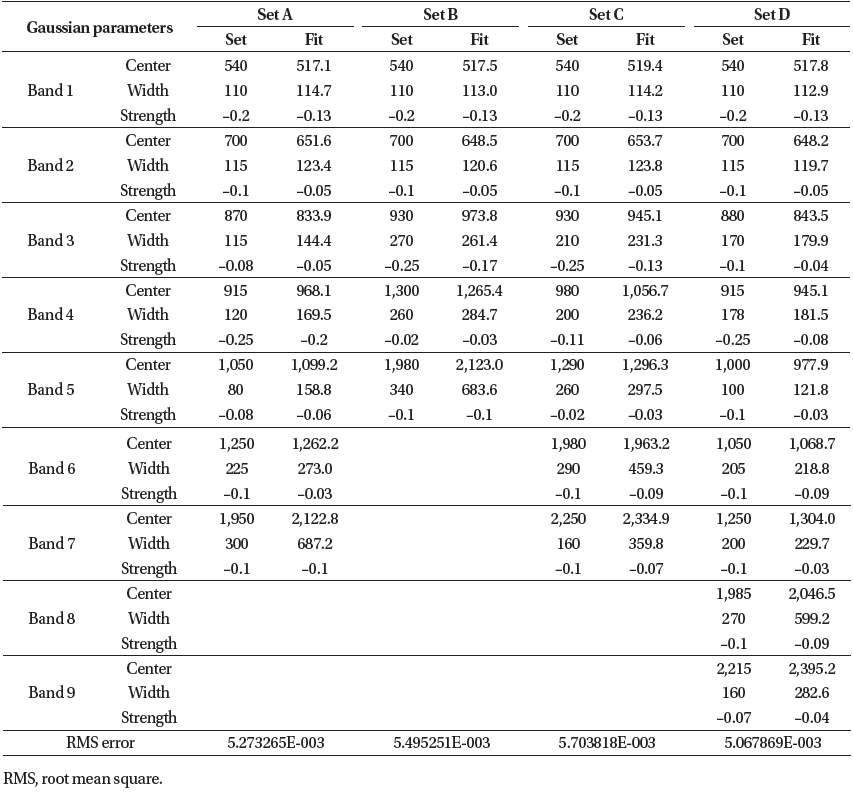
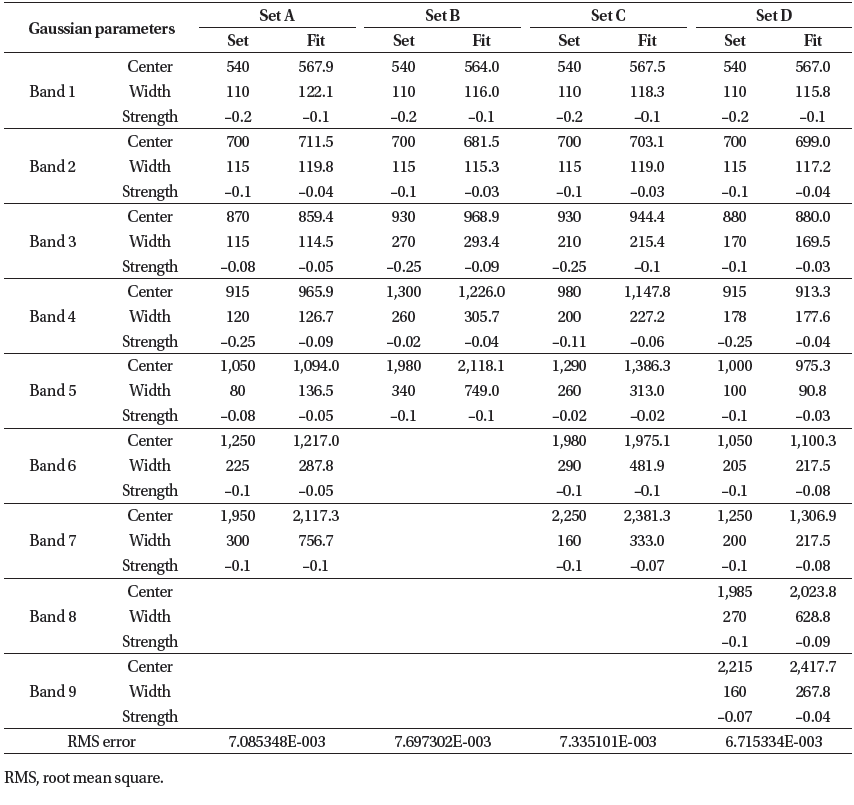
When using the MGM technique, the most important thing is to set the initial conditions, and previous studies also made a significant effort to set the initial conditions (Sunshine et al. 1990, 1993;Sunshine & Pieters 1998;Noble et al. 2006;Denevi et al. 2007;Kanner et al. 2007;Isaacson & Pieters 2010;Isaacson et al. 2011;Trang et al. 2013;Cheek & Pieters 2014;Li et al. 2019a;Gou et al. 2020). The reason why setting proper initial conditions is important is that, due to the characteristics of decomposing spectral lines into Gaussian curves by mathematical calculation, there is a possibility that non-physical initial conditions produce results that seem to have scientific significance. The method of setting the initial conditions mainly utilizes the information of the Gaussian curve obtained by applying MGM to the spectral lines of a pure single mineral in the mineral spectroscopy list and minerals whose composition ratios are accurately known. Next, by combining the Gaussian curve information obtained from each mineral, several artificial spectral suites are created and those are set as the MGM initial conditions of the observation data. By comparing the root mean square (RMS) of each result, the mineral combination with the minimum value is interpreted as the mineral combination of observation data. In this study, the initial conditions and the mineral combination of Li et al. (2019a) are used as an example case, and initial conditions will be derived as a follow-up study. Four mineral combinations are considered in this study: Set A (Ol + Opx), Set B (Opx + Pl), Set C (Opx + Cpx + Pl), and Set D (Ol + Opx + Cpx).
Ol are decomposed into three Gaussian curves, and the composition ratio of Fe and Mg can be inferred according to the position of the central wavelength of each curve. According the central wavelength, these curves divided into M1-1 (860 nm), M2 (1,050 nm), and M1-2 (1,250 nm). As the ratio of Mg increases near each wavelength, it tends to move toward shorter wavelengths (Sunshine & Pieters 1998). Pyroxene decomposes into two Gaussian curves for both Opx and Cpx, and as the ratio of Ca increases around 1,000 nm and 2,000 nm, the wavelength center of each curve tends to move toward longer wavelengths (Kanner et al. 2007). In order to find out the composition ratio of combined minerals, the NBSR suggested by Kanner et al. (2007) is calculated. NSBR can be calculated as follows.
Where, A, B, C are the minerals of combination, and BD(A) is the band depth of the Gaussian curve of the mineral A. As the number of minerals increases, the number of terms in the denominator is added. In the case of Ol, M2 can be applied while pyroxene can be applied to both Gaussian curves of 1,000 nm and 2,000 nm, but the 2,000 nm region has no information about Ol. Hence, the 2,000 nm region is not used when Ol is included in the mineral combination, and only the 1,000 nm region is used.
Identification of the distribution of Ol in the IMP areas uses the SELENE multi-band imager (MI) Ol weight percent (wt%) map made by Lemelin et al. (2019). The spatial resolution of this map is 60 m per pixel, and the results of multi-spectral image processing have been verified by laboratory sample analysis. Although there are errors in some areas, it is useful for simply checking the distribution of minerals at a specific location throughout the Moon, and no significant error was found in the areas for this study. Since IMPs are represented by only a few pixels except for a few cases in the M3 spectroscopic image, it is difficult to identify the distribution of Ol in the IMP region. Thus, in the MI Ol map, IMPs with Ol content greater than 20wt% were selected (Table 1) and among 91 IMPs, the number of selected IMPs is 6 (Table 1).
3. RESULTS AND DISCUSSION
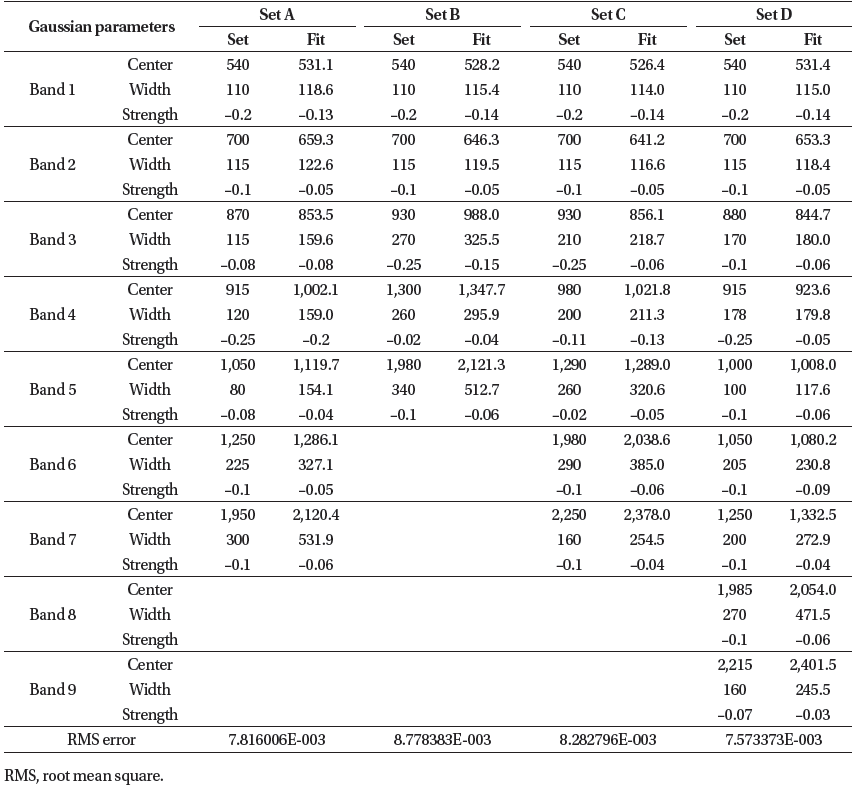
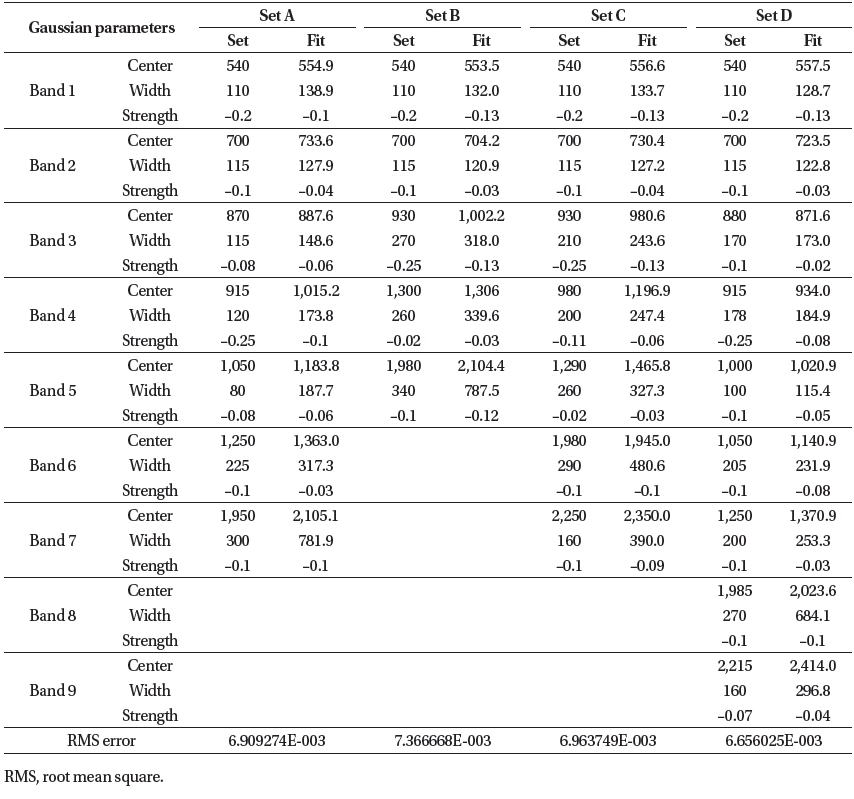
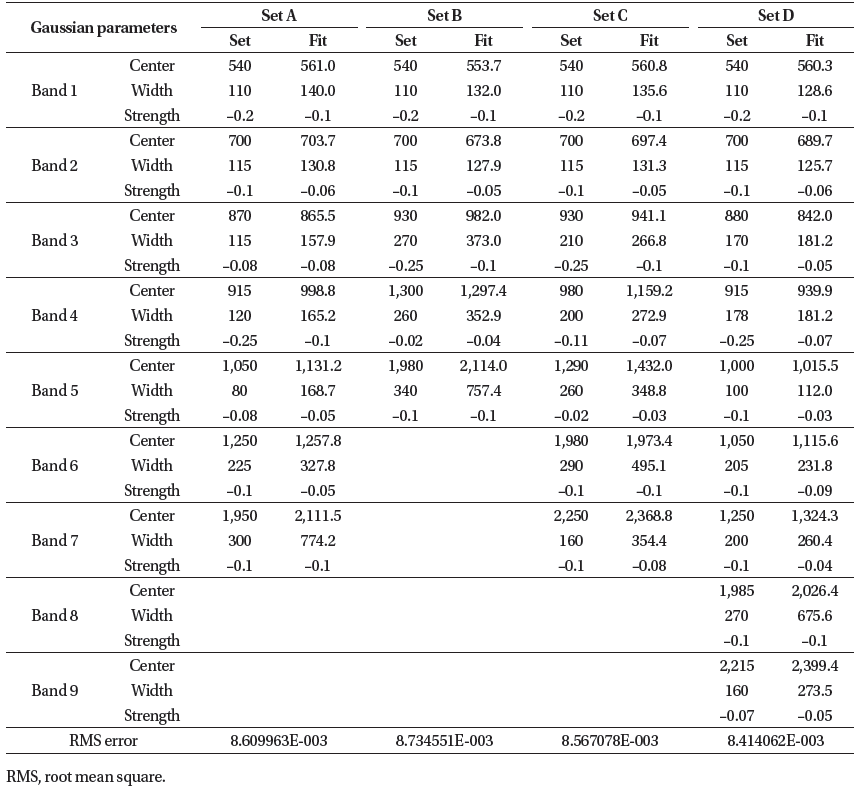
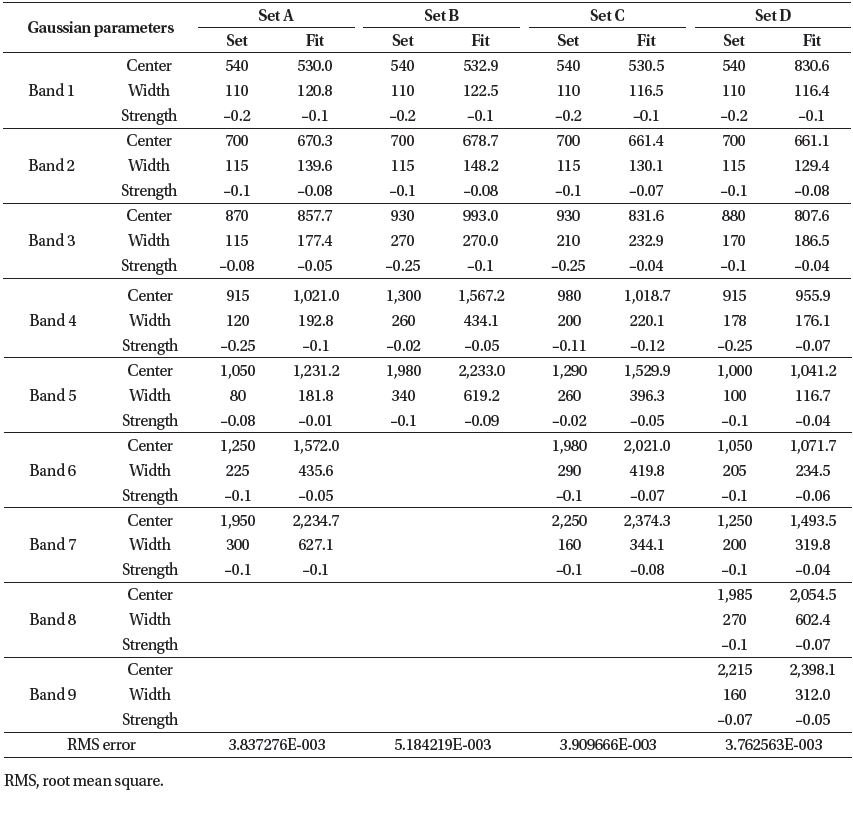
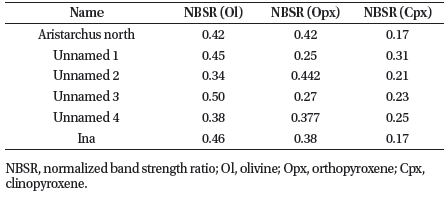
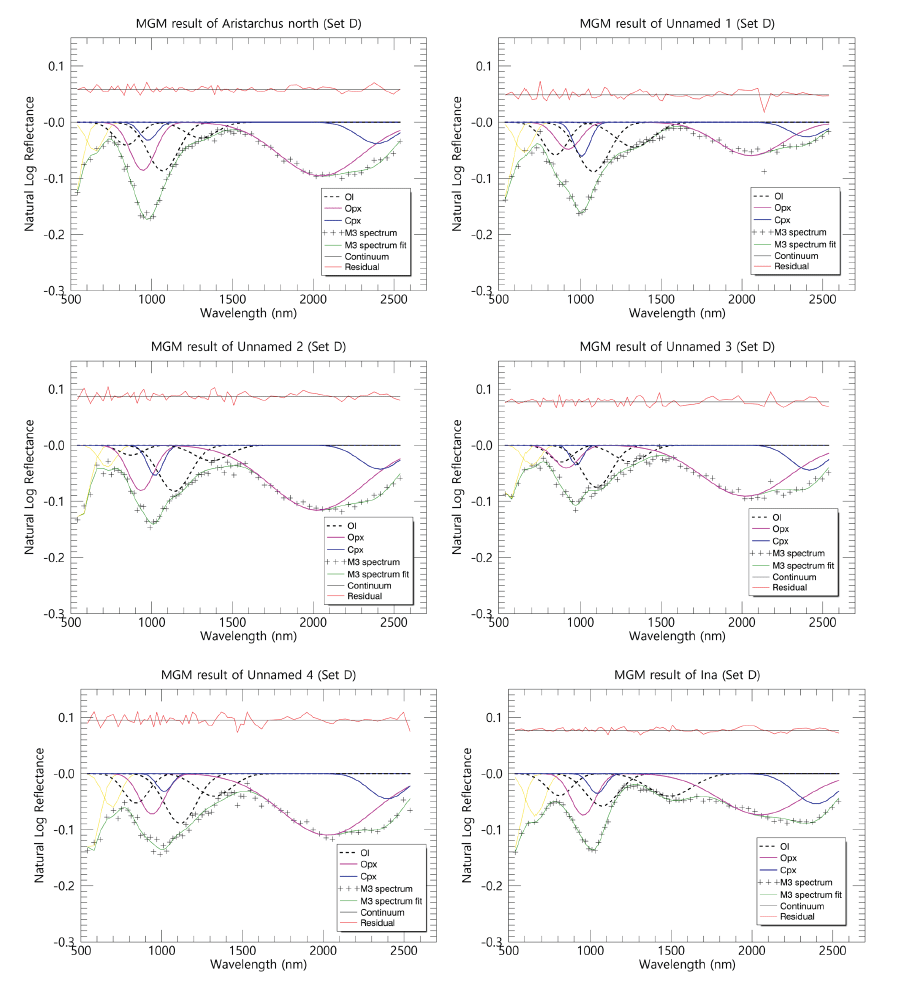
Parameters and figures of MGM results for 6 IMPs are shown in Tables 2–7 and Fig. 2. RMS values of the four mineral combinations show that the RMS of Set D is the lowest among all 6 IMPs (Table 8). The residual (red line) in Fig. 2 shows that the variation tends to be rather large, except for the Ina region. The reason for this is that Ina has a large area and is represented by several pixels in the M3 image, and while applying MGM to the spectral line corresponding to the average of the pixels, it seems that most of the noise was removed in the process of calculating the average. Since the area of the remaining IMPs cannot be estimated, the MGM was applied to the spectral line for a single pixel, and the residual variation seems to have increased due to the noise of each spectral line. NBSR is around 1,000 nm and showed a composition in the order of Ol-Opx-Cpx as shown in Table 9.
|
|

|
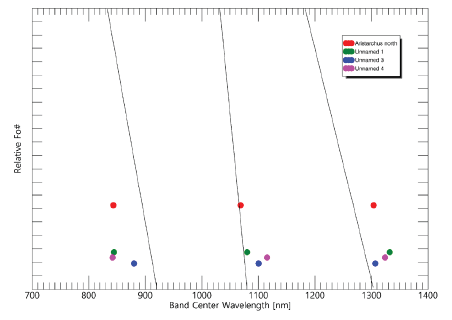
The Ol Gaussian curves, M1-1, M2, and M1-2 are shown in Fig. 3. We could get the results for only 4 out of 6 IMPs. The two produced values out of the Y-axis range of the figure and it is suspected that an error was introduced when applying MGM. One of the possible causes for this error is the noise of the spectral line resulting in the inaccurate calculation. Also, a problem in setting the initial conditions could contribute to this error. Noise in observation data is a problem caused by using a spectral line of a single pixel. And the solution for this is to utilize high-resolution optical images to enable to a selection of several pixels constituting IMP, thus, it is necessary to supplement the data collection stage. The problem of setting the initial conditions can be regarded as a fundamental limitation of this study. The initial conditions derived in other studies are used for this study instead of deriving the MGM initial condition values by finding samples similar to the spectral lines of the observation data with the data in the spectral library. Thus, the results seem scientifically meaningful, but it is a weak justification. It is necessary to determine the proper initial conditions consistent with the observation data through follow-up studies on this issue. All of the Ol characteristics of the four regions where the results were obtained showed a very high content of fayalite, which suggests that these regions are not related to Mg-suite magma.
The lunar rock formation is different from that of the Earth and is characterized by the low partial pressure of oxygen. The low oxygen partial pressure prevents the formation of Fe3+ in the magma, so minerals mainly Fe2+ crystallize, and oxide minerals such as FeO and silicate minerals including fayalite are produced (Heiken et al. 1991). Most lunar oxygen is contained in silicate minerals, which are more abundant than oxide minerals. Therefore, pyroxene with a lot of Fe is evenly distributed throughout the mafic mare. Olivine, which has a relatively low composition ratio compared to pyroxene, exists mainly in fayalite, and Mgsuite rocks are rare.
4. CONCLUSION
In order to find out the Ol characteristics of the magma eruption area of IMPs which are believed to be created relatively recently, the MGM technique was applied to determine which element was more abundant in the area, Fe or Mg. Since the age of the areas of study is rather young and the time exposed to the space environment is small, it was expected that the deformation of the spectral lines would be less, and it would be possible to determine the clear characteristics of Ol. However, the age of IMPs may be older depending on the hypothesis of IMP formation. In the MGM results, the Ol-rich IMP regions are predominantly abundant in fayalite and showed little relationship with Mgsuite magma.
Through the results of this study, we identified the compositional characteristics of the regions which have not yet been attempted in other studies, for the first time. However, it is necessary to take into account the decrease in reliability due to noise in the observation data and problems found in the initial condition setting of the MGM. On second thought, it can be said that the foundation for enhancing the degree of completion in the follow-up study was established because issues were clearly identified. Also, through further study, it is necessary to classify the mineral properties of all IMPs discovered so far, not limited to mafic minerals, in order to utilize them to infer the origin of each IMP.

