1. INTRODUCTION
The ground surface of the Moon or a planet such as Mars is mostly covered with a fine-grained loose soil known as regolith (Ishigami et al. 2007). On such a terrain, a rover can experience slippage and sinkage in the loose soil, which makes driving a difficult task. Thus, to overcome the problems of driving a rover on loose soil, it is important to investigate the interaction behavior between the wheels and the soil.
Studies on wheel-soil interaction or tracked vehicles on ground surfaces are encompassed by the field of terramechanics. Understanding wheel-soil interaction behavior is key to evaluating wheel performance of a rover vehicle on loose soil. For the understanding and the modeling of wheel-soil interaction physically, pressuresinkage models have been proposed theoretically and empirically (Bekker 1960, 1969;Wong 1978;Gottleland & Benoit 2006), and there have been successful applications of adapting these terramechanics-based models to the motion analysis of planetary rovers (Iagnemma & Dubowsky 2004;Ishigami et al. 2007;Kim et al. 2015). In addition, several terramechanics-based dynamics models that can consider the slip and traction forces of a rigid wheel on loose soil have been developed and applied to exploration rovers (Yoshida & Hamano 2002;Yoshida et al. 2003;Kim et al. 2015).
Despite the wheel-sinkage models having been successfully applied to the traction mechanics of rover wheels, those models have limitations. For example, in the Bekker-Wong terramechanics theory, there are several implicit assumptions. The first one is that the penetration of a wheel into soil can accurately be approximated by the penetration of a plane and rigid plate, but the curved surface of small rover wheels is markedly different from that of a plane and rigid plate. The second one is that in the Bekker theory it is assumed that wheel traction is governed by full plastic failure of soil, like Mohr-Coulomb soil, not by slip at the wheel-terrain interface. However, for typical small and light rovers maneuvering on lunar terrain with low wheelsoil contact pressure, this assumption may not be 100% true. The effect of slip on rover wheel-soil interaction has been highlighted by many researchers (Iagnemma & Dubowsky 2004;Ishigami 2008;Kim et al. 2015).
In addition to the drawbacks of the Bekker-Wong terramechanics theory, an important limitation for planetary rover modeling is the lack of ability to analyze the effect of a variable gravitational field on soil strength (Andrade et al. 2011). Another serious limitation of the Bekker-Wong terramechanics model is that it is not easy to include severe wheel sinkage and slippage effectively when modeling wheel-soil interaction. However, these phenomena were experienced by both of the Mars Exploration Rovers, Spirit and Opportunity, on numerous occasions (Andrade et al. 2011;Rankin et al. 2020). An example of such a situation resulted in Spirit becoming permanently entrapped on Mars in May 2009 (McKee 2009;Edwards et al. 2017).
The pressure-sinkage model plays an essential role in terramechanics. It is used to derive sinkage and resistance, which in turn are used to derive performance metrics such as thrust, and drawbar pull (Ishigami 2008).
Next, some basic aspects of pressure-sinkage models are reviewed and addressed. Then, a new pressure-sinkage model based on dimensional analysis (DA) and results of bevameter tests are introduced. For this purpose, Korean Lunar Soil Simulant (KLS-1) was used as a simulated regolith. To develop the new model, a new bevameter was designed and built, and pressure-sinkage testing was performed using three different sizes of flat plate of bevameter for applying normal load. The newly proposed model was compared with other models for validation purposes.
2. BEVAMETER TEST AND PRESSURE-SINKAGE MODEL
A bevameter is a test device used in terramechanics to evaluate the mechanical properties of soil. In general, the pressure-sinkage relation is obtained from a bevameter test to assess terrain mechanical properties in order to evaluate vehicle mobility.
To simulate and reproduce the forces exerted by a vehicle wheel, Bekker (1956) developed a bevameter that generated equivalent mechanical loads to soil. There are two typical tests: One is the pressure-sinkage test, and the other is the shear test. These two tests are developed since normal and shear stresses around the wheel generate derived characteristics of wheel sinkage due to vehicle load.
The pressure-sinkage test is useful in evaluating the response of soil to a wheel load. This test involves applying pressure using a plane rigid plate on the soil. Sinkage is defined as the vertical distance from the lowest point of the track or wheel to the undisturbed soil surface. The sinkage is the measured distance that is obtained by displacement transducer when the normal load is applied to the flat plate as Fig. 1 shows. Thus, the bevameter test measures resistance forces experienced by the plate surface.
During a shearing test using a bevameter, an annular shear ring under a preselected normal stress simulates shearing action of a rotating wheel of a vehicle on a terrain surface. The test measures the applied torque and corresponding angular distortion (Edwards et al. 2017).
Taking a different viewpoint, Ishigami (2008) described how wheel sinkage can be divided into two different mechanisms: static and dynamic sinkage. Static sinkage is generated under vertical (normal) load of a wheel, whereas dynamic sinkage is generated when a rover wheel is rotating. The dynamic sinkage is dependent on the slip ratio of the wheel, the wheel surface pattern, and the soil characteristics. However, most pressure-sinkage models are empirically obtained and neglect the slip ratio.
Several pressure-sinkage models (Wong & Reece 1967;Bekker 1969) have been proposed for wheel-soil interaction since the introduction of the Bernstein-Goriatchkin model (Bernstein 1913). The original Bernstein-Goriatchkin model is an empirical pressure-sinkage single-parameter equation, expressed as follows (Edwards et al. 2017):
where, z is the sinkage depth of the plate subjected to a vertical pressure p, k is a modulus of inelastic deformation, and n is the exponent of sinkage (Bernstein 1913;Bekker 1969;Oravec 2009;Edwards et al. 2017), which varies between zero and one.
Since it is pointed out that the pressure-sinkage equation described in Eq. (1) is inappropriate for application, as the parameter k depends on the size and shape of the test plate, the parameters k and n need to be corrected considering the effect of size and shape of the plate.
Bekker (1956) improved the Bernstein-Goriatchkin model by replacing k = kc / b + kφ with new parameters kc and kϕ as follows:
where, b is the width of a rectangular plate or the radius of a circular plate; kc and kϕ are deformation modulus of cohesion and friction, respectively; and n is the parameter that determines the shape of the pressure-sinkage curve.
The Bekker (1969) model is one of the most widely used models for predicting the pressure-sinkage behavior of a homogenous soil (Edwards et al. 2017).
In general, for determining the values of kc, kϕ and n, a curve fitting is necessary with data from at least two pressure-sinkage tests with different plate sizes.
Wong (1980) proposed a procedure for determining Bekker’s model parameters based on a weighted leastsquares method from a pressure-sinkage plot at log-log scale, as shown Fig. 2.
According to Wong’s method, the best fitted value of the pressure-sinkage terrain parameters can be derived by minimizing the function by using a weighting factor p2 as follows:
Minimization requires taking partial derivatives of the function. By solving Eq. (3), n and keq can be obtained as
In bevameter testing, it is necessary to use a minimum of two different plate sizes so that the parameter n can be determined for each plate. Therefore, the average n-value must be used when calculating ln keq in Eq. (5). However, there are three different keq because keq = (kc / b + kϕ) depends on the diameter of plate b. Using a least-squares approach, kc and kϕ are determined as follows using n-avg including all three plates:
Therefore, x = A / b
where,
Reece (1965) argued that the relationship between kc and b in Bekker’s model should be improved. He suggested a new pressure-sinkage model as
where, . c is the cohesion; γ is the soil unit weight; and are the cohesive modulus and frictional modulus of soil deformation, respectively.
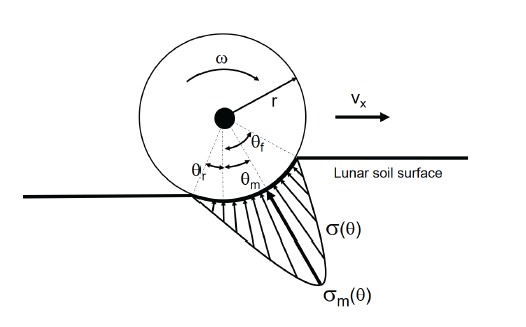
The Wong and Reece model (Wong & Reece 1967) is a modified version of the Bekker model. The model assumes that the radial stresses at the wheel-soil interface, σθ, is normal in the radial direction, which is expressed as
and
where, θ is an arbitrary wheel angle, θf is the entry angle (the acute angle between the centerline of the wheel and the beginning of contact), θr is the exit angle (the acute angle between the centerline of the wheel and the end of contact), θm is the maximum radial stress point, and r is the radius of the wheel, schematically illustrated in Fig. 3.
Our study used a custom-built bevameter located at the geotechnical testing laboratory of Pai Chai University. The device can perform two types of tests for evaluating wheel-soil interaction: a normal pressure-sinkage test and a shear test. To perform a normal pressure-sinkage test, the bevameter uses three different sizes of loading plates to apply a specific pressure to the simulant soil prepared in a container box (soil bin). A load cell (FUTEK-MBA 500) is located between the flat plate and loading frame to measure the resistance force, and a laser sensor (KEYENCE IL-600) is used to continuously measure the vertical distance traveled (displacement) by the plate.
A schematic diagram and a photograph of the bevameter test setup is shown in Fig. 4. The tests used a circular container 24 cm in diameter, filled with simulant soil (KLS- 1) to a depth of roughly 32 cm. The pressure-sinkage tests using the bevameter used simulant test beds prepared at an average target density of 1,602 kg/m3 to observe the pressure-sinkage behavior.
Sibille et al. (2006) demonstrated an efficient preparation of lunar soil simulant in a test bin, which reproduces the physical properties of soil such as bulk density, cohesion, and friction coefficient. The recommendation by Sibille et al. (2006) for preparation of the simulant in the test bin filled with KLS-1 was followed in this work. The setup is shown in Fig. 5.
It was difficult to prepare uniform simulant specimens at a specific relative density. A hopper with a glass tube was used to deposit the KLS-1 simulant into a steel container to obtain a target relative density. Compressing the simulant soil as gently and as uniformly as possible with a tamper allowed the relative density to be as close as possible to the target density (Edwards et al. 2017). The mass of the material deposited in the container (soil bin) determined the target specimen density considering the volume of the deposited simulant in the container.
To evaluate the effect of flat plate diameter on the pressure-sinkage relationship, the pressure-sinkage tests were conducted using three different flat plate diameters with KLS-1 simulant. In total, fifteen pressure-sinkage tests were performed. Three flat plate diameters were used, ranging from 0.06 m to 0.075 m. This diameter range was obtained by considering the wheel size of a rover assembled from a kit sold commercially under the name of Leo Rover©. The rover’s wheel size was 130 mm (diameter) × 60 mm (width).
The physical properties of the simulant soil (KLS-1) have already been summarized by Ryu et al. (2015).
As already mentioned, for constructing a pressuresinkage model, it is necessary to consider the pressuresinkage relation with the wheel diameter. To perform a pressure-sinkage test, a linear actuator fitted to the bevameter was used to lower the flat plate into the soil specimen while the load cell and the laser sensor measured the resistance force and vertical displacement (sinkage), respectively.
The loading frame was equipped with 2 DOF verticalaxis force with a torque sensor, a linear motor actuator, and a laser sensor. The linear motor actuator provided up to 200 mm of stroke. The maximum normal load was limited to 889.64 N.
Before performing the tests, the required soil bin dimensions (height and diameter) were investigated by using the commercial finite element program ABAQUS and were verified again using general bearing capacity theory for shallow foundations. This verifying process for checking boundary conditions needed to be performed carefully to ensure that the soil bin walls would not interfere with the stress distributions or stress reflection effect beneath the loading flat plate.
In addition, as mentioned by Heather (2009), the soil bin diameter and depth must be at least three times the diameter of the largest plate. Thus, the soil bin was selected considering this guideline and the dimension effects as described. The soil bin diameter to plate diameter ratio ranged from between about 3.2 and 4, consistent with the ratios used by Oravec (2009) and Oravec et al. (2010) in their extensive studies involving a large bevameter testing program. The depth of simulant for the tests in this investigation was about 4.26–5.3 times the plate diameter. In general, the Boussinesq method for evaluating soil pressure suggests that an increase in vertical stress from a uniformly distributed circular surcharge applied on the surface diminishes to less than 10% of the surcharge below a depth of about 2B, where B is the surcharge diameter (Bowles 1982). Therefore, the deposited simulant in the soil bin to plate diameter ratios of about 2B or greater were considered acceptable for the pressure-sinkage test.
As mentioned already, determining the sinkage constants for the Bekker-Wong prediction model requires a minimum of two normal loads with two different plate sizes. The flat plate of a bevameter device must be selected considering the contact area of the rover wheels, which can be predicted by a projection plane of the wheel with the given payload of the rover.
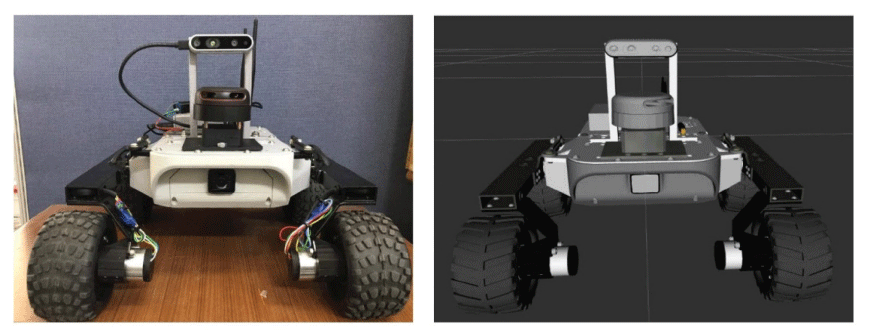
Although any reasonable plate sizes could have been used, the plate sizes were chosen to match the effective contact area of the Leo Rover®’s wheel (Fig. 6) and typical rover wheels, defined as the area of flat surface projection of the sunken portion of the wheel (Edwards et al. 2017). The Leo Rover wheel geometry provided values for estimating the contact area with the length of the contact patch along the wheel, equaling to one wheel radius. For this purpose, plate diameters of 60 mm, 70 mm, and 75 mm (Fig. 7) were selected, resulting in contact areas of 2,827.43 mm2, 3,848.45 mm2, and 4,417.87 mm2, respectively.
DA can reduce complicated physical problems to the simplest form by analyzing the quantitative characteristics of all parameters. Referring to Bridgman (1969), the principal use of DA is to deduce from a study of the dimensions of the variables in any physical system certain limitations on the form of any possible relationship between those variables. It is also described as a method of great generality and mathematical simplicity.
According to DA, a particular physical quantity Q0, is a “dependent variable” in a well-defined physical process. Then, a complete set of independent quantities Q1...Qn must be estimated for evaluating the value of Q0. The dimensionless forms of the independent and dependent variables were estimated based on the quantities. Buckingham’s π theorem (Buckingham 1914) was applied to construct a complete relationship between dimensional physical quantities by dimensionless form.
In this study, DA was used to evaluate the new pressuresinkage model for a rover’s wheel-lunar soil interaction. Sinkage z depends on four quantities parameters, usually: pressure p, soil density ρ, gravitational acceleration g, and the width of the penetration plate b. Therefore, the following relationship represents sinkage z as a function of independent variables:
Table 1 and Table 2 summarized base quantities and derived quantities respectively.
Regarding the dimensions of the quantities in Eq. (11), the dimensions can be reduced as follows:
In Eq. (12), the pressure p is a complete and independent variable, which is related to soil density, gravitational constant, and width of the penetration plate. Simple nondimensionalization leads to the formulation as follows:
By applying Buckingham’s π theorem (Buckingham 1914), the functional relationship of the above quantities can be expressed as
3. PRESSURE-SINKAGE TEST AND DATA ANALYSIS
The bevameter test procedure involved lowering the flat plate into the simulant in the soil bin under displacement control at a constant rate of 13.7 mm/s. Fig. 8 shows a typical pressure-sinkage relationship characterized as three phases (Gotteland & Benoit 2006). Starting at the zero-load condition, the first phase of the curve is a linear elastic region for very small sinkage. The second phase is a transition region that leads to a second linear phase in the third region that corresponds to soil plasticity (Gotteland & Benoit 2006;Edwards et al. 2017).
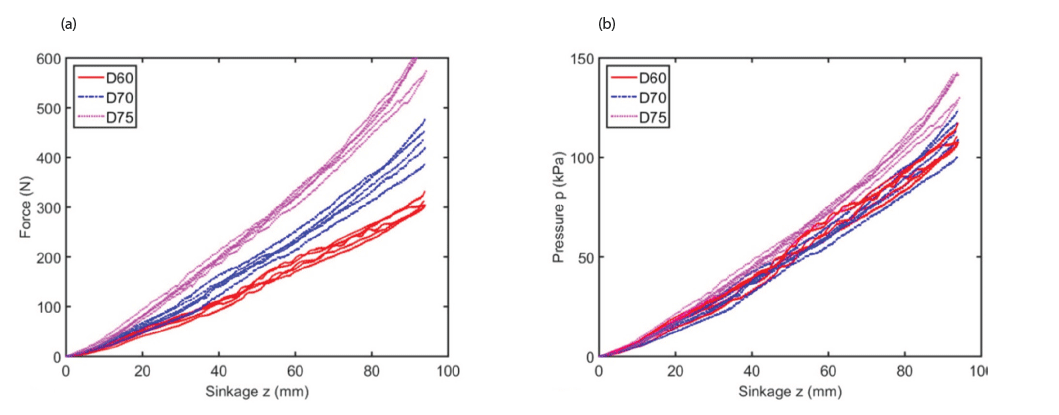
Fig. 9 shows the results of the normal bevameter tests grouped by flat plate diameter. The graphs exhibit a clear dependence on plate diameter. As the diameter increases, so does the observed pressure. This implies that as the plate diameter increases, the force required to attain a given level of sinkage increases more quickly than the contact area. The pressure-sinkage curves look very similar to each other. However, the curves are grouped separately with plate diameters. The larger the diameters, the more forces are required to obtain the same sinkage. However, it was noted that there was not a clear distinct inflection in the pressuresinkage response as described by Gotteland & Benoit (2006). At the very beginning of the curve (i.e., at loading initiation), a small elastic region was found when the curves were redrawn in pressure-sinkage response. All curves displayed a smooth and continuously upward increase with sinkage after experiencing the elastic zone at very small sinkage. Since relative density was not varied in this investigation, the influence of the relative density was not clarified.
Therefore, DA was performed first to obtain the pressuresinkage model based on the bevameter tests. Then, a proper least-squares approach was adopted to determine model parameters for the newly proposed model.
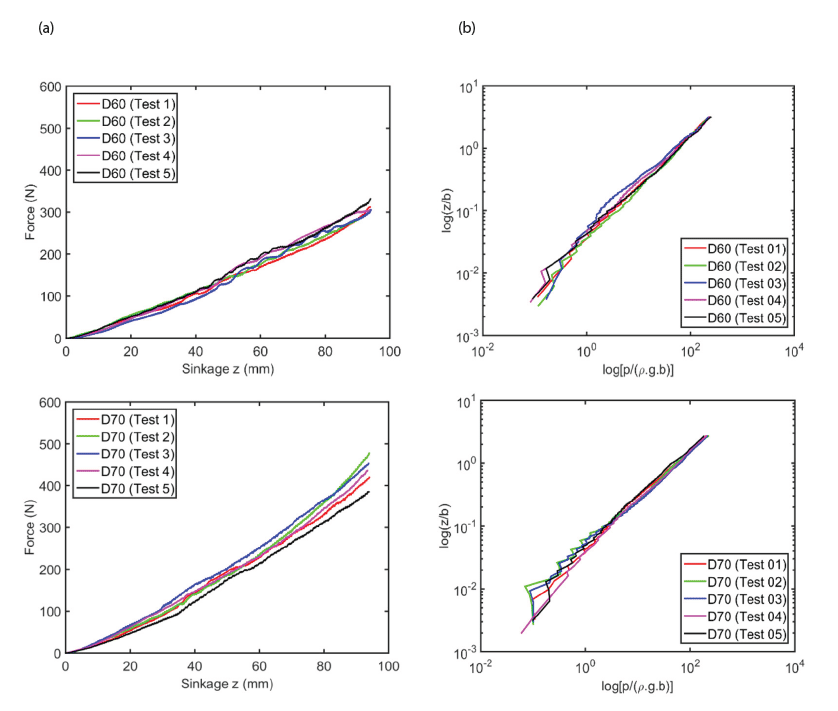
By applying the concept of DA to the pressure-sinkage relation, dependent and independent variables were determined, as described in Eq. (14). Since there were fifteen test graphs of the pressure-sinkage test for a given relative density (Dr), three grouped graphs with different plate diameters and converged graphs could be obtained by considering Eq. (14), as shown in Fig. 10 and Fig. 11, respectively. The process for obtaining these graphs is explained as follows. First, five test graphs of the pressuresinkage test data for each plate diameter were separately grouped for each plate diameter, as shown in Fig. 10(a). Then, by considering Eq. (14), the graphs in Fig. 10(b) were obtained by taking the log of both axes. Finally, three converged graphs were obtained. These are the generated metrics of DA, which are obtained by taking normalization of both dependent and independent variables.
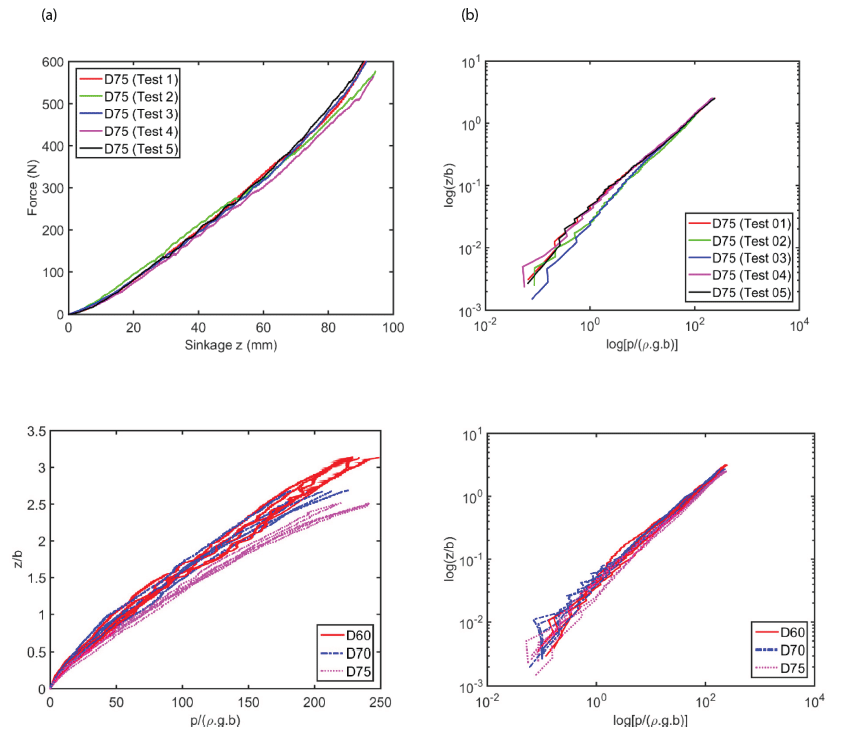
By taking the log scales of both axes of dependent and independent variables, a relationship between is considered to be linear. Therefore, Eq. (14) can be rewritten as
where, A and B are coefficients of linear equation that are real numbers. Thus, setting B = log k and A = n, the derivative of Eq. (15) can be rewritten as
In Eq. (16), the parameter k is non-dimensional and seems to be dependent on the width of the plate. By using IBM SPSS v.22 software and a trial and error process, a linear relationship between k and the width of plate b can be obtained as the following form:
where, α and β are the coefficients.
As described in Eq. (3), the best fitted value of the pressure-sinkage terrain parameters can be derived by minimizing the function. To determine parameters k and n, the least-squares method was applied. Referring to Wong (1980) and Eqs. (3)–(5), the best fitted value of the pressuresinkage curve can be derived by minimizing the function using a weighting factor. The Bekker (1956) and Reece (1965) models followed this minimizing process to obtain the terrain parameters. However, the new DA model proposed in this work follows different solving equations. For the new DA model, the minimizing function without a weighting factor is given as follows, since the standard deviation is similar when compared with the weighting factor. The average value of standard error deviation obtained from experimental data without and with weighting factors was 9.09% and 9.20%, respectively.
Then, by setting F = 0 and solving Eq. (18), parameters n and k can be obtained using the following equations:
As noted earlier, three different sizes of flat plate were used for bevameter testing. The parameter n was determined for each test. Then, the average of n values was used for calculating parameter k. Consequently, by transforming Eq. (17) to matrix form, with consideration of width of plate size b, coefficients α and β were determined:
Therefore, {x} = [A] / {b}
where,
By combining Eqs. (16) and (17), the pressure p with respect to sinkage can be expressed as
where, α and β are new model parameters. The unit of α is 1/m (L–1), while β is non-dimensional. Eqs. (18)–(20) are different from Eqs. (3)–(5), respectively.
4. ANALYSIS OF THE TEST RESULTS
Wong (2001) proposed an equation that defines the error between the experimental and the theoretical data. He suggested the so-called “goodness-of-fit” concept that can be used for checking the error level of the curve fitting as
where, pm is the measured pressure, pc is the calculated pressure, and N is the number of measured data points used for the curve fitting. In addition, Wong (2001) defined the sinkage curve-fit as perfect when the goodness-of-fit value is 1.
The converged pressure-sinkage curves shown in Fig. 11 were used to determine the parameters for the Bekker, Reece, and DA models, respectively. With the values of kc, kϕ, navg, and b, the Bekker, Reece, and DA model curve fits were applied to each corresponding data set following the above equations. The goodness-of-fits of these curve fits were calculated using Eq. (24).
Table 3 summarizes the parameter results for the models. The parameters of the model developed in this study took different forms and have units from those of other models. Table 3 also indicates that there is no difference in parameter n between the Bekker and the Reece models. Oravec (2009) made a similar observation based on the Bekker model fit to normal bevameter test results on simulant GRC-1 (Edwards et al. 2017), as shown in Table 4.

|
The Bekker and Reece model parameters from published pressure-sinkage test results on several simulants and other sandy materials are available for comparison with the KLS- 1 tested in this study. Selected for comparison were the Bekker parameters of lunar simulant GRC-1 (Oravec 2009) and Martian soil simulants ES-1, ES-3 and Fillite (Brunskill et al. 2011;Edwards et al. 2017) as well as a dry sand and a sandy loam soil (Wong 2001). As observed in Table 4, the Bekker model parameters for KLS-1 most closely resembled those for ES-3. The majority of n exponents for each material are close to 1, with KLS-1 closing to 1.25 and slightly larger than those of all other materials. However, the kc (kN/mn+1) value was very different from the others.
For the Bekker and Reece models, the goodness-of-fit values differ from each other, with slight margins between them. Table 5 show the comparison of fitness values of the DA model with the Bekker and Reece models. All models provide fitness values close to 0.9 and above 0.85.

|
Figs. 12–15 show the predicted behavior versus test results for the Bekker, Reece, and DA models, respectively. In general, the models matched experimental curves well for all plate sizes. The DA model provides somewhat better predictions than the Bekker model and the Reece model.
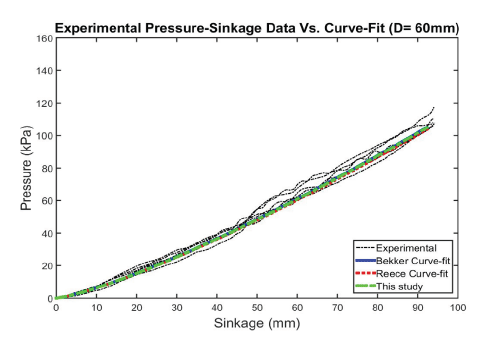
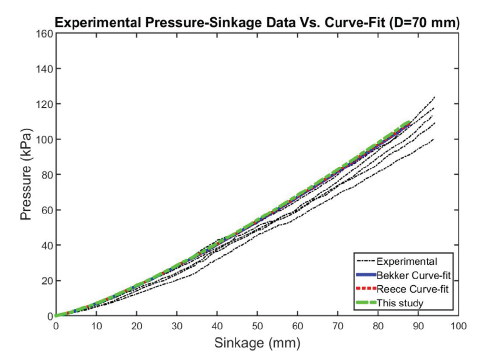
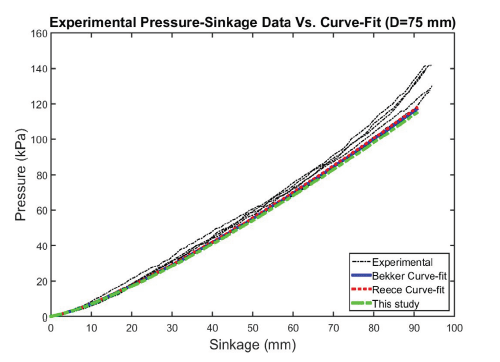
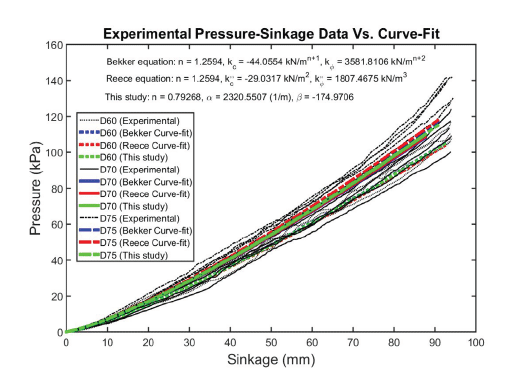
All models match well with measured values and might be capable of capturing the increase pattern in the pressure with sinkage for most plate diameters. All graphs obtained by the models followed the curve 3 group, as depicted by Lyasko (2010), and are shown in Fig. 16. This owes to the fact that parameter n is larger than 1.0.
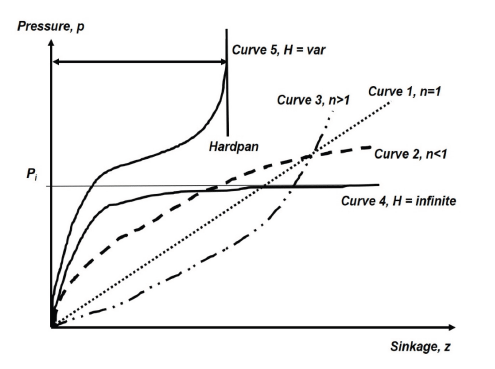
As noted by Lyasko (2010), the pressure-sinkage prediction models contain the plate-soil parameters n, kc, kϕ that depend on the test conditions and can be determined only experimentally using a load-sinkage curve fitting procedure after tests. In addition, the test results are affected by loading rate and soil conditions such as relative density, especially in regards to whether the soil is homogeneous or not.
5. CONCLUSIONS AND DISCUSSION
This work presents the results and analysis of normal bevameter tests performed on Korean Lunar Simulant (KLS- 1), produced by Korea Institute of Civil Engineering and Building Technology. This is a lightweight, artificially made soil that uses ground natural rocks to simulate planetary regolith.
The main objective of our study was to obtain the pressure-sinkage characteristics of KLS-1 by using a newly designed bevameter and a new pressure-sinkage model based on DA in high-sinkage, high-slip situations, such as encountered by planetary rovers. The results demonstrated that bevameter testing is of merit for simulant soils.
The pressure-sinkage curves of KLS-1 fell more gently compared with Martian soil simulant ES-3, indicating that KLS-1 has much greater resistance against sinkage as compared with other terrestrial soil-based simulants. The results of normal bevameter tests determined the parameters of the Bekker, Reece, and DA models. In general, the DA model parameters generated similar pressure-sinkage behavioral predictions, which were consistent with those of the Bekker and Reece model parameters, even though the units of the DA model parameters were different.
This work also introduced a new pressure-sinkage model based on DA and bevameter testing. The testing data obtained by the custom-built bevameter equipment with KLS-1 were analyzed. The new model based on the bevameter was evaluated by reducing the physical quantities to their simplest form by DA. Moreover, estimation of new model parameters using the least-squares method by Wong (1980) was also performed. In addition, the results of pressure-sinkage tests determined the parameters of the new model as well as the Bekker and Reece models. By comparing the new model with other models, the new pressure-sinkage model developed in this study was wellvalidated with reasonable goodness-of-fit values. To obtain better reliability when using the proposed model, other simulants will be used with different relative densities.


