1. INTRODUCTION
The universe is well known to be consists of 70% dark energy, 26% dark matter and 4% the standard model (SM) particles (Cho 2016a, b). The dark matter dominates the density of matter in the universe, but the particles have not been detected directly or indirectly until now. Considering the rich interaction structure of the SM particles that well describe the composition of the universe, it is natural to think of similar interaction behaviors of dark-sector particles. Dark photons can be part of this interaction between dark matter particles and provide the presence of a non-gravitational force window by kinematically mixed with the SM photons (Choi 2018). Computational science is being widely applied in the area of astroparticle physics, especially in the search for dark matter (Cho 2016a, b;Cho 2017). Because the cross-section of dark matter is extremely small compared to that calculated by the SM, extensive simulations are required (Cho 2017) in such analyses. In this regard, it is necessary to optimize the central processing unit (CPU) time to efficiently carry out simulations (Cho 2017;Yeo & Cho 2019;Yeo & Cho 2020). The SM has been wellestablished with the discovery of the Higgs boson particle (Aad et al. 2012;Chatrchyan et al. 2012). However, because the SM does not explain the characteristics of dark matter, little is known about it and it is being actively investigated through various methods (Cho 2016a).
In this work, we studied dark matter at the electronpositron collider using MadGraph5 as a simulation tool (Alwall et al. 2014;Yeo & Cho 2018). Specifically, we examined the CPU time and cross-section values considering three parameters such as the center of mass (CM) energy, dark photon mass, and coupling constant. The signal process corresponded to the dark photon, which couples only with heavy leptons (Shuve & Yavin 2014;Yeo & Cho 2018). We only dealt with the case of dark photon decaying into two muons using simplified model which covers the SM particles, dark matter particles, and dark photon particles (Alves et al. 2012). To compare the CPU time for the corresponding calculation, the KISTI-5 supercomputer of Nurion Knights Landing (KNL) and Skylake (SKL) and a local Linux machine were employed. The Nurion KNL and the SKL are equipped with the Intel Xeon Phi 7250 and Xeon 6148 processors with 68 and 40 cores per node, respectively. One or more cores of the machines were used to compare the CPU time.
2. METHODS
This section presents the specifications of the Nurion KNL, the Nurion SKL, and the local Linux machine (Yeo & Cho 2020). The machines were used to compare the CPU time under the same sample jobs. The Nurion KNL and the SKL consist of 8305 and 132 nodes, with each node having 68 and 40 cores, respectively. The local Linux machine has 32 cores. The theoretical peak performance for the Nurion machine is 25.7 PFLOPS (with the KNL and the SKL corresponding to 25.3 and 0.4 PFLOPS, respectively) (Yeo & Cho 2020). Table 1 summarize the specifications of the employed machines. Fig. 1 shows the process flow of the complete simulation (Cho 2016a, b). We generated the electron-positron collider event at a CM energy ranging from 10 GeV to 500 GeV. This energy range was selected considering the requirements of Belle II (10.58 GeV) , Future Circular Collider (FCC)-ee (91 GeV), FCC-ee/Circular Electron-Positron Collider (CEPC) (160 GeV), CEPC (240 GeV), and International Linear Collider (ILC) (500 GeV) which pertain to representative electron-positron collider experiments. Feynman diagrams were generated using MadGraph5 (Alwall et al. 2014) from the simplified model (Alves et al. 2012), and the event simulation was performed on the Pythia8 framework (Sjöstrand et al. 2015). Next, the detector simulation was performed using Delphes (de Favereau et al. 2014). Finally, physics reconstruction was performed using MadAnalysis5 (Conte et al. 2013). The result file was generated in the ROOT format for plotting (Antcheva 2009).

|
3. DARK PHOTON AT THE ELECTRON-POSITRON COLLIIDER
If the dark photons in the dark sector interact with the particles of the SM, the dark photon can be coupled with charged lepton, that is muon, which corresponds to dark sector type 4 (Shuve & Yavin 2014;Yeo & Cho 2018). The signal process is with a dark photon . This theory can explain the anomalous muon magnetic moment (Shuve & Yavin 2014). If the dark photon mass is less than the masses of the two muons, the dark photon decays into two neutrinos or two dark matter particles. These objects are transformed into missing transverse energy (MET) without a trace on the detector. The simplified model is adopted as the theoretical model in this study (Alves et al. 2012). The model is intermediate to the ultraviolet (UV) model and effective field theory. The UV model includes supersymmetry (SUSY) particles and extra dimensions, whereas the effective field theory includes SM and dark matter particles. The simplified model includes both the SM particles and dark matter particles as well as mediator particles. The simplified model is primarily used when generating signal events. Because several parameters are associated with the signal process, we examined the dependence of the parameters by plotting cross-section graphs.
The most dominant backgrounds correspond to the SM. The mode is . Table 2 presents the settings for the SM event generation. The local Linux machine was adopted. The events were generated using MadGraph5 v2.6.4 with the default parameter card, Pythia8 (Sjöstrand et al. 2015), default Delphes (de Favereau et al. 2014), and MadAnalysis5 (Conte et al. 2013). We generated four muon final states for the SM. The number of events per run was 10,000. The CM energy increased from 50 GeV to 500 GeV by 10 GeV. Events with a CM energy of less than 40 GeV were not generated because of the zero cross-section.
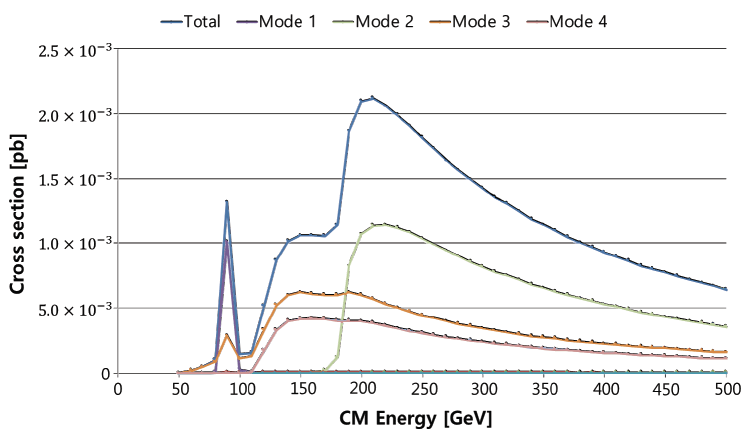
The mediator particles in all the Feynman diagrams were photons or Z bosons. Fig. 2 shows the cross-section of the SM event depending on CM energies. A total of 48 modes are involved in the process.

Fig. 3 shows the dominant modes of the SM. Mode 1 contributed to the first peak that occurred at approximately 90 GeV, attributable to the Z boson interaction. The second peak, which occurred near 210 GeV, corresponded to the maximum cross-section. This peak could be attributed to the presence of two Z bosons as mediator particles.
The signal process was with . When the CM energy was less than 30 GeV, the process of the photon or Z boson interaction was applied, as these interactions are dominant in this CM energy range. Because three parameters are involved in the generation of signal events, we examined the dependence of the cross-section on each parameter sequentially. As shown in Fig. 4, four coupling constants exist in the signal process. The coupling constants are specified in Table 3. A and B correspond to electromagnetic coupling mediated by photon while C and D correspond to the coupling of muon and dark photon, respectively.
The signal events were generated using the settings listed in Table 4. Fig. 5 shows the Feynman diagrams of the signal event. Two processes were considered: (a) with and (b) with . Only process (a) had appeared when the CM energy was less than 30 GeV.
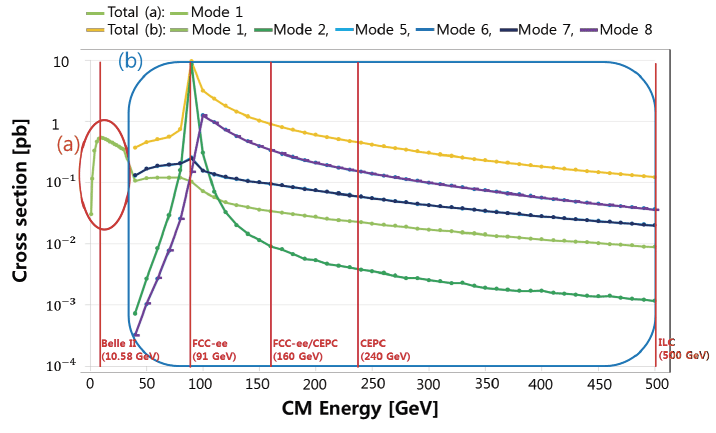
The CM energy increased from 10 GeV to 500 GeV by 10 GeV steps. The dark photon mass was fixed at 0.3 GeV and the coupling constant was 1. At energies less than 30 GeV, process (a) was implemented. As shown in Fig. 6, the crosssection was maximized at the Z boson mass of 90 GeV. The most dominant modes were modes 1 and 8 in processes (a) and (b), respectively. The cross-section of mode 3 and mode 4 is zero. The cross-section of mode 5 and mode 7 are overlayed. Likewise, the cross-section of mode 6 and mode 8 are overlayed.

Fig. 7 shows the cross-section variation with the dark photon mass (my1). The coupling constant was set as 0.1. The dark photon mass was varied from 1 KeV to 100 GeV and the CM energy was fixed at 10.58 GeV, 91 GeV, 160 GeV, 240 GeV, and 500 GeV. For the CM energy of 10.58 GeV and 91 GeV, the cross-section increased as the dark photon mass decreased. For the CM energy of 160 GeV, 240 GeV, and 500 GeV, the peak occurred when the dark photon mass was 50 GeV, 100 GeV, and 250 GeV, respectively. The red circle in the Fig. 7 indicates peaks due to the Z boson interaction.
The coupling constant of the muon and dark photon (gvl22) was varied and the coupling constant of the SM (aEWM1) was used as the default value. As shown in Fig. 8, the coupling constant varied from 0.01 to 1. The cross-section increased as the coupling constant increased.
We also checked the dependence of both CM energy and dark photon mass and the dependence of both dark photon mass and coupling constant.
4. RESULTS
We optimized the simulation tool kit by comparing the time consumed by the CPU for various physics modes. Three cases were considered. The first case is that only the physics simulation was considered. The second case is the full simulation using Pythia8, Delphes, and MadAnalysis5 as well as the physics simulation. The third case is the examination of the efficiency of parallel processing among the machines. Table 5 describes the configuration of three cases: physics simulation only, full simulation, and physics simulation with parallel processing.
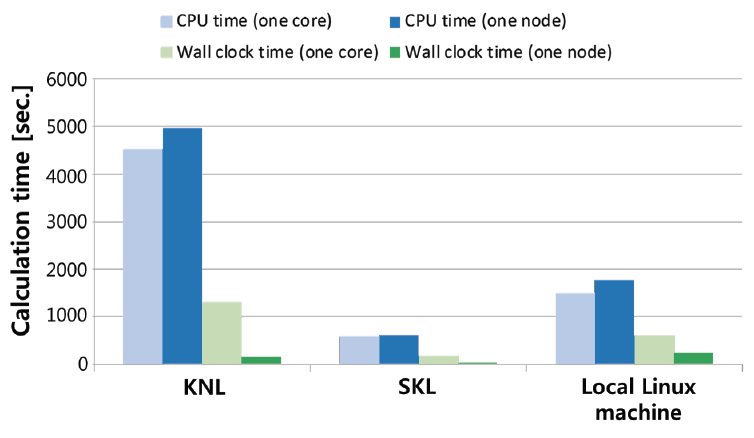
In the first case, events were generated from Feynman diagram using MadGraph5. The number of events was 10,000. The CM energy was 10.58 GeV (7 and 4 GeV for the electron and positron, respectively). 15 jobs were submitted to be performed through parallel processing across all three machines. The coupling constant, gvl22, was 0.1. Fig. 9 shows the results of the CPU time and wall clock time when using the KNL, the SKL, and the local Linux machine. One core was used to determine the CPU time and wall clock time. Moreover, one node (68, 40, and 32 cores for the KNL, the SKL, and the local Linux machine, respectively) was used to determine the wall clock time. The CPU time was found to be greater than the wall clock time for all three machines. Comparing the performance of a single core with physics simulation, it was noted that the CPU of the SKL was faster than that of the KNL and the local Linux machine by a factor of 8.0 and 2.6, respectively. In terms of the wall clock time, the SKL was faster than the KNL and the local Linux machine by a factor of 7.3 and 3.4, respectively. Compared with the one node case, the wall clock time of one node (multiple cores) of the KNL, the SKL, and the local Linux machine was reduced by a factor of 8.6, 4.5, and 2.5, respectively. This result indicates that the efficiency of parallel processing for 15 jobs of the KNL and the SKL was higher than that of the local Linux machine.

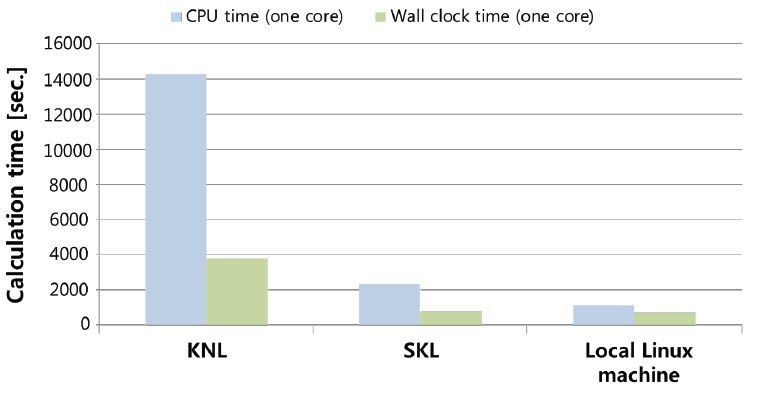
In the second case, Pythia8, Delphes, and MadAnalysis5 software were employed. The number of events was 10,000. The dark photon mass was 0.01 GeV and coupling constant (gvl22) was 0.1. One job with one core was submitted. Fig. 10 shows the CPU time and wall clock time on the KNL, the SKL, and the local Linux machine. In terms of the wall clock time, the local Linux machine was found to be faster than the KNL and the SKL by a factor of 5.3 and 1.0, respectively.

Moreover, in the third case, the efficiencies of parallel processing among machines were examined. The Pythia8, Delphes, and MadAnalysis5 software were not employed in this case. The number of events was 10,000. The used dark photon mass is 0.01 GeV and the coupling constant (gvl22) was 0.1. Fig. 11 shows the CPU time and wall clock time depending on the number of jobs among the machines denoted by (a) and (b) respectively. The higher efficiency of parallel processing corresponded to a smaller slope. In the ideal case, the slope is expected to be zero for the highest efficiency of parallel processing. Fig. 11 (a) indicates that the efficiency of parallel processing with the KNL is lower than that of the SKL and the local Linux machine in terms of CPU time. Fig. 11 (b) indicates that the parallel processing efficiency of the local Linux machine was lower than that of the KNL and the SKL in terms of the wall clock time. The efficiency of parallel processing of the SKL was higher than that of the KNL. This result shows that although the performance of one core of the KNL was lower than that of the local Linux machine, the efficiency of parallel processing with a large number of the KNL cores was higher than that for the local Linux machine. Therefore, optimization and parallelization must be considered.

5. CONCLUSION
We have compared the CPU time using the KISTI-5 supercomputer (the Nurion KNL and the SKL) and the local Linux machine with one or more cores. The results explained the performance of a single core and parallel processing efficiency of the KISTI-5 supercomputer (the Nurion KNL and the SKL). When using a single core, the CPU time, and wall clock time of the SKL were found to be smaller than those of the KNL and the local Linux machine. When using one node (multiple cores), the wall clock time of the KNL, the SKL, and the local Linux machine was reduced compared to that when using one core. Because the performance per core of the KNL was inferior to that of the SKL and the local Linux machine, optimization, and parallelization must be considered with a large number of the KNL cores. The results can help optimize the HEP software using high-performance computing (HPC) and enable the users to implement parallel processing.


