1. INTRODUCTION
During daytime hours, on 21 August 2017, a total solar eclipse with a narrow ~160 km wide dark shadow happened over the United State. During the time period (17:20 UT– 18:47 UT), from Oregon coast to the South Carolina coast, the total solar eclipse was observed (Coster et al. 2017). The 2017 solar eclipse had a distinctive shadow motion that remained supersonic during its transit, beginning with speeds of ~3,600 km/h over Oregon and decelerating to ~2,300 km/ h over South Carolina. Thus, it has been named as the “Great American Eclipse” in the literature to distinguish its rarity.
Besides preventing the visible radiation from the Sun in a 100 km wide band, the eclipse did also partially hide the Sun’s extreme ultraviolet (EUV) radiation over an area of several thousands of kilometers. The last eclipse of similar spectacular characteristics that spread across North America was on 8 June 1918, crossing the U.S. from the Pacific to Atlantic, that is, through a period when World War I was still continuing, much of the ionospheric physics was not established, and the satellite technology had yet not been invented (Huba & Drob 2017).
The ionosphere is the partially ionized plasma environment of Earth’s atmosphere, and it coexists with the much denser thermosphere. Its itemized structure and evolution are dominated by meteorological processes from below and solar and geomagnetic processes from above (Yiğit & Medvedev 2015). Within the ionosphere, there are free electrons and ions produced mostly by photoionization due to solar UV and EUV radiations. In the time of an eclipse event, the direct solar illumination is dropped and thus the photoionization declined, changing the ionospheric structure.
Impacts of the solar eclipse on the ionosphere have been examined for more than 50 years. The great interest arises because the solar eclipse introduced a naturally happening “active” experiment with chances to investigate the influence of solar radiation on the ionosphere-thermosphere- mesosphere (ITM) system (Cohen 1984). The interest of solar eclipse effects is proved obviously by the long list of references and literatures.
The impacts of the solar eclipse on the region of ionosphere have been investigated widely with different measurement techniques (e.g., Evans 1965a, b;Klobuchar & Whitney 1965;Hunter et al. 1974;Oliver & Bowhill 1974;Cohen 1984;Salah et al. 1986;Afraimovich et al. 1998, 2002;Tsai & Liu 1999;Davis et al. 2000, 2001;Farges et al. 2001, 2003).
It has been shown that, the peak electron densities depleted by as much as 20%–35% even in the partial shadow when the ionospheric layers decreased (Bamford 2001).
Recently, considerable progression in observational sensitivity and spatial/temporal resolution of radio-based techniques have provided new and more itemized information on the ITM response to eclipse forcing (Coster et al. 2017). In particular, eclipse investigations for the 2017 event have benefited from the great rise in accuracy and coverage of ground-based monitoring tools, especially Global Navigation Satellite Systems (GNSS). Hairston et al. (2018) investigate the electron temperature on 21 August 2017 eclipse observed by DMSP spacecraft.
This paper shows the response of the ionospheric variations during the occultation of the solar radiation. The research of the effect of the great solar eclipse, occurred in 2017, on the ionosphere is done using available data from Swarm satellite A. The current paper is arranged as follows. In Section 2 we explain the data sets, while section 3 we clarify the observations and discussion. In Section 4 we present the conclusion.
2. DATA SETS
The present study utilizes the Swarm satellite data. This mission, consisting of three identical spacecrafts (A, B, and C), mostly detects the temporal variation of the magnetic field of the Earth with matchless precision (Friis-Christensen et al. 2008).
On 22 November 2013, three spacecrafts were launched one after the other into an almost polar orbit with 87.5° angle of inclination at an initial altitude of ~490 km (Fathy et al. 2019). From that time, two of them (Swarm A and C) fly alongside at an altitude of about 470 km and with a longitudinal separation of about 1.4° (150 km). The third satellite (Swarm B) is higher than Swarm A and C and it swirls the Earth at ~520 km (van den Ijssel et al. 2016). To cover the whole 24 h local time, Swarm B requires about 141 days, while Swarm A and C claim about 133 days. The payload of each spacecraft consists of an absolute scalar magnetometer, a vector field magnetometer, an Electric Field Instrument (EFI), an accelerometer and a group of navigation instruments (Zhou et al. 2016).
In this investigation, we utilize the Swarm Level-2 (L2) TEC (Total Electron Content) data, with the product identifier of SW OPER TECxTMS, where ‘x’ is the satellite identifier (A, B, or C). Elaborated characterizations on the TEC product are given at the following web page: https:// earth.esa.int/documents/10174/1514862/Swarm Level-2 TEC Product Description. The TEC is defined as the total number of electrons integrated along the path from the receiver onboard Swarm to the GPS satellite.
where ne (s) is the electron density. The TEC measured this way is generally termed as the slant total electron content (STEC). The TEC is a measure of ionospheric changes that resulted from the modified satellite signal through free electrons. TEC is measured in units of 1016 electrons meter per square area; where 1016 electrons/m2 = 1 TEC unit (TECU) (Abdullah et al. 2009). The cadence of L2-TEC data is 1 Hz maximally.
The Swarm satellites can supply plasma measurements through the Langmuir Probes (LPs) located on the front of each satellite. An LP sets local characteristics of the plasma, such as electron temperature and density, by measuring the collected current due to electrons and ions.
We complement the TEC data with the calibrated measurements of Swarm LP which is a part of the EFI package, at a 2 Hz sampling rate. It contains plasma density (Ne) from the high-gain LPs and electron temperature (Te) form highand low-gain LPs. We rely on Te data from the high-gain LPs which are more accurate and reliable (Lomidze et al. 2018).
The electron density Ne is the number of free electrons per unit volume in the ionosphere at the Swarm orbit (Fathy & Ghamry 2017).
To reveal signatures of the eclipse event, the Ne, and Te, are the relevant parameters for characterizing the upper ionosphere during the solar eclipse. Because of both Swarm A and C are flying side by side with ~150 km separation in longitude, the data observations from both of them are almost identical. That’s why, we will focus mainly on the observations detected from Swarm A. The behavior of the electron density, STEC and electron temperature from Swarm A on the day of eclipse (21 August 2017) was compared with those of reference days during the same month, to observe the changes that occurred in the ionosphere when the solar radiation was occulted during the eclipse. These reference days were chosen according to two conditions: (1) they have similar geomagnetic activities with the eclipse day; (2) Swarm A satellite was over the United States (geographic latitude between about 35° and 60°N) with similar local time like the eclipse day which was at 1,833–1,844 UT (1,148–1,202 LT). Only two days (23 and 29 August 2017) were met our criteria. On 23 August 2017, Swarm A was over United States from 1,850–1,901 UT (1,138–1,152 LT) but on 29 August 2017, Swarm A was at 1,806–1,816 UT (1,106–1,120 LT) when it traversed United States.
3. OBSERVATIONS AND DISCUSSION
On 21 August 2017, the geomagnetic activity was low. The Kp index was 3 as a maximum, and Dst was -16. On the reference days, the Kp and Dst was relatively low. So, we expect that no variations in the geomagnetic field will affect the observations of any disturbance generated by the eclipse event.
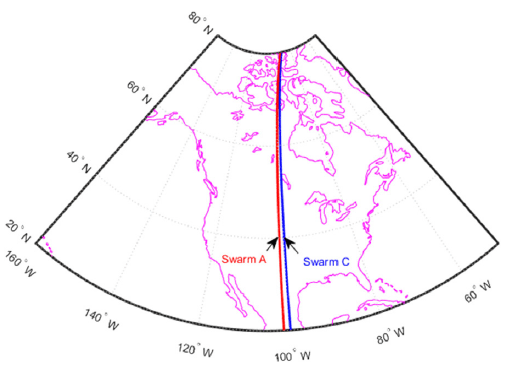
Fig. 1 shows the positions of Swarm satellites A (red color) and C (blue color) during the solar eclipse day. In the time period between ~18:33 UT and ~18:44 UT, both Swarm A and C satellites passed through the United States in a longitudinal orbit.
As mentioned before, our observations investigate the electron density, STEC and electron temperature during the eclipse day. A comparison of these data with another two reference days, without an eclipse, is introduced. This allows us to investigate the impact of the eclipse on the ionosphere using Swarm A satellite.
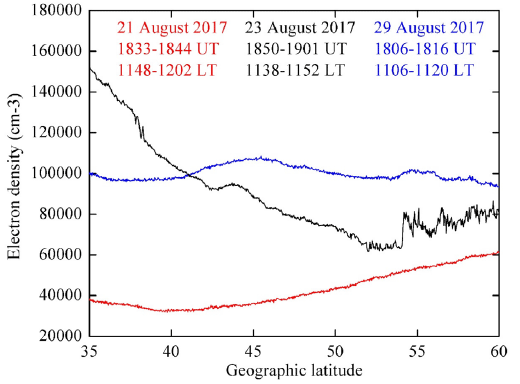
Fig. 2 presents the electron density of satellites A as a function of geographic latitude. The red color represents the electron density measured on 21 August 2017; black color shows the electron density measured on 23 August 2017; blue color displays the electron density measured on 29 August 2017. It is evident that the electron density measured on 21 August 2017 (eclipse day) is lower than other two days.

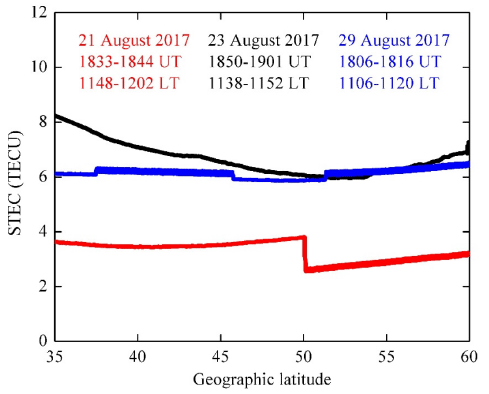
Fig. 3 shows the comparison of the observed STEC during the 2017 solar eclipse day with those of the reference days. The STEC during the eclipse day is found to be around 3–4 TECU as compared to value of 6–8 TECU during 23 and 29 August.

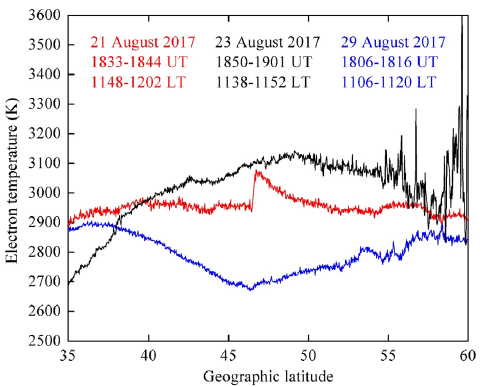
The electron temperature, from high-gain mode, during the solar eclipse day compared with the reference days is shown in Fig. 4 for the geographic latitude of ~35°N–~60°N (inside the eclipse shadow). On the eclipse day electron temperature was found to be in the range of 2,900–2,950 K with an abrupt increase (up to ~3,078 K) between 46.42° and 46.75° latitude. Then, it begins to decrease gradually till it reaches its normal value.

The previous discussion described the observations of the solar eclipse on the electron density, STEC and electron temperature. Firstly, the electron density and STEC have lower value throughout the eclipse than the reference days. This could be due to dominance of dissociative recombination over photoionization caused by the reduction of ionizing EUV radiation during the eclipse time (Schunk & Nagy 2000).
In addition to the noticeable response of electron density and STEC, electron temperature also has a considerable response to solar eclipses arising from the decrease in photoelectron heating related with the reduction in photoionization. The reduction of photoelectron heating during the eclipse diminishes the temperature of the ionosphere, which leads to a cooling of the plasma along the entire field line due to the large electron thermal conductivity along the field line (Huba & Drob 2017). The depletion in electron temperature in ionosphere, during the 3rd of October 2005 total solar eclipse, was investigated by Le et al. (2009). Between 41° and 57° latitude, Fig. 4 shows that the electron temperature of the eclipse day is lower than that of 23 August 2017 but higher than that of 29 August 2017. In the same time, the electron temperature of the eclipse day seems to be stable around 2,900–2,950 K at all latitudes but the reference days have not this stability. During the eclipse day, we worth noting that there is an abrupt temperature increase between 46.42° and 46.75° latitude which also observed by the low-gain mode (not shown); and there is an abrupt decrease of the STEC at ~50° latitude. We do not have any interpretation to explain the reason for these abrupt changes in both Te and STEC. The lowering in electron density and temperature is in agreement with recent studies using different models, GNSS observations data (Coster et al. 2017;Huba & Drob 2017;Cherniak & Zakharenkova 2018;Pradipta et al. 2018). Between 41° and 57° latitude in, Fig. 4, the main of maximum values of Te in 23 December is about 3,100 K but the main value of the eclipse day, except the abrupt change, is ~1,950 K.
4. CONCLUSION
Using data from Swarm satellite A, we studied the impact of the great 2017 eclipse, which traveled across North American, on the ionosphere. The data of STEC as well as the calibrated measurements of electron density and electron temperature measured by the Swarm satellite was introduced through the time of the solar eclipse. The comparison of the data measured in the solar eclipse day with other two days, similar in the geomagnetic activities and local time, reveals a noticeable effect on the measured electron density, STEC and electron temperature. Through the time of the solar eclipse a decreasing in both the electron density and the STEC is found compared with the reference days. Furthermore, the solar eclipse affects the electron temperature to drop about ~150 K by comparing it with 23 December between 41° and 57° latitude.
