1. INTRODUCTION
The light variability of UY UMa (2MASS J13443683 + 5513184, NSVS 2684105, SVS 359, UCAC4 727-048578) was discovered by S. Beljawsky in 1933 on a Simeiz plate (Guthnick & Prager 1934). In the same year, M. Zverev correctly classified it as an W UMa eclipsing binary and determined its light elements (Min.I = HJD 2427307.49 + 0d.37785E; Guthnick & Prager 1934). Guthnick & Prager (1934) gave the photographic maximum and minimum magnitudes of the system as 11m.5 and 12m.0, respectively. Subsequently, the system was neglected for over 60 years until the first CCD BV photometric observations were made and analyzed by Yang et al. (2001, hereafter, YLL). YLL presented the BV light curves, showing partial eclipses at both eclipses and an O’Connell effect with Max. I approximately 0m.03 brighter than Max. II. Through their light curve analysis, YLL found that UY UMa is a W-subtype contact binary with an extremely small mass ratio of q = 0.134, a low inclination of 73˚.4, a large temperature difference of ΔT = 414˚, and a small fill-out factor of f = 0.053. The O’Connell effect in the light curves was explained by a cool spot model on the more massive component. In addition, by using sixteen photoelectric times of minimum light with a time-span of only four years from 1995 to 1999, available to them at that time, they showed that the orbital period of UY UMa seems to be constant during the four-year time span. Recently, a period study of the system was made by Yu et al. (2017) who analyzed a total of 76 times of minimum light available to them. They suggested that the orbital period has varied in a cyclical variation with a period of 14y.26 and a semi-amplitude of 0d.0026, which is superposed on a secularly increasing period at a rate of d/yr. They interpreted that the secular increase in period was caused by mass transfer from the less massive to the more massive star, while the cyclical change in period could be caused by either magnetic activities of the components or a light time effect (LITE) due to an unseen tertiary body. Unfortunately, YLL and Yu et al. did not include earlier photographic timings given by S. Beljawsky and M. Zverev (Kreiner et al. 2001), with which one would see more clearly the long-term behavior of the secular period change of the system. No radial velocity curves were available, although numerous eclipse timings have been reported. Because there are no further studies of UY UMa since the studies of YLL and Yu et al., we included UY UMa in our observing programs of close binary stars with a view to confirming and/or improving the photometric results of YLL and Yu et al.
In this paper we present new CCD BVRI light curves of UY UMa with a long duration of totality at the secondary eclipse, which are totally different from YLL’s light curves, thus, give quite different astrophysical parameters from those of YLL. Based on all available times of minimum light with a timespan longer than Yu et al., which include earlier timings as well as new ones, we also present a period study which gives a new dynamical picture of the system. Finally, based on our photometric results, we discuss the evolutionary status of UY UMa together with other overcontact binaries similar to UY UMa.
2. OBSERVATION AND NEW LIGHT CURVES
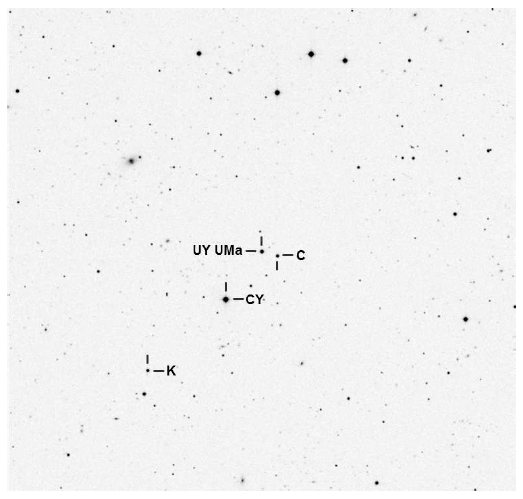
New BVRI observations of UY UMa were made on nine nights during February and March, 2008 with the 1.0-m reflector at the Mt. Lemmon Optical Astronomy Observatory (LOAO) in Arizona, USA. Since its establishment in 2003, the telescope has been remotely controlled at the Korea Astronomy and Space Science Institute (KASI) in Korea. An FLI IMG4301E CCD camera with a 22′.5 × 22′.5 field of view was electronically cooled during the observations. The standard BVRI filters were used. Each of the frames was 2 × 2 binned and differently exposed from 20 s to 30 s, suitable to UY UMa, according to the filters used and weather conditions of each night. UCAC4 727-048577 and UCAC4 726-049111 were chosen as the comparison and check stars, respectively. Our comparison star is the star used as a check star by YLL. Fig. 1 shows a finding chart of UY UMa with the comparison (marked as ‘C’) and check (‘K’) stars. The star (GSC 3854-0013, UCAC4 726-049104) marked as ‘CY’ in the figure was YLL’s comparison star, which is approximately seven and sixteen times brighter in yellow bandpass than UY UMa at the 0.25 phase and our comparison (and also check) star, respectively. Therefore, during our observations, the images taken in all bandpasses for the comparison star of YLL were always saturated at the camera exposure times of UY UMa. Table 1 lists the information on the coordinates, magnitudes, and color indices of the variable, comparison, and check stars.
The IRAF S/W package (Tody 1986) was used to reduce all measured frames with the conventional corrections of bias, dark, and flat-field. More details of our data reduction were described by Jeong & Kim (2013) and Kim et al. (2014). The resultant standard errors of our observations were approximately ±0m.011 in blue, ±0m.020 in yellow, and ±0m.015 in red, and ±0m.020 in infrared. A total of 2,976 individual observations were obtained in four colors (727 in blue, 761 in yellow, 782 in red, and 706 in infrared). Table 2 lists a sample of our measurements.
In addition to these observations, the R observations only for the determinations of times of minima were made for eight nights in 2009 at the LOAO and for one night in 2015 with an FLI 4K CCD camera attached to the 61-cm reflector at the Sobaeksan Optical Astronomy Observatory (SOAO) of the KASI in Korea. The instrumentation used and the reduction process for the LOAO observations are the same as those for the 2008 observations described above and the detail of the SOAO observations is well described in the paper of Kim et al. (2017).
To phase our light curves, a linear least squares fit to 30 recent times of minima was made to yield the ephemeris:
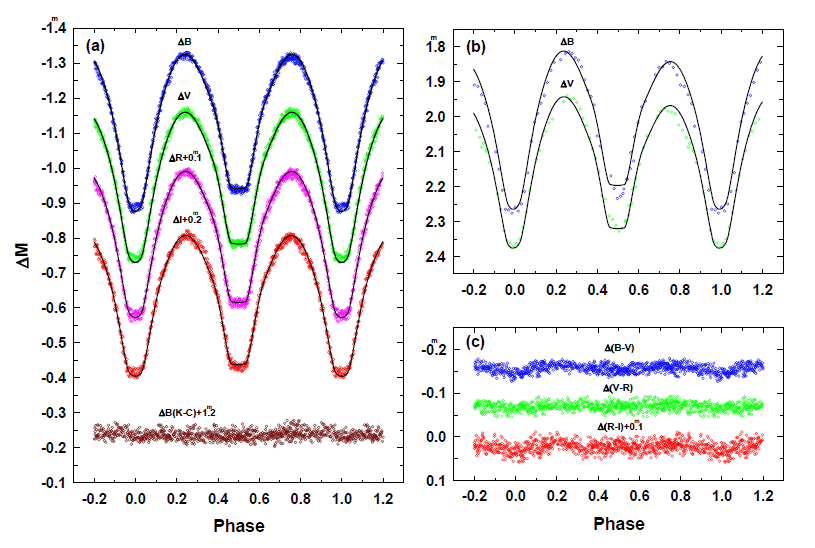
where the parenthesized figures give the standard errors of the last digit of each parameter. Fig. 2(a) shows the new BVRI light curves including the first RI ones. For comparison of our light curves with those of YLL, YLL’s BV light curves were also drawn in Fig. 2(b). The differential color curves of B – V, V – R, and R – I were calculated from our filtered light curves and shown in Fig. 2(c). In addition, the differential magnitudes at four characteristic phases and eclipse-depth information are listed in Table 3.

|
As seen in Fig. 2(a) and 2(b), our light curves are quite different from those of YLL in three ways: 1) The light curves of YLL show strong asymmetries, the so-called O’Connell effect (the light level at phase 0.25 is higher than that at phase 0.75; O’Connell 1951), while ours are nearly symmetrical, showing no O’Connell effect. Such light changes are typical to W UMa-type binary stars and have been usually interpreted as results of stellar activities such as cool or hot starspot(s) and their time variations. 2) Our light curves clearly have a flat-bottom at the secondary eclipse with a mean duration of approximately 43 min corresponding to an approximate 0.085 phase interval, while YLL’s do not show any evidence of total eclipse at secondary eclipse. Initially, we were surprised at the morphological disagreement between two sets of light curves because our light curves indicate that UY UMa belongs to the A-subtype group of W UMa binaries rather than the W-subtype suggested by YLL, according to the criteria introduced by Binnendijk (1970). 3) Our light curves are approximately twelve times more dense in measurements than those of YLL; each of our light curves has over 85 measurements during the total eclipse at the secondary eclipse while each of YLL’s blue and yellow light curves has only seven points for the same eclipse.
The apparent disagreement between our light curves and those of YLL may suggest that UY UMa had intrinsically changed from the W-subtype to the A-subtype or the photometry of YLL was not of adequate quality. The latter rather than the former may be the cause of the disagreement based on the reasoning as follows: 1) The comparison star used by YLL, seven times brighter in the V bandpass than UY UMa, is not properly chosen. 2) The measurements defining YLL’s light curves are not sufficiently dense to distinguish the total eclipse at the secondary eclipse. A similar situation can also be found in the observational history of the A-subtype contact binary, V432 Per (see the papers of Yang & Liu 2002;Lee et al. 2008, Odell et al. 2009).
3. LIGHT CURVE SYNTHESIS
As previously noted, our BVRI light curves show a total occultation eclipse at secondary minimum, implying that UY UMa is an A-subtype W UMa contact binary. Simultaneous analysis of the multi-band light curves was made to obtain a unique solution with the 2003 version of the Wilson-Devinney (WD) differential corrections computer code (Wilson & Devinney 1971;Wilson 1979, 1990;van Hamme & Wilson 2003) which is available from ftp://ftp.astro.ufl.edu/pub/wilson/. To explain the total eclipse at the secondary minimum, the primary star (star 1) of UY UMa should be hotter, larger, and more massive than the secondary companion (star 2) and is being eclipsed at primary eclipse. The effective temperature of the primary star (T1) is adopted as 5,900 K, corresponding to the (B – V) color index of 0.61 at phase 0.25 given by YLL (see also Drilling & Landolt 2000).
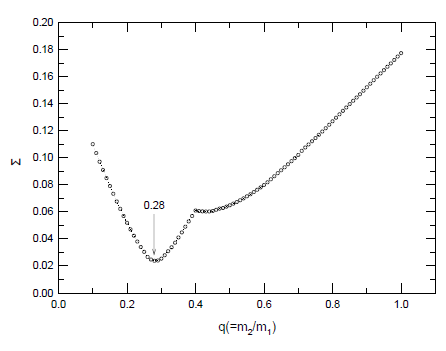
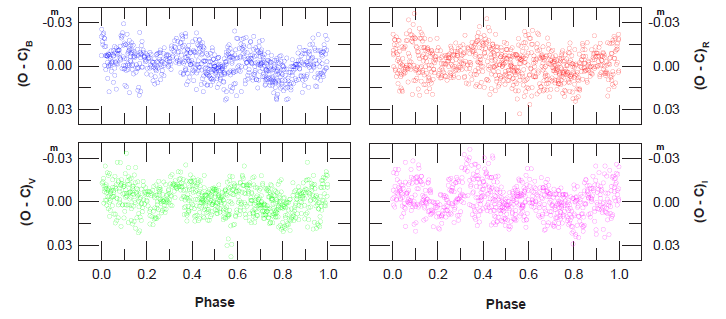
The temperature was fixed in our q-search procedure to deduce a most probable mass ratio q (= m2/m1) of UY UMa. The q-search without any surface perturbations such as any spot (s) or a third light (l3) was intensively made for a series of models with the mass ratios varying from 0.1 to 1.0 at intervals of 0.01. In these searches, the gravity darkening exponents and bolometric albedos were set to 0.32 and 0.5 for both components, respectively, because both component stars are cool and are assumed to have convective envelopes. Logarithmic limb-darkening (LD) coefficients and bolometric LD coefficients for the primary and secondary stars were computed at each iteration from the LD tables given by Van Hamme (1993). The options of synchronous rotation and model atmosphere (Kurucz 1993) in the WD program were also adopted. All observations in each of the BVRI bandpasses were weighted equally. The adjustable parameters were the phase shift (ϕ), the orbital inclination (i), the effective temperature of the cooler component (T2), the surface equipotential of both components (Ω = Ω1 = Ω2), and the luminosity of the hotter primary component (l1) in each of the bandpasses. The WD mode 3 for a contact system was adopted to adjust the parameters of UY UMa. Each of the fits converged rapidly. The result of our q search is shown in Fig. 3, where the abscissa is the mass ratio q and the ordinate is the weighted sum of squared residuals (ΣW (O – C)2; hereafter, Σ). A global minimum of Σ occurred at q = 0.28, as indicated by the arrow in Fig. 3. At this point a third light was considered and adjusted with the other parameters above including the mass ratio. In this procedure, the method of multiple subsets (Wilson & Biermann 1976) was used to enhance the stability of the fit. The final solution is listed in Table 4, together with the YLL’s solution for comparison. The BVRI residuals of the observations from our solution are shown in Fig. 4. The theoretical light curves calculated with our solution are drawn as solid curves in Fig. 2(a). The solid curves in Fig. 2(b) represent the theoretical light curves calculated with our solution plus the spot parameters of YLL. As shown in Figs. 2 and 4, our solution shows a fairly good representation of the observed multiband light curves within the observational errors.
As listed in Table 4, our solution is quite different in many respects from the one suggested by YLL. Our solution shows that UY UMa is an A-subtype over-contact binary with an extreme mass ratio of q = 0.21, a high inclination of 81˚.4, a small temperature difference of ΔT = 18˚, a large fill-out factor of f = 0.61, and a large third light amounting to approximately 10% of the total systemic light in the B bandpass. On the contrary, YLL’s solution indicates that UY UMa is a W-subtype contact binary with an extremely small mass ratio of q = 0.134, a low inclination of 73˚.4, a large temperature difference of ΔT = 414˚, and a very small fill-out factor of f = 0.053. We believe that the serious disagreement between our solution and that of YLL may be due to their analysis of the light curves obtained from YLL’s inadequate photometry rather than the real dramatic changes of the system parameters of UY UMa. Based on our photometric solution of UY UMa, the Roche geometry at phase 0.75 is shown in Fig. 5.
Since the radial velocity curve of UY UMa is not yet available, it is not possible to directly determine the absolute parameters of the binary system. However, it is well known that the mass ratio obtained from light curve syntheses is very reliable only for eclipsing systems with total eclipse such as in the case of UY UMa (Terrell & Wilson 2005;Hambalek & Pribulla 2013;Şenavci et al. 2016). Thanks to this fact, we further pursued the absolute physical parameters of UY UMa by using the adopted light-curve parameters in Table 4 and some well-established relations, as described in detail in Kim et al. (2014).
The absolute dimensions and radiative parameters with their uncertainties were listed in Table 5 where the wellknown calibrations (Flower 1996;Torres et al. 2010) were used to obtain the intrinsic color indices and bolometric corrections for the primary and secondary components and the distance was estimated with the assumption of no interstellar absorption. Our distance matches well with GAIA’s distance within the estimated error.
4. PERIOD STUDY
From our observations, seventeen times of minimum light were determined by the Kwee & van Woerden (1956) method. These appear in Table 6, together with all those that have been published since the early seven photographic timings were given by S. Beljawsky and M. Zverev (Kreiner et al. 2001). As listed in Table 6, a total of 94 times of minimum light (7 photographic, and 87 photoelectric & CCD) have been collected from a modern database (so called TIDAK; Kim et al. 2018) and recent literature.
To investigate the period variability of UY UMa, an eclipse timing diagram (ETD, traditionally called as an (O – C) diagram) of the system was produced with the minima in Table 6 by using YLL’s light elements:
The upper panel in Fig. 6 shows the ETD of UY UMa where each of the timings was differentiated with different symbols according to the eclipse type and measurement methods. The O – C1 residuals in the diagram, as listed in the 4th column of Table 6, reveal that the photoelectric and CCD residuals have varied in a secular period increase, which can be usually modeled in a quadratic ephemeris. In their period study, Yu et al. (2017) analyzed only the photoelectric and CCD minima available to them and derived a quadratic ephemeris:
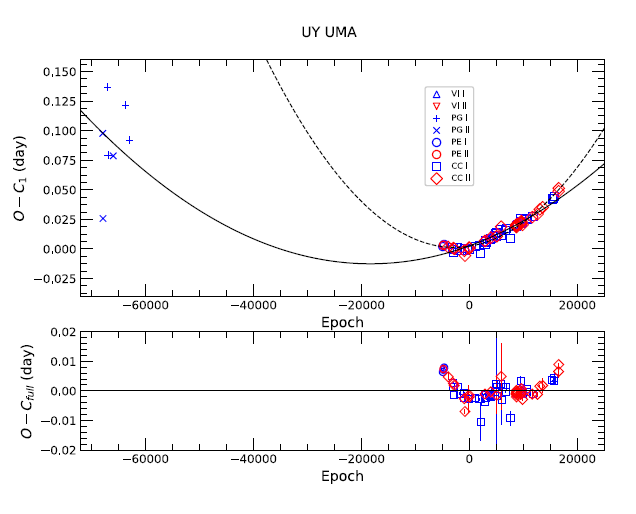
where the values in the brackets denote the standard errors of the last digit(s). Eq. (3) was drawn as the dashed curve in Fig. 6. Yu et al. (2017) excluded the earlier photographic timings in their analysis mainly because a large scatter of approximately 0d.11 in the relatively short time interval cannot reflect any real effects in the system. However, as seen in the figure, it is obvious that the earlier timings cannot be ignored in the period study of UY UMa from the point of view that the dashed curve does not match them at all. Thus, although there is a large time gap of approximately 60 yrs between the last of the earlier photographic timings and the first photoelectric one, a least-squares fit for all the O – C1 residuals, including the earlier timings, was made to the quadratic ephemeris in the form of O – C1 = ΔT + ΔP + AE2. The resultant ephemeris was derived as follows:
The solid line in Fig. 6 represents Eq. (4), which fits well not only for the earlier timings data but also for the recent ones overall. It is very impressive to note that the coefficient of the quadratic term of Eq. (3) is approximately three times larger than that of Eq. (4). Our calculation tells us that the earlier non-photoelectric and non-CCD minima even with large observational scatters can be valuably used in constraining the size of a secular period change and thus cannot be neglected in any period studies of eclipsing binary stars, if the minima provide a longer time base in a timing history of a given eclipsing binary star.
The lower panel of Fig. 6 plots the photoelectric and CCD residuals with their error bars from Eq. (4) where the residuals without error bars have no published errors. As shown in the diagram, the photoelectric and CCD residuals clearly show some variations beyond their timing errors. To look into the details of the variations a period search (Scargle 1982) was performed with the photoelectric and CCD residuals. The six timings (2450152.3668, 2450944.4471, 2452041.4825, 2453151.5066, 2453464.5473, and 2454115.6130) were not included in the period search and the subsequent period analysis, because their residuals show unreasonably large deviations compared with neighboring ones. Each of these discarded timings is marked by an asterisk in column (8) of Table 6. Fig. 7 shows the resultant power spectra in which the two highest peaks at the periods of 10.7 yr and 23.6 yr are notably conspicuous. The longer period of 23.6 yr may not be real because it is comparable to the time-span of the times of minima except the earlier photographic ones. Nonetheless, an attempt to investigate the possible causes of the two suggested periods was made by assuming that the O – C1 variations are due to combined LITEs caused by two additional bodies in the system. Thus all the O – C1 residuals were fitted to the following ephemeris:
where τ3 and τ4 are the LITEs due to the hypothetical 3rd and 4th bodies, respectively. The parametric and differential forms of the orbital elements of a given light-time orbit were adopted from Irwin (1952, 1959). Iterative least-squares fits of the (O – C)1 residuals to Eq. (5) were made with the Levenberg-Marquardt method (Press et al. 1992), which was frequently used in the period studies of some other stars (Kim et al. 2005, 2014, 2018). In the calculations, each of timings was given a weight equal to an inverse value of each of their published (see Table 6) or assigned errors. For the photographic and CCD minima with no published errors, the error for the former minima was given as 0d.06 based on their scatters and for the latter ones 0d.0019, the average value of the published errors of the photoelectric and CCD minima. The calculations converged quickly to yield the solution listed in Table 7 wherein the parenthesized entries give the standard deviations of the tabulated quantities. The O – C1 residuals were again plotted in the top of Fig. 8 where the solid and dashed curves represent the full and quadratic terms in Eq. (5) and Table 7, respectively. In the 2nd and 3rd parts of the figure the contributions to light times by the third and fourth bodies are plotted, respectively. At the bottom of the figure, the (O – C)full residuals from the full ephemeris of Eq. (5), which appear in the fifth column of Table 6, are plotted. As shown in Fig. 8, the residuals from the observed times of minimum light follow the theoretical light time curves due to the assumed third and fourth bodies very well. As listed in Table 7, the semi-amplitude, orbital period, and eccentricity for the light time orbit of the mass center of the eclipsing pair due to the third and fourth bodies are (0d.0026, 12y.02, and 0.448) and (0d.0083, 46y 27, and 0.449), respectively. Interestingly, the eccentricity of the third body is practically the same as that of the fourth one. In addition, the minimum masses corresponding to the third and fourth bodies are calculated to be M3 = 0.11 M⊙ and M4 = 0.16 M⊙, respectively. Furthermore, it is noticed that there may exist a commensurable relation between the orbital periods: 77P3 = 20P4.
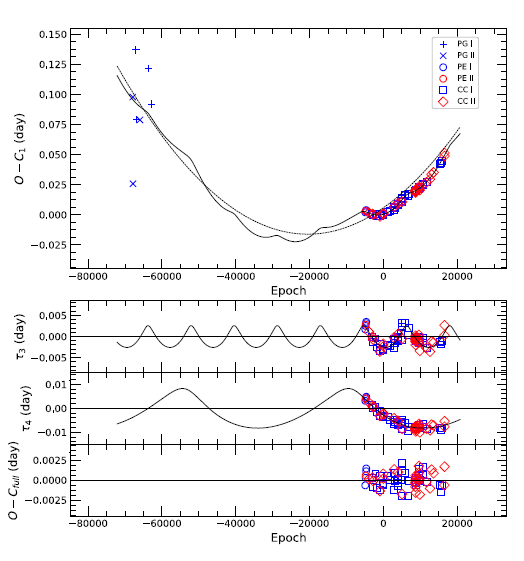
The parabolic component of the period change of UY UMa gives the secular period increase rate of 1.02(60) × 10–8 d/yr, implying the secular mass transfer rate of almost 2.68(26) × 10–8M⊙/yr from the less massive to the more massive star if the mass and angular momentum of the system are conserved.
5. CONCLUSIONS
In general, there are two competing theories that explain why the orbital period of an eclipsing binary system changes regularly: one is the LITE by a third object, and the other is the Applegate model (Applegate 1992). The latter explains that the cyclic change is caused by the gravitational coupling of the orbit to variation in the shape of a magnetically active component. This model requires changes in the luminosity and differential rotation of the active star at the levels of ΔL/L ≃ 0.1 and ΔΩ/Ω ≃ 0.01, respectively. Thus, the two cyclical changes found in the UY UMa system may be caused by one of three possible mechanisms: (a) LITEs due to two additional objects, as discussed in the previous section, (b) Applegate models operating simultaneously on two magnetic active components, or (c) the combination of the LITE due to a third object and the Applegate model working on a magnetically active component. For UY UMa the (b) option seems unlikely because of the thin convective zone of the small star, which is supported by Mullan’s (1975) conclusion that there should be dark spots preferentially on the more massive components of W UMa-type contact binary systems. We calculated the Applegate model parameters, as listed in Table 8, under the assumption that the two cyclical changes are caused by the more massive components. In the calculation, the mass of the convective shell is assumed to be 10% of the stellar mass. The rms luminosity changes (ΔLrms) converted to magnitude scale in Table 8 were obtained with Eq. (4) in the paper of Kim et al. (1997). As listed in Table 8, the Applegate model parameters, especially ΔL/L and ΔΩ/Ω, for the two period modulations are one or two orders of magnitude less than the nominal ones suggested by Applegate (1992), indicating that the Applegate mechanism does not work in the UY UMa system.
Thus, we concluded that two periodic changes were most likely caused by LITEs due to two outer objects orbiting the eclipsing pair. In this case, the minimum masses of the third and fourth bodies are calculated to be 0.11 M⊙ and 0.16 M⊙, respectively. Our hypothesis of circumbinary objects may be supported by the third lights detected in our light curve synthesis. As shown in Table 4, the additional bodies seems to emit more energy in shorter wavelengths. This indicates that at least one of them may be an early-type star.
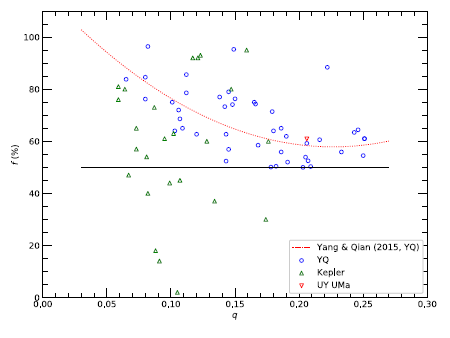
Recently, Yang & Qian (2015 ; hereafter YQ) made a statistical analysis of 45 deep, low mass ratio (DLMR) overcontact binaries of which the mass ratio and the fill-out factor are less than 0.25 and larger than 50%, respectively. They found some statistical relationships among the various physical parameters: q vs. f, q vs. Jspin/Jorb, log (M/M⊙) vs. log (L/L⊙), and log (M/M⊙) vs. log (R/R⊙) where q, f, Jspin, Jorb, M, L, and R represent mass ratio, fill-out factor, spin angular momentum, orbital angular momentum, mass, luminosity, and radius, respectively. After their study, Şenavci et al. (2016) studied 25 Kepler eclipsing binaries of W UMa-type showing total eclipses and presented their precise orbital solutions as well as their absolute dimensions. The derived mass ratios of all Kepler binaries are less than 0.18 and 15 out of 25 systems have fill-out factors larger than 50%.
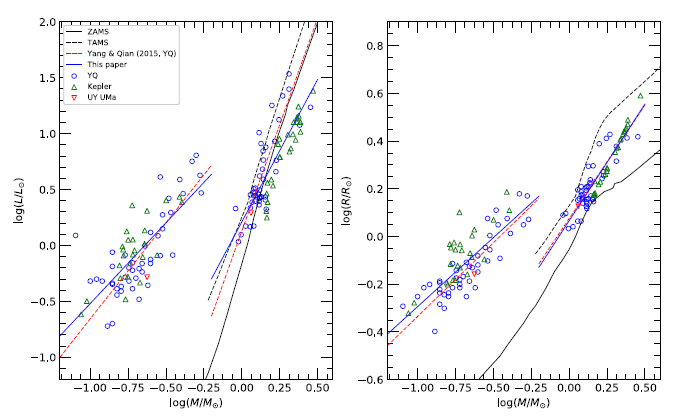
We investigated the statistical relations found by YQ by using the physical parameters of UY UMa and the Kepler overcontact binaries. The relations of q – f, q – Jspin/Jorb, log(M/M⊙) – log(L/L⊙), and log(M/M⊙) – log(R/R⊙) are shown from Figs. 9-11, respectively. The dotted lines in red in all figures denote the relations given by YQ. The solid lines in blue are derived by us. Fig. 9 shows the diagram of q – f in which the black line represents f = 50%. In the diagram, we see that the Kepler overcontact binaries show large deviations from the YQ equation (f (%) = 117.6 – 527.6 × q + 1164.9 × q2), indicating that the YQ relationship between q and f is very weak and thus the YQ’s minimum mass ratio of qmin = 0.44 derived from the relation may deviate somewhat from the actual value.
To investigate the relation of q – Jspin/Jorb, we calculated Jspin/Jorb with the equation given by YQ and Li & Zhang (2006) as follows:
where r1,2 and k1,2 are the relative and gyration radii for both components, respectively. We adopted = 0.05, which is the value used by YQ. In equation (3) of the YQ paper, it is pointed out that q/(1 + q) is a typo error of (1 + q)/q. The top panel of Fig. 10 shows the relation of q – Jspin/Jorb and the dotted curve represents the YQ relation (Jspin/Jorb = 0.5104 – 3.7738 × q + 8.2817 × q2). The dotted horizontal line represents Jspin/Jorb = 1/3, at which a tidal instability called Darwin instability (Darwin 1879;Hut 1980) starts. In the middle panel, the residuals from the YQ relation are plotted and show a quasi-sinusoidal pattern, indicating that the YQ equation does not represent Jspin/Jorb = well as a function of q. It has been well known that Jspin/Jorb = of W UMa-type contact binaries is strongly correlated with the mass ratio q, but a direct polynomial relation between them is difficult to obtain (Li & Zhang 2006). To obtain a good expression of the relationship between q and Jspin/Jorb, we adopted a new equation as follows,
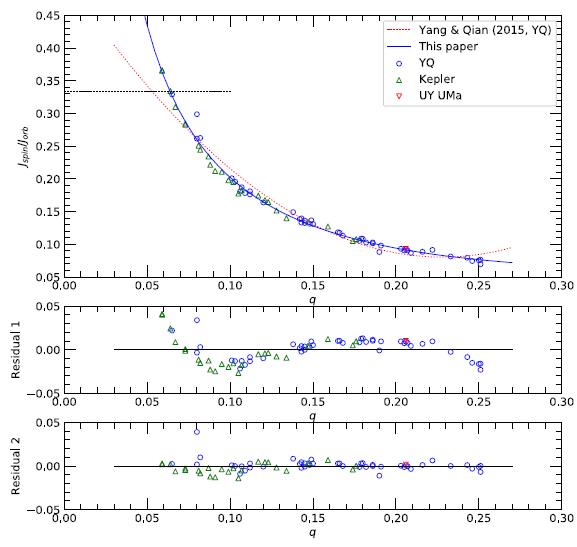
An iterative least-squares method was used to fit the data set of q and Jspin/Jorb to the above equation. The result is a0 = 0.0236 (± 0.0006), a1 = –0.0651 (± 0.0094), and a2 = 0.127 (± 0.034). The solid curve in the top panel represents Eq. (7) with the derived coefficients and gives a satisfactory fit to the observed systems which is also evidenced by the residuals from Eq. (7) in the bottom panel. In addition, we numerically solved Eq. (7) for q by setting Jspin/Jorb = 1/3 and obtained a minimum mass ratio of qmin = 0.064 for the observed systems, which is larger than YQ’s value of 0.053 but smaller than approximately 0.076 – 0.078 of Li & Zhang (2006).
Finally, the mass-luminosity (M – L) and mass-radius (M – R) diagrams in log scale are shown in the left and right panels of Fig. 11, respectively. In the diagrams, the zero age main-sequence (ZAMS) and terminal age main-sequence (TAMS) taken from the Padova stellar evolution model with solar abundance (Girardi et al. 2000), are drawn as the solid and dotted lines in black, respectively. In addition, the dotted lines in red and blue are drawn with the linear relations determined by YQ and the authors, respectively. For comparison, we listed the coefficients of the linear equations of log (L/L⊙) and log (R/R⊙) as functions of log (M/M⊙) in Table 9. In the M – L and M – R diagrams, the primary star of UY UMa occupies the middle position of the main sequence band, and the secondary star is at the bottom of the subgiant zone. However, in the M – L diagram, the primary components of the Kepler binary stars are mostly below ZAMS and most of the secondary components are located in the upper part of the subgiant region. Moreover, in the M – R diagram, the primary stars are aligned along the middle down the main sequence band while most secondary stars are in the upper part of the subgiant region.

|
In this paper, we presented and analyzed new BVRI CCD light curves of UY UMa, including the first red and infrared observations. No O’Connell effect was found in our light curves with a long-duration totality (approximately 43m) at secondary eclipse. The physical parameters derived from the light curve synthesis are totally different from ones suggested by Yang et al. (2001): UY UMa is an A-subtype over-contact binary with a low mass ratio of q = 0.21, a high inclination of 81˚.4, a small temperature difference of ΔT = 18˚, a large fill-out factor of f = 0.61, and a third light of approximately 10% of the total systemic light. The absolute dimensions of the system were determined as follows: M1 = 1.15 M⊙, M2 = 0.24 M⊙, R1 = 1.34 R⊙, R2 = 0.70 R⊙, L1 = 1.95 L⊙, and L2 = 0.52 L⊙. The ETD based on all available times of minima, including our seventeen new timings, shows that the orbital period of UY UMa has experienced complex variation for 60y since 1929y. The variations in the orbital period were decoupled into two cyclically varying terms with periods of 12y.0 and 46y.3 and a secularly increasing term with the rate of 1.02(60) × 10–8 d/yr. The latter may be interpreted to be due to a conservative mass transfer of 2.68 × 10⁻⁸M⊙/yr from the secondary component to the primary one. Two competing theories (LITE and Applegate model) as the possible causes of two cyclical changes of period were tested. The Applegate mechanism may not work in the UY UMa system because the Applegate model parameters, especially ΔL/L and ΔΩ/Ω, for the two period modulations are one or two of magnitude less than the nominal ones suggested by Applegate (1992). However, the third lights detected in our light curve synthesis may support the LITEs due to two outer objects. Currently, we have concluded that the two periodic changes were most likely caused by LITEs due to two circumbinary objects orbiting the eclipsing pair. The calculated minimum masses of the third and fourth bodies are 0.11 M⊙ and 0.16 M⊙, respectively, which seem to emit more energy in shorter wavelengths. Finally, YQ’s statistical relations among the physical parameters of 45 DLMR contact binaries were revisited by using the physical parameters of UY UMa and 25 Kepler contact binaries provided by Şenavci et al. (2016). The minimum mass ratio was newly determined as qmin = 0.064 by using a new equation describing Jspin/Jorb as a function of q. In addition, the evolutionary status of UY UMA and 25 Kepler contact binaries based on the M – L and M – R diagrams shows that both components of UY UMa occupy positions in the diagrams similar to other DLMR stars, although Kepler stars are located differently from the positions occupied by other DLMR stars.


