1. INTRODUCTION
The Earth’s high latitude region is more vulnerable to varying solar wind conditions. During storm-time conditions, the inner boundary of the auroral region expands (contracts) equatorward (polewards), depending on the orientation of the interplanetary magnetic field (IMF) BZ. The expansion is likely to follow the high activities of the solar wind input during the geomagnetic storm main phase, associated with southward IMF BZ and retreats polewards during the recovery phase, corresponding to northward turning of IMF BZ.
Storm time disturbance (Dst) index is used to quantify the strength of ring current intensity and so, the geomagnetic storm energy (Lundstedt et al. 2002, and references therein). The equatorward expansion and poleward retreat of field-aligned currents (FACs) during geomagnetic storm, under southward and northward IMF BZ conditions, has been studied by a good number of researchers (Iijima and Potemra 1976;Bythrow et al. 1984;Meng 1984;Fujii et al. 1992;Anderson et al. 2002;Wang et al. 2006).
Using Triad satellite magnetometer recordings (Iijima & Potemra 1976) statistically determined the location of the FACs. Their results revealed a close dependence of FACs on geomagnetic conditions and substorm occurrence (Iijima & Potemra 1978). Studies have also shown the existence of a strong correlation among interplanetary parameters and the total current carried by the region 1 (R1) and region 2 (R2) current systems. Similarity in behaviour between the poleward and equatorward boundaries of FACs and that of the electron precipitation boundaries was observed (Bythrow et al. 1984;Iijima et al. 1984, and references therein).
Bythrow et al. (1984) determined the response of the auroral FAC equatorward and poleward boundaries to the variation of the IMF from MAGSAT vector magnetometer data. The study revealed the equatorward expansion of R1 and R2 current systems are prevalent during the periods of southward IMF BZ. While for IMF BZ > 0, R1 and R2 currents continued to flow with greatly reduced amplitude in the presence of extensive small-scale structure. According to Burch et al. (1985, and references therein) the latitudinal position of the dayside auroral oval varies during geomagnetic storms with the IMF BZ component, while the nightside auroral oval is less sensitive to IMF BZ.
Meng (1984) investigated the auroral oval dynamics during three intense geomagnetic storms by examining the latitudinal variations of the noon sector polar-cusp region and the nightside auroral oval. His study revealed the displacement of the noon sector aurora by a few degrees more than the nightside region near the peak of the magnetic storm, and the midnight auroral oval recovered more slowly than the noon sector during the storm recovery phase. Further, the equatorial boundary of the nightside auroral oval was observed to expand below 50˚ during extremely intense storms. The rate of the equatorward expansion of FACs was shown to be dependent on solar wind dynamic pressure (Pd) (Anderson et al. 2002), implying that the greater the pressure, the faster the equatorial expansion. The study further revealed that the intensification and equatorward expansion of the global FACs occurred in response to a southward IMF BZ and the strongest FACs occurred during the most intense negative IMF BZ, corresponding to the storm main phase, and the weakest FACs occurred during northward IMF, corresponding to storm recovery phase.
Wang et al. (2006) on the other hand investigated the intensity of FACs and its latitudinal position in both the hemispheres, at dayside and nightside separately during the phases of the storm. They reported the intensification of FACs during the main phase of the storm, with large FAC densities on the dayside summer hemispheres compared to winter hemispheres. The intensities on the nightside are however comparable between the two hemispheres. The study also suggested that during magnetic storms, solar wind dynamic pressure seems to play a very important role in the energy input into the ionosphere.
Even though storm-time characteristics of FAC has been reported by a good number of and the behaviour of FACs during storm-time is fairly known, this work seeks to affirm and attest the earlier observations using a new metric called the FAC range at extreme mesoscale (~152 km). FAC range is defined here as peak-to-peak amplitude of the filtered FAC density, consisting of FAC of all regions. The FAC range database will also be used to test the FAC statistical models such as Weimer.
The FAC range for all the satellite passes during the three storms are evaluated and used to determine the storm time latitudinal position of the FACs. The paper is organized as follows: section 1 outlines brief introduction. In section 2 we describe data sets and methodology while section 3 examines the three events. For each event we examine FAC range latitudinal variations with respect to Dst, IMF BZ and dynamic pressure as well as FAC range latitudinal correlation with IMF BZ and dynamic pressure in both hemispheres. In section 4 we discuss our results and section 5 is the summary.
2. DATA SET AND METHODOLOGY
The geoscientific satellite Challenging Minisatellite Payload (CHAMP) was launched on 15 July 2000 into a near circular, near-polar orbit (87.3˚ inclination) (Reigber et al. 2002). With initial altitude at 456 km the orbit decayed to about 350 km after 5 years. The orbital plane precesses at rate of 1 h in local time (LT) per 11 days, thus covering all local times within 131 days. The data used here are the vector magnetic field measurements of the Fluxgate Magnetometer (FGM). FGM instrument delivers vector field readings at a rate of 50 Hz. The satellite data used in this study are the pre-processed (level 2) FGM vector data from CHAMP in sensor frame (product identifier CH-ME-2-FGMFGM), which has been down sampled to 1.0 Hz.
The Dst, IMF BZ (in GSM coordinates) and solar wind dynamic pressure are taken from NASA/Goddard Space Flight Center’s (GSFC’s) OMNI data set through the OMNIWeb interface (https://omniweb.gsfc.nasa.gov/form/ dx1.html). The OMNI data set provides time series of solar wind parameters propagated to their impact on the bowshock (Papitashvili et al. 2002). The solar wind data has been time shifted for 15 min to take into account the solar wind propagation through the magnetosheath from the bow shock nose to the magnetopause (Cowley 2000, and references therein).
We estimated the FACs from the simple 1-D approach interpreting temporal variations as spatial structures along the satellite orbit. The FAC density jz is derived from Ampere’s law, by solving Curl-B, that is
where μ0 is the permeability of free space, Bx and By are the transverse magnetic field components caused by the currents.
The geomagnetic vector data delivered by CHAMP has contributions from many sources (e.g. main field, crustal field, magnetospheric current and ionospheric plasma). To eliminate these contributions, we use Potsdam Magnetic Model of the Earth, Version 4 (POMME), which is an empirical geomagnetic field model based on CHAMP observations (Maus & Weidelt 2004;Maus et al. 2005, 2007, 2008). This model includes the main field, the crustal anomalies up to spherical harmonic degree/order 90, and the field of the ring current and large-scale magnetospheric fields. The resulting residuals are low-pass filtered with a cutoff period of 20 s (corresponding to a spatial scale of 150 km, full wavelength) to reduce the influence of magnetic field variations caused by Alfvén waves with small transverse wave lengths (few kilometers) (Lühr et al. 1996). The residual magnetic field is transformed from the geocentric NEC frame into mean field-aligned (MFA) coordinate system. In the MFA coordinate system, the z-component is the “parallel” component i.e. aligned with the average magnetic field direction, the y-component is the “zonal” component i.e. perpendicular to the magnetic meridian and pointing to the east, and the x-component is the “meridional” component which completes the orthogonal triad and points outward. The current estimates are given in ‘quasi-dipole’ coordinates described by (Richmond 1995;Emmert et al. 2010). The curl of the field was evaluated from the variations in B along a trajectory of the spacecraft orbit track, from which the FAC density was estimated. We assume that FACs are organized in infinite sheets aligned with the mean location of the auroral oval (e.g. Wang et al. 2005). Since we are using a single satellite, we convert the observed temporal variation into spatial gradients by considering the spacecraft’s velocity under the assumption of stationarity of the current during the time of satellite passage (time constant 10 s). Further, the study by (Lühr et al. 1996) showed that any deviation (oblique crossing or finite extent of sheet) can lead to a factor of 2 underestimation of the current density. The spatial gradient perpendicular to the current sheet in the projected x-y plane vanishes because it is aligned with the uniform current sheets under consideration. Introducing discrete sampling (e.g. Lühr et al. 1996) reduces equation 1 to;
where vx is the velocity perpendicular to the current sheet and By is the magnetic deflection component parallel to the sheet in the projected x-y plane.
Finally, the FAC density estimates from equation 2, were filtered using a low-pass filter with a cutoff a period of 20s to obtain FAC density at extreme mesoscale, according to McGranaghan et al. (2017).
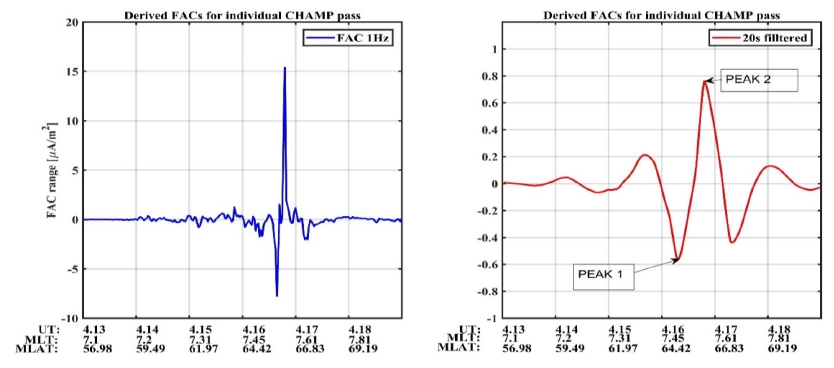
Fig. 1 shows sample derived FAC densities from a single satellite dawnside pass over the northern hemisphere on 14 October 2000. Left (right) plots show FACs at 1 Hz and 20 s filtered FAC density respectively. The average values of the universal time (UT), magnetic local time (MLT) and magnetic latitude corresponding to the peaks are considered. The location of maximum and minimum peaks is determined by the magnetic latitude (MLAT), with the maximum difference ≤ 3˚ MLAT, alongside MLT and UT. The satellite passes with the peaks which are far apart (> 3˚ MLAT) are discarded. This was done to avoid using peaks in different MLT sectors. The mean MLAT, MLT and UT is determined from the position of the peaks while the FAC range is determined by absolute sum of FAC as illustrated in Table 1 below. The calculation of the FAC range thus took into account only the period between two peaks in the same MLT sector.
3. EVENTS STUDY
Geomagnetic storm occurred on 04 October 2000 lasted for about three days, attaining maximum depression of ~–182 nT at ~38.00 UT as displayed in Fig. 2, upper panel. In October 2000, the CHAMP satellite was approximately in dawn-dusk meridian, enabling us to study both dawnside and duskside behaviour of FAC range during storm time conditions. The growth phase of the storm started at ~02:00 UT when the magnitude of the solar wind dynamic pressure and IMF BZ are ~3.2 nPa and ~5.78 nT respectively. This storm exhibited complex structure during the main phase of the storm. The area demarcated by light blue band shows the SymH negative excursion to a minimum value of ~–163 nT at ~26:06 UT (correspondingly, IMF BZ and dynamic pressure attained values of ~–26.6 nT. and ~27.03 nPa). After which a brief recovery was exhibited between ~29:08 UT and 33:08 UT corresponding to southward excursion of the IMF BZ (light green band). The dynamic pressure, on the other hand, remained relatively constant. Finally, the SymH fell further to the minimum value of ~–182 nT at ~38:00 (light red shade). During the period between ~29:08 UT and ~38:00 UT, both the dynamic pressure and IMF BZ attained their maximum deflections. Solar wind dynamic pressure peaked with a value of ~27.03 nPa at ~30:56 UT while IMF BZ attained ~–26.6 nT at ~31:00 UT.
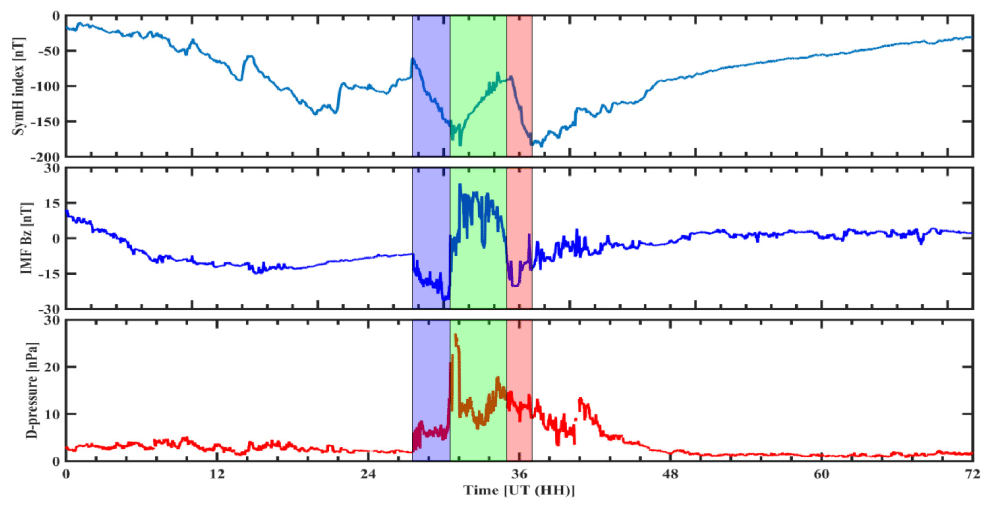
Fig. 4 shows the temporal variation of the FAC range with IMF BZ in both hemispheres, for dawn and dusk MLT sectors. In the northern hemisphere, duskside (Fig. 3, left upper panel) a good correspondence of the FAC range latitudinal shift with the Dst is observed. The minimum equatorward drop was located at ~58˚ MLAT at ~38:00 UT, coinciding with the minimum drop in Dst. The northern hemisphere dawnside (Fig. 3, right, upper panel), a minimum FAC range equatorward dropped to ~61˚ MLAT at ~21:00 UT much earlier before the minimum Dst value. The equatorward shifts followed a long duration of steady southward IMF BZ (Fig. 4, right, upper panel) while the dynamic pressure (Fig. 5, right upper panel) was constantly below ~5 nPa and thus expected not to contribute much to latitudinal shift. However, during storm recovery phase, both dawnside and duskside FAC range retreated poleward consistently with the storm.
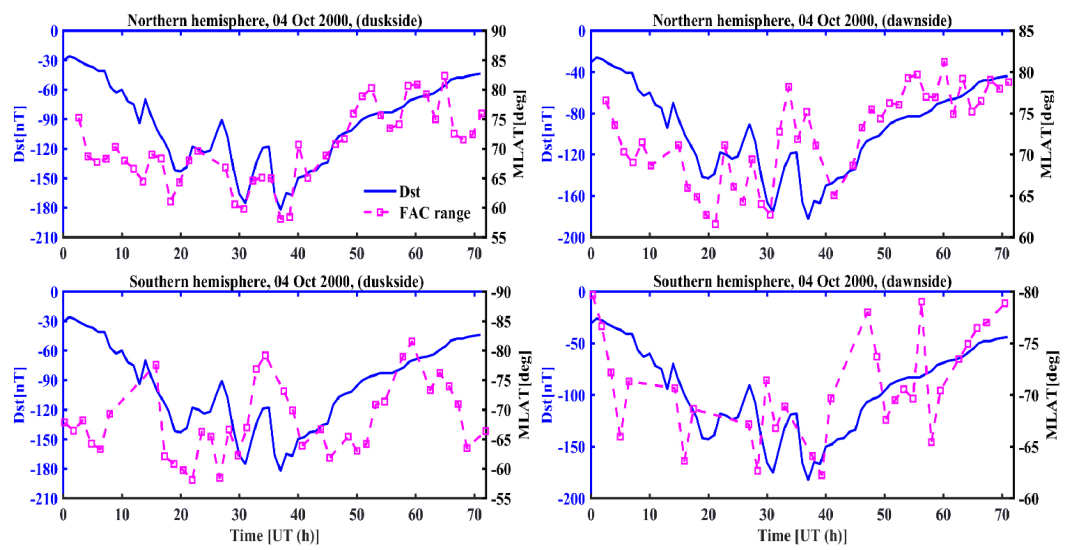
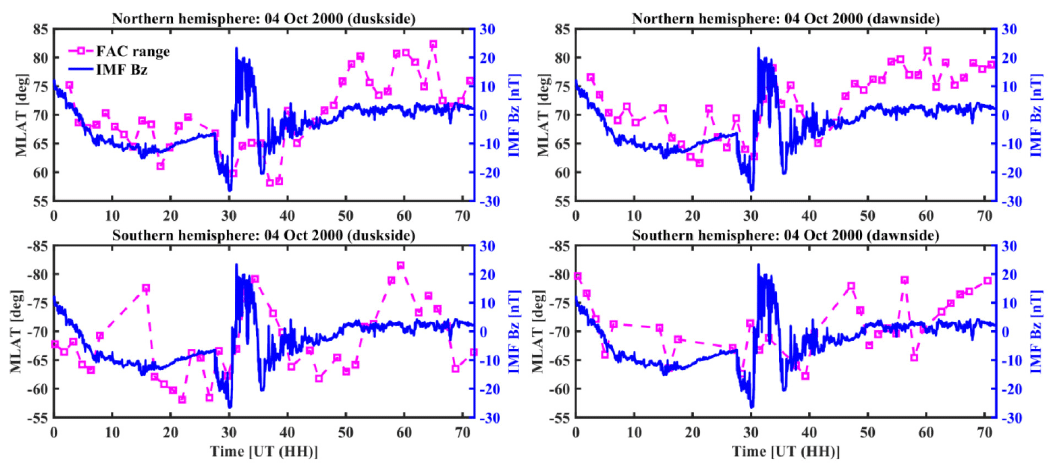
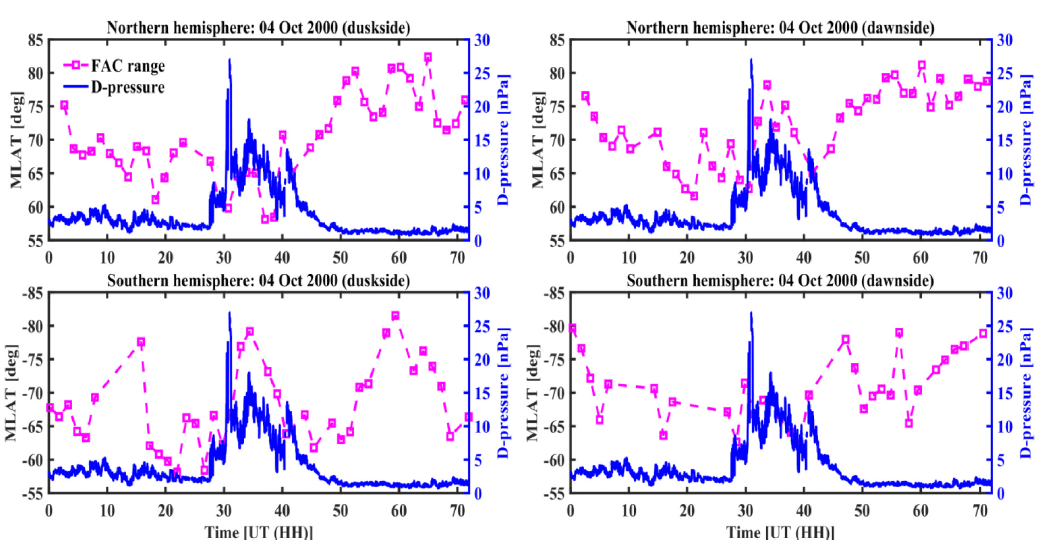
In the southern hemisphere, the dusk sector (Fig. 3, left lower panel) FAC range expands equatorward to ~59˚ MLAT at ~22:00 UT, much earlier than the minimum Dst. Correspondingly, the IMF BZ (Fig. 4 left lower panel) was exhibiting negative values but directed northwards while the dynamic pressure was constantly below ~5 nPa. The FAC range, however responded well to the brief (~2 hours) recovery in Dst, between ~29:08 UT and 31:08 UT, retreating poleward to ~80˚ MLAT. The poleward retreat again responded well to the storm recovery phase and IMF BZ while the dynamic pressure played little role. The southern hemisphere dawn MLT sector (Fig. 3, lower right panel) had its minimum equatorward boundary of ~62˚ MLAT at ~39:00 UT, nearly the same time as the Dst minimum. At this time the IMF BZ (Fig. 4 lower right panel) was ~–15 nT and the dynamic pressure (Fig. 5 right lower panel) was ~16 nPa.
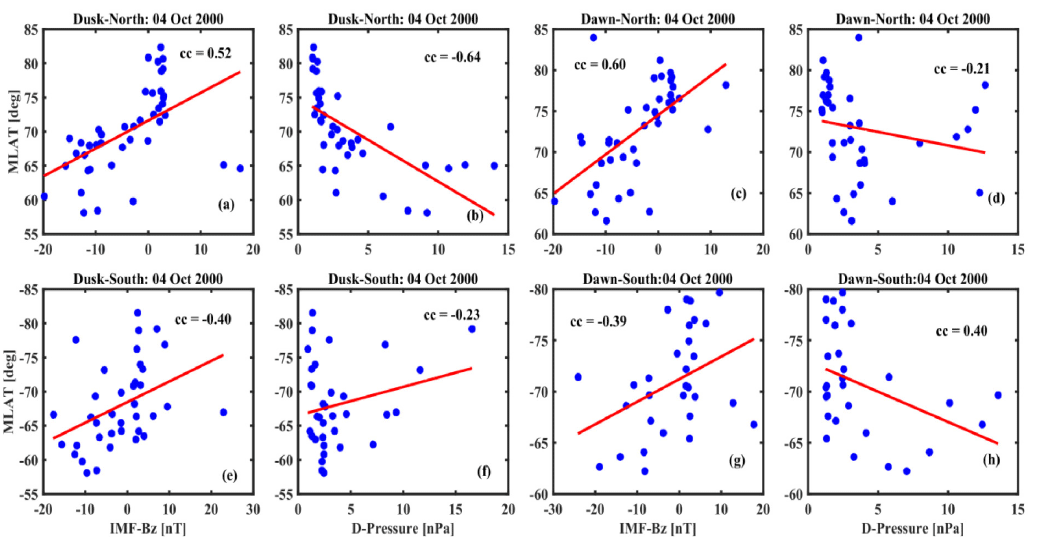
Fig. 6 presents the correlation between the FAC range latitudinal variation with the IMF BZ and dynamic pressure. The northern hemisphere depicted very good correlation with the IMF BZ in both sectors (with correlation coefficients of, dusk ~0.52 and dawn ~0.6 respectively, Figs. 6a and 6c). In southern hemisphere the correlation of FAC range with IMF BZ (Figs. 6e and 6g), though low at ~–0.4 (duskside) and –0.39 (dawnside), still gave a good picture of latitudinal variation of FAC range. Interestingly, dynamic pressure exhibited a good correlation in the northern dusk and southern dawn sectors (Figs. 6b and 6h). The FAC range expanded equatorwards with the increase in dynamic pressure, more in northern dusk sector with a correlation coefficient of ~–0.64.
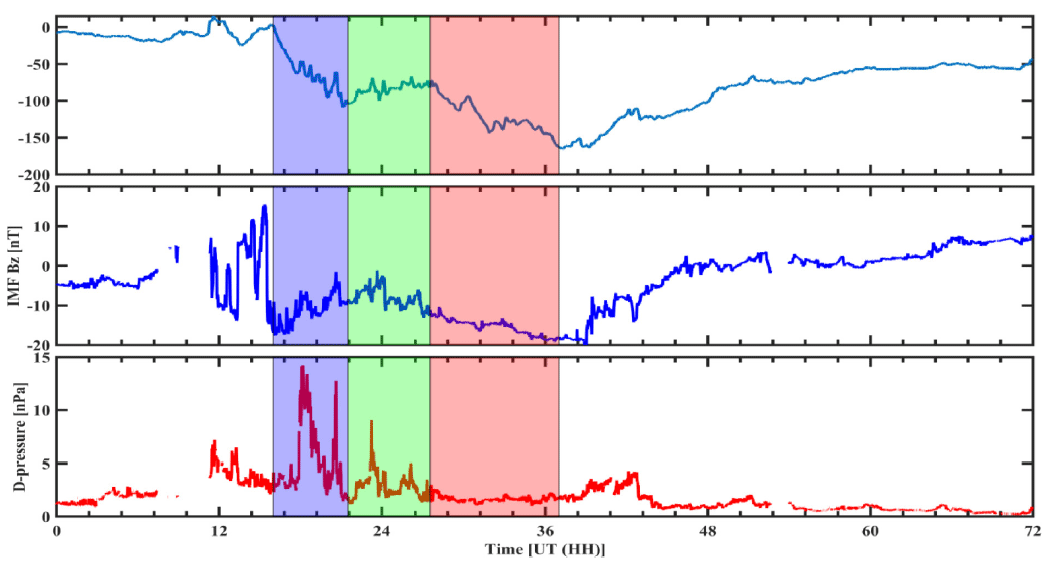
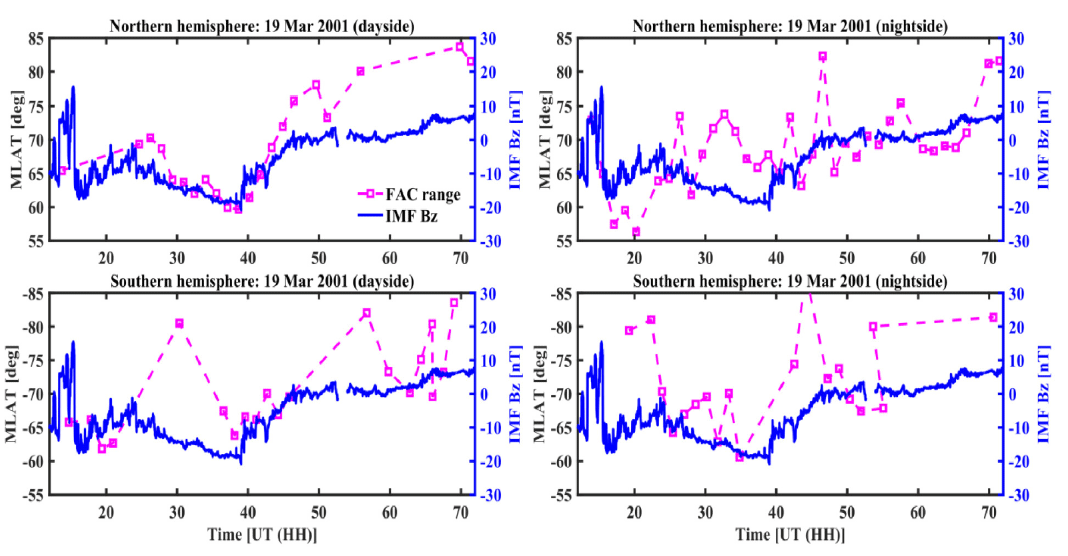
The main phase of the storm event on 19 March (Fig. 7) starts at ~12:00 UT lasting for ~12 hours to its minimum depression of –149 nT at ~38:00 UT, light blue shaded. It exhibits a complicated structure, with a brief recovery of ~4 hours between 22:00 UT and 27:00 UT, light green shading. The IMF BZ (middle panel) corresponds well with the Dst, turning northward between ~18:00 UT and ~24:00 UT, coinciding with the brief storm recovery. There on, it displays a long duration of southward excursion, dropping to ~–20 nT at ~39:00 UT (light red shade). It then exhibits a complete northward turning, again coinciding with the storm recovery phase. The dynamic pressure (Fig. 10) displayed high activity during the early storm main phase, between ~19:00 UT and ~24:00 UT, with a maximum of ~15 nPa. It then remains constantly low, below ~1 nPa for ~15 hours. Between ~39:00 UT and 43:00 UT, it showed a brief surge just above ~4 nPa.
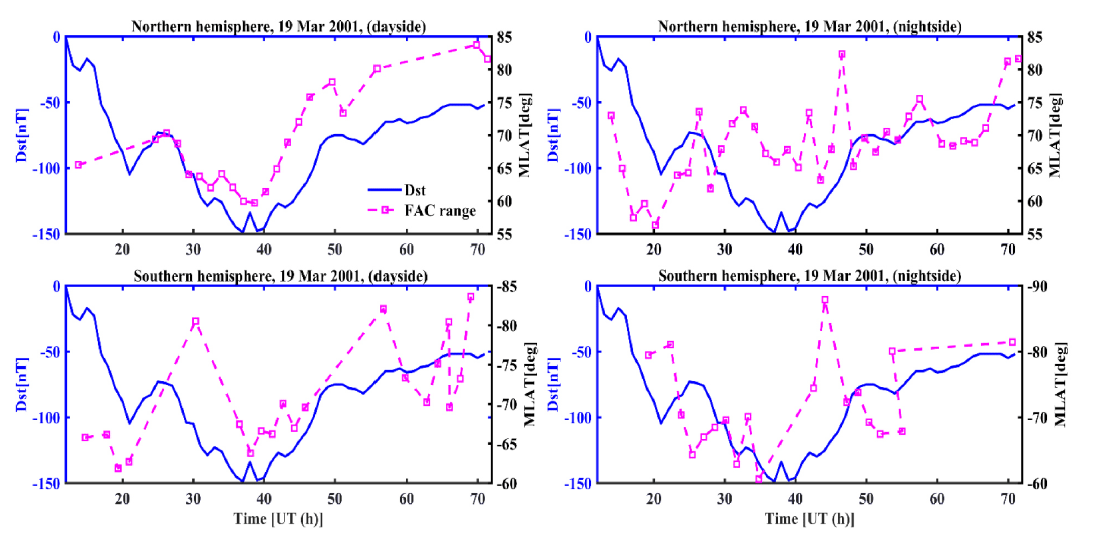
The FAC range corresponds well with the storm main phase and recovery phase for all the MLT sectors (Fig. 8). We however note that, during dayside northern hemisphere (Fig. 8, left upper panel) the correspondence is clearly observed. The FAC range expands equatorwards to ~59.6˚ at ~38:66 UT and retreats poleward to ~84˚, this also follows a long duration of southward IMF BZ (Fig. 9, left upper panel). The northern hemisphere nightside (Fig. 8 upper, right panel), the FAC range attained its equatorward boundary in the early main phase of ~57.45˚ at ~17:10 UT and also corresponded well with the storm recovery phase. Similar behaviour is observed with the IMF BZ (Fig. 9 right upper panel). Though the southern hemisphere had very few FAC range data points, it exhibited good response to Dst, IMF BZ and dynamic pressure. It is interesting to note that dynamic pressure seemed to have played a role in equatorward and poleward shifts in FAC range, in that high dynamic pressure corresponds to equatorward expansion and low pressure coincides with poleward retreat. This is clearly observed in Fig. 10, lower panels.
We recap this observation in correlation plots in Fig. 11. The southern hemisphere dayside (Fig. 11f ) shows high correlation coefficient of 0.69. From Fig. 10 (lower left, panel), we observe FAC range equatorward during high activity of pressure and polewards during low activity. Southern hemisphere nightside (Fig. 11h) had a low negative correlation coefficient of –0.13 and this could have been as a result of poleward retreat of FAC range observed during high activity of dynamic pressure (Fig. 10 lower, right panel).
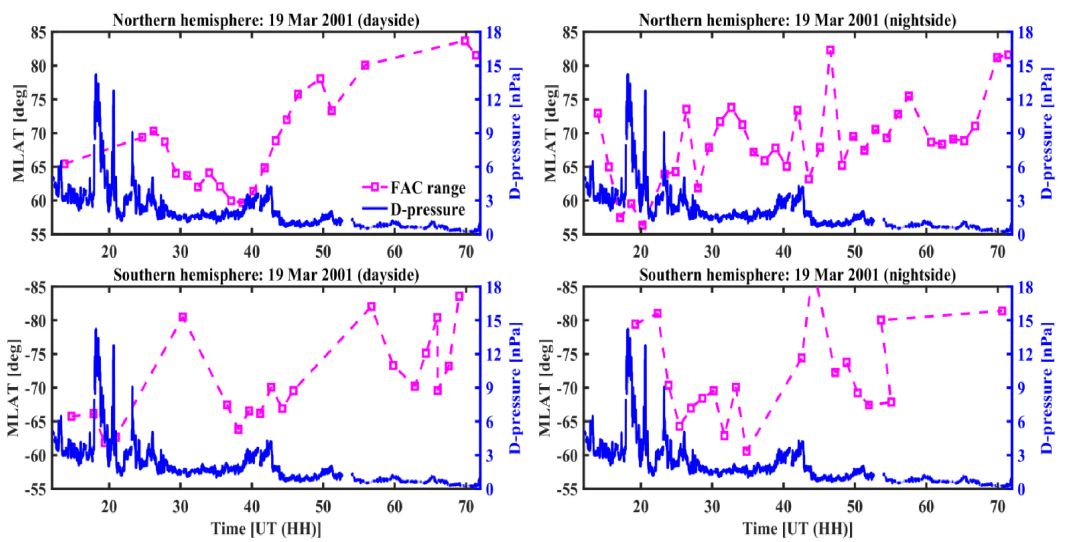
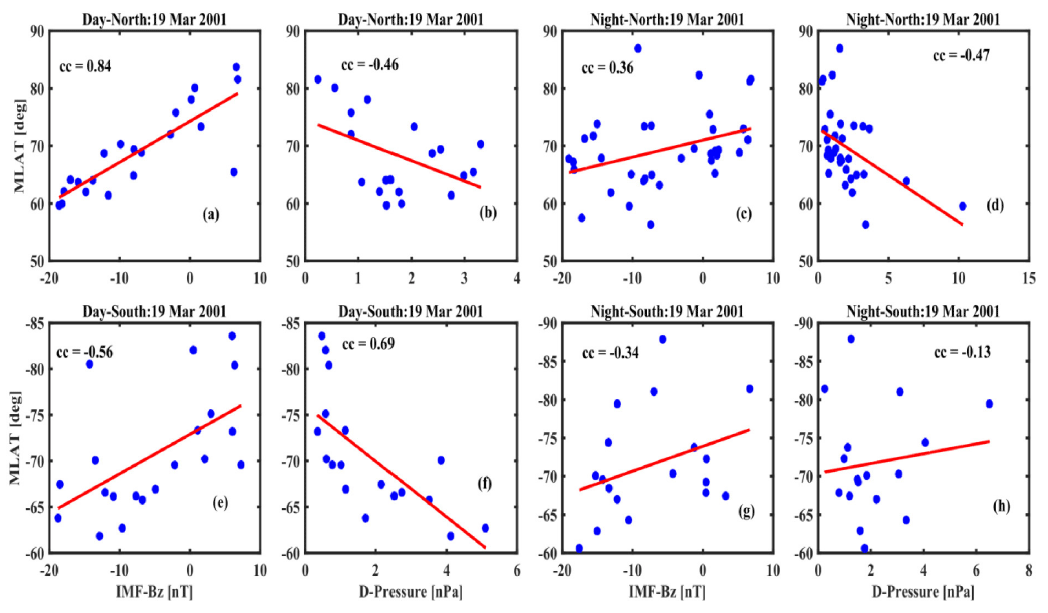
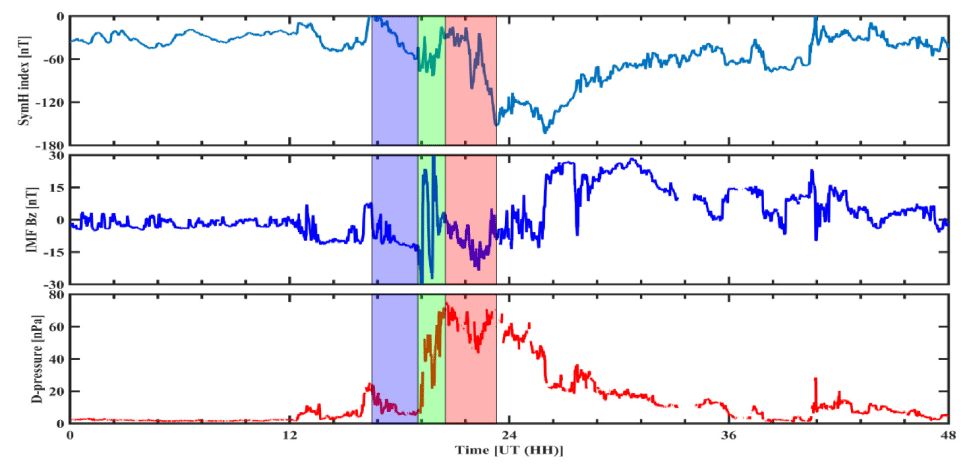
Fig. 12 shows a one-minute average time evolution of the storm event on May 29, 2003. The main phase of the storm starts gradually at ~13:00 UT on 29 May 2003 and drops to a minimum depression of –144 nT at 24:00 UT on 29 May 2003 (light blue shading). Correspondingly, during this period, from ~12:28 UT to ~25:53 UT, the OMNI data shows an intermittent negatively-positively varying IMF BZ (Fig. 12, middle panel) getting to a minimum value of ~–32 nT at ~19:00 UT before it turns northward. The northward turning lasts for ~10 hours attaining a positive maximum value of ~31 nT at ~30:00 UT (light green band), followed by a southward excursion. The dynamic pressure (Fig. 12, bottom panel) on the other hand shows two density hikes at ~14:00 UT and ~18:00 UT followed by a major density surge at ~19:40 UT. The density surge lasts for a period of ~7 hours with the pressure oscillating between ~40 nPa and 75 nPa (shaded light red).
Next, we decipher the FAC range behaviour for this storm. The northern hemisphere dayside (Fig. 13, left upper panel) FAC range depicts a good variation with the Dst attaining its equatorward displacement of ~66˚ MLAT at ~16:00 UT, three hours after the start of the storm main phase. During the storm recovery phase, the FAC range displays a poleward retreat up to ~86˚ MLAT at ~30:31UT, followed by a brief equatorward move responding to the Dst drop between 35:00 UT and 41:00 UT. Both the equatorward expansion and poleward retreat of FAC range related well with the southward IMF BZ and northward IMF BZ respectively (Fig. 14, left upper panel). The dynamic pressure (Fig. 15, left upper panel) played little role in FAC range movement. The nightside (Fig. 13, right upper panel) also exhibited good variation, with equatorward displacement of ~58.8˚ at ~24:25 UT; almost exact time as the Dst minimum depression. The FAC range then surged polewards to ~80˚ at ~38:00 UT following the recovery phase. In this case however, both IMF BZ (Fig. 14, right upper panel) and dynamic pressure (Fig. 15, right upper panel) corresponded well with the equatorward and poleward movement of FAC range. The FAC range attained its equatorward minimum location at peak dynamic pressure and poleward location corresponding to lowest activity of pressure.
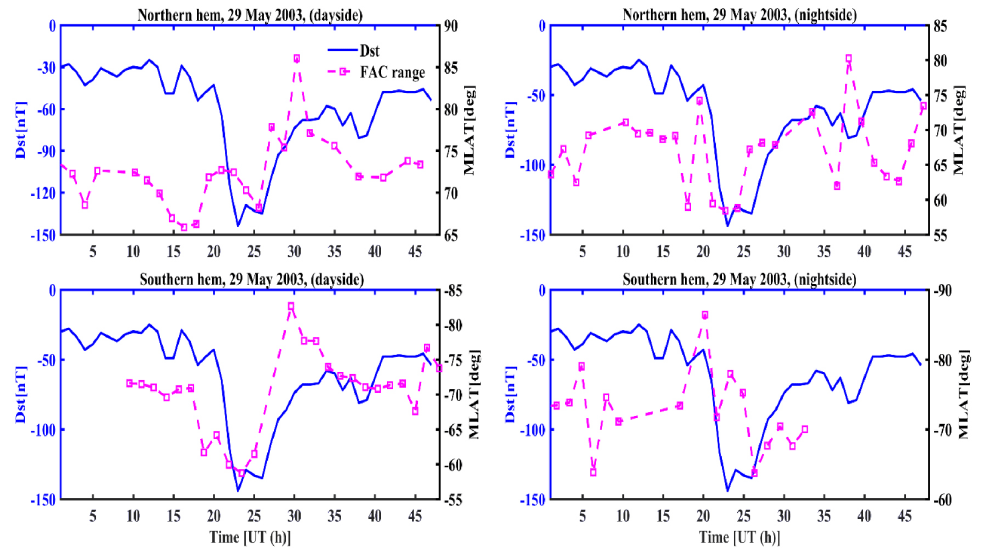
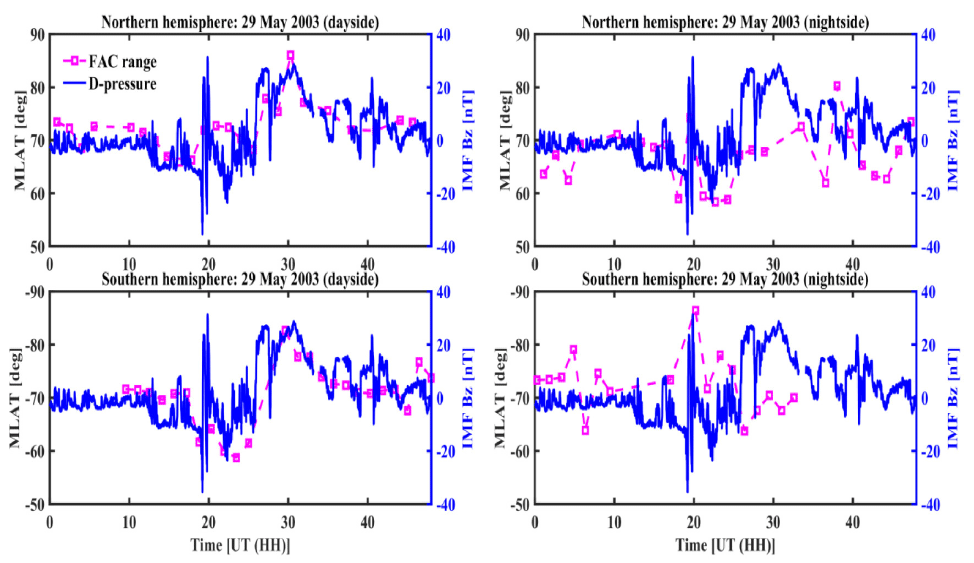
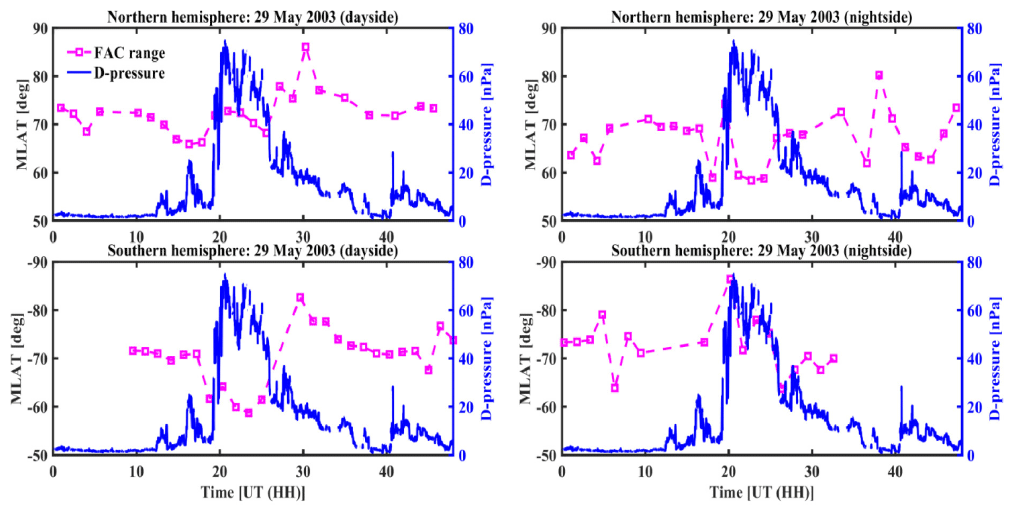
Even though southern hemisphere had very few data points representing FAC range, both dayside (Fig. 13, lower left panel) and nightside (Fig. 13, lower right panel) still displayed a very response to the storm phases. The dayside FAC range expanded equatorward to ~–58.75˚ MLAT at ~23.47 UT and poleward ~–82.66˚ MLAT at ~29:0 UT. The nightside had its equatorward displacement at ~–63.76˚ at ~26:00 UT, but lacked data on the recovery phase. Both dayside (Fig. 14, left lower panel) and nightside (Fig. 14, right lower panel) depicted a good response to IMF BZ. Further, as shown in Fig. 15, the nightside northern and dayside southern hemispheres revealed an equatorward shift of FAC range corresponding to sudden increase in the dynamic pressure. The sudden change in dynamic pressure did not however affect the dayside northern and nightside southern hemispheres. Similar observations were made in Fig. 10. The observations pointing to either asymmetry in northernsouthern reconnection process or possible similarity in daynight electrodynamics in opposite hemispheres.
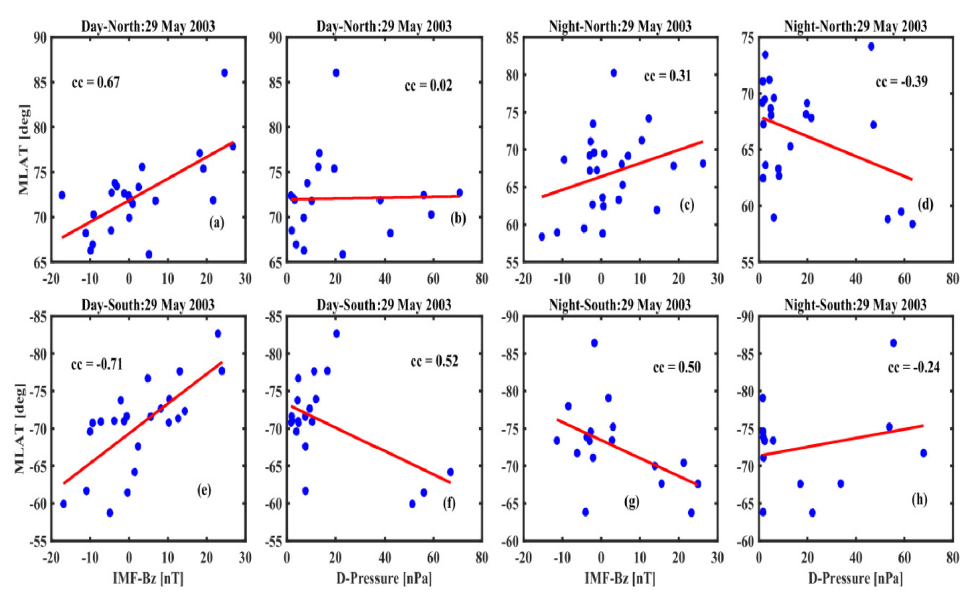
We present in Fig. 16 the correlation between the latitudinal variation of FAC range with both IMF BZ and dynamic pressure. The dayside in both hemispheres showed very good correlation with IMF BZ. The northern dayside (Fig. 16a) had coefficient of 0.64 while southern dayside (Fig. 16e) recorded a correlation coefficient of –0.71. Dynamic pressure showed good correlation in the southern dayside (Fig. 16f ) at 0.52 than northern dayside (Fig. 16b). The northern nightside (Fig. 16d) was however better correlated at than southern nightside (Fig. 16h). An interesting observation was on the nightside southern hemisphere (Fig. 16g) with equatorward expansion of FAC range during northward IMF BZ.
4. DISCUSSION
We have presented the spatial and temporal variation of extreme mesoscale FAC range with the Dst (SymH), dynamic pressure and IMF BZ. The results depict the interhemispheric, dawn-dusk and dayside-nightside differences. The equatorward excursion and poleward retreat is very pronounced in northern hemisphere than in southern hemisphere. Fig. 15, for instance, the FAC range is displaced equatorward in the dayside in the southern hemisphere corresponding to the peak of dynamic pressure (18 ≤ UT ≤ 25) while in the northern hemisphere, FAC range remains poleward at ~75˚. During this time, the IMF BZ is fully southward (Fig. 14). On the nightside, the opposite response of FAC range is seen in both the hemispheres. The interhemispheric asymmetry is further observed in the difference in the correlation coefficients (Figs 6, 11, and 16). Similarly, Fig. 3 does not only depict dawn-dusk asymmetry but also interhemispheric asymmetry in the latitudinal movement of FAC range. Mishin et al. (2016) suggested that other than IMF BY and other parameters of the solar wind, the dawn-dusk asymmetry is associated with the interhemispheric asymmetry of the FAC distribution, depicted by the difference between summer and winter seasons. We have observed the hemispheric difference in the behaviour of FACs during equinoctial months, March and October storm events. In the equinoctial conditions, the interhemispheric difference could be attributed to the diurnal variation in the terminator position with respect to the geomagnetic pole (Benkevich et al. 2000;Lyatskaya et al. 2014). The interhemispheric asymmetry observed during the May 2003 storm event (northern summer and southern winter) is attributed to the difference between ionospheric conductivities in the Northern and Southern hemispheres (Benkevich et al. 2000;Ohtani et al. 2005).
Northern hemisphere dusk and dayside sectors exhibited very good association with the storm phases and further quantified by the correlation coefficients in Figs. 6, 11, and 16. The latitudinal position of the dayside FAC range compares well during geomagnetic storms with the IMF BZ component while the nightside FAC range is less sensitive to IMF BZ. The dynamic pressure on the other hand, had good correlation in the southern hemisphere dayside sector than in the northern hemisphere. The reverse was however observed for the dawn-dusk sectors. On the nightside, the dynamic pressure remained favorable in the northern hemisphere while better in southern hemisphere dawn sector than northern hemisphere dawn sector. The differences exist between the dawn-dusk behaviour of storm-time FACs. Fig. 3 shows the difference in equatorward shift while Fig. 6 summarizes the difference with respect to IMF BZ and dynamic pressure. Similar observations were by (Anderson et al. 2005). The magnetosphere is dynamically and continuously affected by the variations in the solar wind and the IMF. The solar wind perturbations couples to the magnetopause boundary, transferring the energy and momentum are transferred the magnetosphere and ionosphere. High solar wind dynamic pressure front compresses the magnetosphere establishing a new equilibrium location of the magnetopause closer to the Earth.
The sudden pressure enhancements observed in Figs. 10 and 15 are followed by a magnetic storms and therefore have the potential of causing dramatic effect on the global aurora and on large-scale magnetospheric and ionospheric currents (Boudouridis et al. 2003;Du et al. 2011;Shue et al. 1998, and references therein).
These observations concur with observations made by earlier researchers in many instances. Yizengaw et al. (2005) observed that in storm time conditions, the disturbed solar wind compresses the Earth’s magnetosphere, and intense electric fields occur that are mapped along geomagnetic field lines to the high latitude ionosphere, which at times these penetrate to low latitudes (Yeh et al. 1991). At the same time, energetic particles precipitate to the lower thermosphere and below, expanding the auroral zone and increasing significantly the ionospheric ionization at higher latitudes. Intense electric currents couple the high latitude ionosphere to the magnetosphere, and the enhanced energy input causes considerable heating of the ionized and neutral gases. When relating the rate of the equatorward expansion to dynamic pressure, Anderson et al. (2002) noted that the higher the dynamic pressure, the faster the rate of equatorial expansion. Further they concluded that the intensification and equatorward expansion of the global FACs occurred in response to IMF – BZ and the strongest FACs occurred during the most intense IMF –BZ (i.e. during storm main phase) and the weakest FACs occurred during IMF +BZ (corresponding to recovery phase). Dayside reconnection is expected to transport magnetic flux, strengthen FACs, lead to polar cap expansion and magnetopause erosion (Bromund et al. 2016). Further, during a prolonged period of strongly southward IMF, they observe significant intensification of FACs. The dayside auroral oval appears as a thin arc associated with ongoing dayside reconnection. Both the FACs and the auroral arc move equatorward reaching as low as ~60° magnetic latitude. Thus, the solar wind is expected to have different effects on the dayside and nightside FACs’ intensities and locations during intense storms. The effect of the solar wind dynamic pressure on the ionospheric dynamics has been studied by Palmroth et al. (2004). They inferred from a statistical superposed epoch analysis that during steady southward IMF, solar wind pressure pulses, as observed by ACE, increased the AE index. The AE index is often used as a proxy for Joule heating, which is associated with FACs. During steady northward IMF, such a response was not observed. On the other hand, using a global MHD simulation, they found that Joule heating was positively correlated with the solar wind dynamic pressure both during southward and northward IMF. According to the simulation, increasing dynamic pressure increases FAC, which then increases Joule heating.
Further Milan (2004) associated the equatorward shift of the auroral oval with the expansion of the polar cap and related it to the buildup of the open magnetic flux in the magnetotail. Also Burch et al. (1985, and references therein) observed the latitudinal variation of dayside auroral oval during geomagnetic storms with the IMF BZ component while the nightside auroral oval is less sensitive to IMF BZ.
5. CONCLUSION
We have explored the FAC range dynamic behaviour during main phase and recovery phase of three storms. Our results can be summarized as:
The dayside and duskside FAC range are displaced equatorward more than nightside and dawnside respectively. The equatorward shift is more prominent in the northern hemisphere compared to southern hemisphere.
The latitudinal shift of FAC range is better correlated with IMF in northern hemisphere dusk-dawn than in southern hemisphere dusk-dawn.
IMF BZ is better correlated with the FAC range shifts in the dayside northern hemisphere than in southern hemisphere.
Dynamic pressure correlates better with FAC range latitudinal shifts in southern hemisphere dayside as compared to dayside northern hemisphere, while the reverse in nightside.
There is a possible electrodynamic similarity between dayside southern hemisphere and nightside northern hemisphere.
This work fits with earlier studies and thus the database of FAC range can further be used for testing FAC statistical models.
We suggest than our observations, though in agreement with earlier researchers, more work can be using advanced instrument like SWARM to get more insight of the observed trends. Further, the FAC range database will be used to investigate the pure effect of each of solar wind parameters, choosing cases such as dynamic pressure variation under steady northward IMF and southward IMF Bz under a weak dynamic pressure and different phases of the storm for further comparison with earlier studies.
