1. INTRODUCTION
Globular clusters are fascinating stellar systems for their role in clarifying the merging process of the Galaxy formation, since the present Galactic globular cluster populations are considered to be survivors of initially more numerous satellite systems, depopulated by the tidally disrupted processes. Indeed, the globular cluster-galaxy tidal interaction can cause stars to escape the cluster’s gravitational potential and then the unbounded stars remain in the vicinity of the cluster for several orbital periods to become tidal debris-forming tails (Combes et al. 1999;Yim & Lee 2002;Capuzzo Dolcetta et al. 2005;Montuori et al. 2007). The tidal tails are likely aligned with the cluster’s orbit because the debris produced by a dissolving globular cluster will have similar orbital characteristics as the cluster itself. This information indicates that the tidal tail features surrounding globular clusters provide an excellent evidence that the Galactic halo have formed from the accretion of dwarf satellite galaxies (e.g., Sohn et al. 2003;Chun et al. 2010).
Indications of tidal tails were found in several previous observational studies with photographic and CCD photometry around globular clusters. As a first note of the extratidal feature around globular clusters, Grillmair et al. (1995) in an analysis of outer structures of 12 Galactic globular clusters found that most of the clusters show extratidal wings in their radial surface density profiles and tidal tails in two dimensional surface density maps. Till now, similar extratidal overdensity features have also been found in over 30 globular clusters in the Galaxy and in the M31(Grillmair et al. 1996;Lehmann & Scholz 1997;Leon et al. 2000;Testa et al. 2000;Siegel et al. 2001;Lee et al. 2003;Sohn et al. 2003;Lauchner et al. 2006;Jordi & Grebel 2010;Niewderste-Ostholt et al. 2010;Chun et al. 2012, 2015).
The most significant examples of this have been Palomar 5 (Odenkirchen et al. 2001;Rockosi et al. 2002;Odenkirchen et al. 2003;Grillmair & Dionatos 2006;Odenkirchen et al. 2009) and NGC 5466 (Belokurov et al. 2006;Grillmair & Johnson 2006) with tails extending as much as 22° and 45°, respectively. Also, Chun et al. (2010) investigated the spatial configuration of stars around 5 metal-poor globular clusters in the Galactic halo and found that all the clusters exhibit strong evidence of extratidal overdensity features beyond their tidal radii in the form of extended tidal tails around the clusters.
While most of previous studies for the feature of tidal extension and tails were focused on the metal-poor globular clusters currently located in the Galactic halo, we note here that globular clusters with various metallicities are equally present from the central bulge to the outer halo. This indicates that globular clusters can be used as tracers of the Galaxy formation. Particularly, the Galactic bulge harbors a rich population of globular clusters with a broad metallicity distribution that extends from about twice solar to less than one-tenth solar abundance (Ortolani 1999). Most metal-rich globular clusters, defined to have [Fe/H] > -1.0 dex, show a strong concentration around the Galactic center and appear to be associated with the Galactic bulge component. However, the metal-poor clusters located in the Galactic bulge could not originally form in the bulge but can also be caused be the halo visitors, though some of them might be true bulge members, in which case they might be the oldest objects in the Galaxy (e.g., Minniti 1996). Thus, it is important to search for any extratidal overdensity structure around metal-poor globular clusters in the Galactic bulge, in order to understand if they may also be the remnants of the merged satellite dwarf galaxies as the cases of the halo clusters or if a few might be extremely old bulge cluster. Recently, Chun et al. (2012, 2015) found that the spatial density distributions of stars around metal-poor globular clusters in the Galactic bulge show asymmetry with distorted overdensity features. Based on the results, they discussed possible origins and evolutions of the clusters: (1) the cluster might have formed in satellite galaxies that merged and created the Galactic bulge region in the early universe, after which its dynamical properties were modified by dynamical friction, or (2) the clusters might have formed in primordial and rotationally supported massive clumps in the thick disk of the Galaxy.
In this paper, we investigate wide field two-dimensional distribution of stars around three metal-poor globular clusters (NGC 6266, NGC 6273, and NGC 6681) in the Galactic bulge, and we report the spatial structure of the stellar distribution in the vicinity of the clusters. Table 1 contains basic data for the three target globular clusters. NGC 6266 is the one of the most massive globular clusters located at RGC = 1.7 kpc, which RGC is a distance from the Galactic center. It has a metallicity of [Fe/H] = -1.29 and concentration index of c = log(rt/rc) = 1.70. NGC 6273 is located at RGC = 1.6 kpc and it has metallicity of [Fe/H] = -1.68 and a concentration index of c = log(rt/rc) = 1.53. While NGC 6273 is well known as the flattest system ( = 0.73) in the Milky Way (White & Shawl 1987), Chen & Chen (2010) reported that NGC 6273 seems to have just slight flatness ( = 0.89) through their result on the basis of 2MASS. NGC 6681 at 2.1 kpc from the Galactic center has metallicity of [Fe/H] = -1.51 and high concentration index of c = log(rt/rc) = 2.50. Also, it has a relatively low reddening index (E(B-V) = 0.07) as compared with the Galactic bulge region.
Section 2 presents observations, data reduction procedure, and photometric measurements of the resolved stars. The statistical mask filtering method for the photometric selection of cluster members is presented in Section 3. In Sections 4 and 5, we investigate extratidal features around the target clusters by using two-dimensional stellar density maps and radial surface density profiles. The results are summarized in Section 6.
2. OBSEVATIONS AND DATA REDUCTION
The imaging data for NGC 6266, NGC 6273, and NGC 6681 were obtained with the MOSAIC II camera attached at the CTIO 4 m Blanco telescope on the periods of August 23-25 2006 and May 3-7 2008. The MOSAIC II camera consists of eight 2,048 × 4,096 pixel2 SITe CCDs with an angular scale of 0˝.27/pixel, yielding a 36´×36´ field-of-view. In order to search extratidal spatial stellar distribution beyond the tidal radii of the target clusters, four adjacent fields were observed covering a total area of 71´×71´. Fig. 1 shows the observing pattern for the case of NGC 6273. One field (F1) was centered to imbed the cluster itself, and the other three fields (F2, F3, and F4) were observed to extend the spatial coverage toward north and west directions from the cluster’ center. Since the tidal radii of the clusters are in the range of 7´.9-14´.5, a set of these observations provides large spatial coverage for our purpose of studying the stellar density distribution in the vicinity of the target clusters.
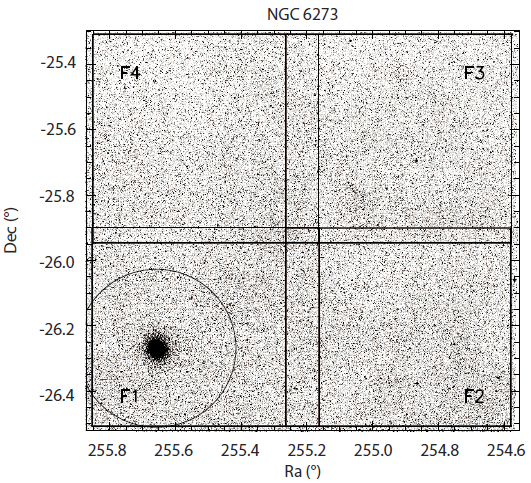
The imaging data for the target clusters were observed in BVI filters. Two or three exposures for each filter were taken without dithering. Table 2 presents the journal of the observations with exposure times for each filter. Here, we indicate that the cluster field (F1) and the other adjacent fields (F2, F3, and F4) for two targets NGC 6266 and NGC 6681 have significantly different seeing conditions caused by the different observing runs in 2006 and 2008. While this may induce photometric biases with different photometric completenesses over the observed sky area, the imbalance in the spatial stellar density distribution will be eliminated by assigning the faint limits for the member star selection process across the clusters (see Section 3). Note that imaging data for NGC 6273 were secured during the same run of 2008 so that the seeing conditions are almost same through four fields.
Preprocessing of the raw images, bias subtraction and flat fielding, was performed using the IRAF Mosaic Data Reduction package (noao.mscred). The photometry was done using the point-spread function (PSF) fitting program DAOPHOTII/ALLSTAR (Stetson 1987;Stetson & Harris 1988). The PSF might be different for eight chips on the MOSAIC II, so photometric analysis was done separately for each chip. A PSF varying quadratically with radial position was constructed using about 3,070 isolated unsaturated bright stars. Using the growth-curve method DAOGROW (Stetson 1990), we calculated the difference between the PSF-based magnitude and the total magnitude of the selected PSF stars in each frame. This aperture correction was then applied for every star in the frame. Cross identification of stars in different exposure times and filters was performed using the DAOMATCH/ DAOMASTER routines (Stetson 1992).
In order to convert the measured instrumental magnitudes to standard Johnson-Cousins photometric systems, we observed Landolt (1992) standard fields of SA92, SA110, PG1657, and PG2213 in 2006 and SA101, SA107, and SA110 in 2008, respectively. For the two runs, we obtained zero-point shifts in magnitude and transformation coefficients of the color terms of standardization correlations using 17 and 19 standard stars detected on chip 6, which shows the best quantum efficiency among the eight chips of the MOSAIC II. Separate calibrations are actually required for each chip, because there are systematic differences between chips. To calibrate this chip-to-chip variations, we observed standard stars of SA98 and SA107 to be located on the different eight chips of the MOSAIC II. Then, the standardization correlations on different chips were converted to those based on the chip 6. Photometric differences between the observed four MOSAIC II fields (F1~F4) for each cluster were also checked by comparing the magnitude of stars in the overlapping regions between adjacent fields. The same stars in the adjacent fields show the magnitude differences less than 0.1 in B and V filters and less than 0.2 in I filter, depending on the magnitudes of the detected stars. To avoid the double count of stars in the observed fields, we simply divided the overlaping region and selected stars in the nearby fields. In order to correct for the interstellar extinction, we derived the individual extinction values for each detected stars from the maps of Schlegel et al. (1998), and subtracted these values from their observed magnitude.
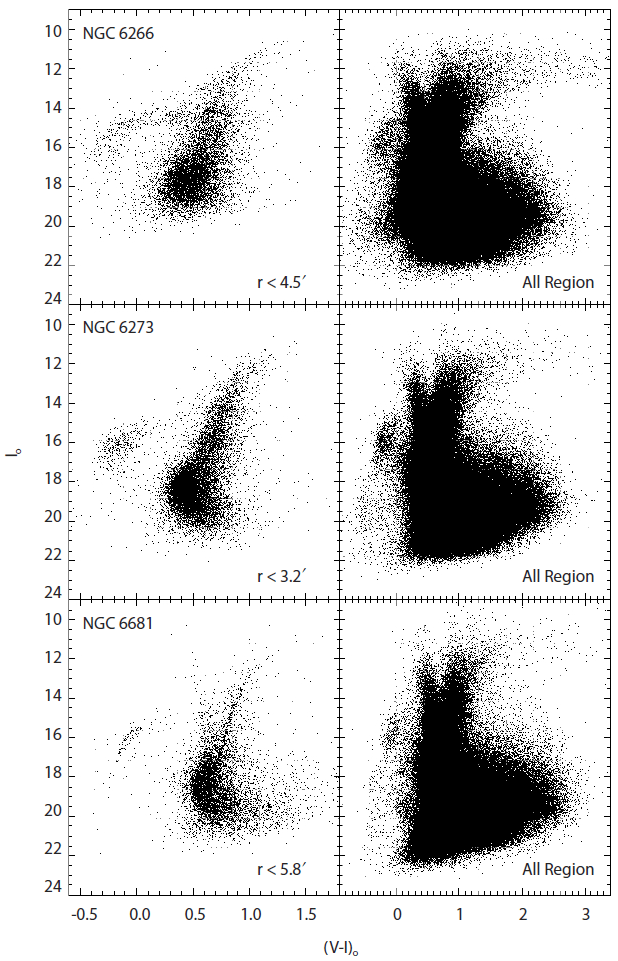
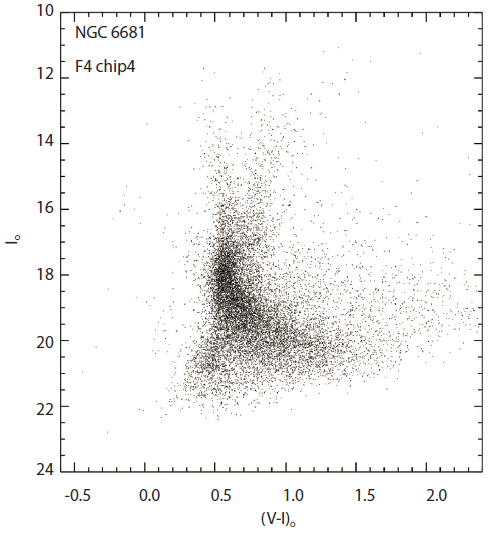
Finally, a total of 929,478, 682,815, and 473,562 stars were detected for each 71´×71´ field of the target clusters NGC 6266, NGC 6273, and NGC 6681, respectively. Fig. 2 shows the (Io, (V-I)o) CMDs for stars in the selected central regions and for all stars in the observed field of the target clusters. The CMDs for all detected stars in the right panels of Fig. 2 are severely contaminated by huge number of stars belonging to the bulge and the disk populations. As pointed out by Zoccali et al. (2003), the bulge turnoff is located around Io = 17.5-18.0. The HB red clump of the bulge population is visible at Io ~ 14.5 and (V-I)o ~ 0.9 with a large magnitude spread due to a combination of differential reddening, metallicity dispersion and depth effect. The RGB bump, which is very populated in a high metallicity domain as the bulge, could be expected just below the HB red clump. The upper RGB, brighter than the HB, is extremely wide due to the bulge metallicity dispersion. The bulge main-sequence would become very broad towards faint magnitudes due to the photometric errors. The bulge blue extended HB is seen at (V-I)o ~ -0.4 and Io ~ 20, while part of them belongs to the target cluster. The prominent vertical sequence at (V-I)o ~ 0.5 - 0.7 departing from near the bulge turnoff and extending upwards and bluewards is due to foreground main sequence stars belonging to the disk. Note that the main sequence of the foreground disk hits the bulge locus approximately midway between the turnoff and the base of the RGB. The vertical sequence at (V-I)o ~ 0.8 departing from the bulge HB and extending upward is due to the red clump of the disk stars. The CMD of NGC 6681 contains the additional Sgr dSph population (cf. Bellazzini et al. 1999), which shows a globular cluster-like sequence with a main sequence turnoff around Io ~ 20.5 and (V-I)o ~ 0.4-0.5, an extended subgiant branch, a red HB at Io ~ 17 and (V-I)o ~ 0.8-0.9, and a wide red giant branch extending to Io ~ 12.5 and (V-I)o ~ 2.7. For a better visibility of the Sgr dSph population of the CMD, Fig. 3 displays stars in the observed field of F4 corresponding to the area beyond the tidal radius of NGC 6681. Note that the RGB population of Sgr dSph hits both the main sequence populations of the disk and the bulge.
3. MEMBER STAR SELECTION
To trace the spatial stellar density distribution around the target clusters from the photometric data, it needs to minimize contamination of field stars belonging to the bulge and the disk population. A popular way to reduce the field star contamination is to compare the properties of color and magnitude of field stars with those of the cluster member stars. In this study, we followed the two-stage method by Law et al. (2003), which includes a coarse filtering mask process in three-dimensional color-color magnitude (CCM) space and a statistical signal-to-noise ratio filtering similar to CMD masking algorithm introduced by Grillmair et al. (1995). We refer to Law et al. (2003) for a detailed description of the procedure.
For the first stage, we used a coarse filtering mask in CCM space to extract stars whose CCM locations are similar to those of stars observed at the cluster area within the tidal radius of the cluster. Although many field stars are still located within the tidal radius, this process filters out a significant number of field stars belonging to the bulge and the disk, and even to the Sgr dSph for NGC 6681. To preselect the CCM locations, we divided the three-dimensional region in (Io, (V-I)o), (B-V)o space into grids with 0.2 mag, 0.08 mag, and 0.05 mag bins, respectively. The grid size was selected from several iterative filtering processes to achieve the balance between the binning and the number statistics in each volume element. Then we measured the number of stars in the cluster area nC(i, j, k) and those in background field area nF(i, j, k) in an individual volume element (i, j, k) of the CCMs. The background field areas were assigned at the observed area of r > 6rt for NGC 6266, NGC 6681, and r > 4rt for NGC 6273. Here, we assume the distribution of background field stars in the CCM space does not vary significantly across the observed field. On the CCM plane for stars in the cluster and field areas, we defined the selection mask P, the ratio of the number of stars in cluster region to the sum of the number of stars in cluster region and the scaled number of stars in field region, as in Eq. (1),
where the factor q indicates the ratio of area of field region to that of cluster region. P(i, j, k) might be nearly 1 if nC(i, j, k) is not affected by field star contamination in CCM space, while this value would decrease as contamination becomes more severe. Therefore, the selection mask volume in the CCM space can be determined by setting a minimum value of Pmin and identifying the sub-volume elements of P ≥ Pmin. Here, we adjusted a value of Pmin = 0.4 for NGC 6266, NGC 6681 and Pmin = 0.7 for NGC 6273 from which 70 % of stars were rejected in the original photometric dataset.
In the next stage of filtering, we applied the color magnitude (CM) mask filtering method (Grillmair et al. 1995) in the (Io, (V-I)o) plane using stars preselected in the first stage of the CCM mask filtering. The CM planes of stars in the cluster central region and the field area were divided into many sub-grid elements with 0.1 mag width in (V-I)o and 0.2 mag height in Io. Note that the radius of the cluster central region was empirically determined to best preserve the CMD of the cluster itself, and the background field area was assigned to the same as that in the CCM mask filtering of first stage. Then, we measured the number of stars for each sub-grid in the central region of a cluster nC(i, j) and those in the background field area nF(i, j) with color index i and magnitude index j. Assuming again that the distribution of field stars does not vary across the observed field, the local signal-to-noise ratio for each sub-grid s(i, j) has been computed by Eq. (2),
where g is the ratio of area of cluster central region to that of field region. The elements of s(i, j) were sorted into a series of descending order of one-dimensional index k, and then the cumulative star count with progressively larger area ak = kal was carried out in the CM planes of the cluster central region and the field area, where al(= 0.02 mag2) is the area of a single sub-grid element in the CM plane. The cumulative signal-to-noise ratio S(aK) was then computed by Eq. (3),
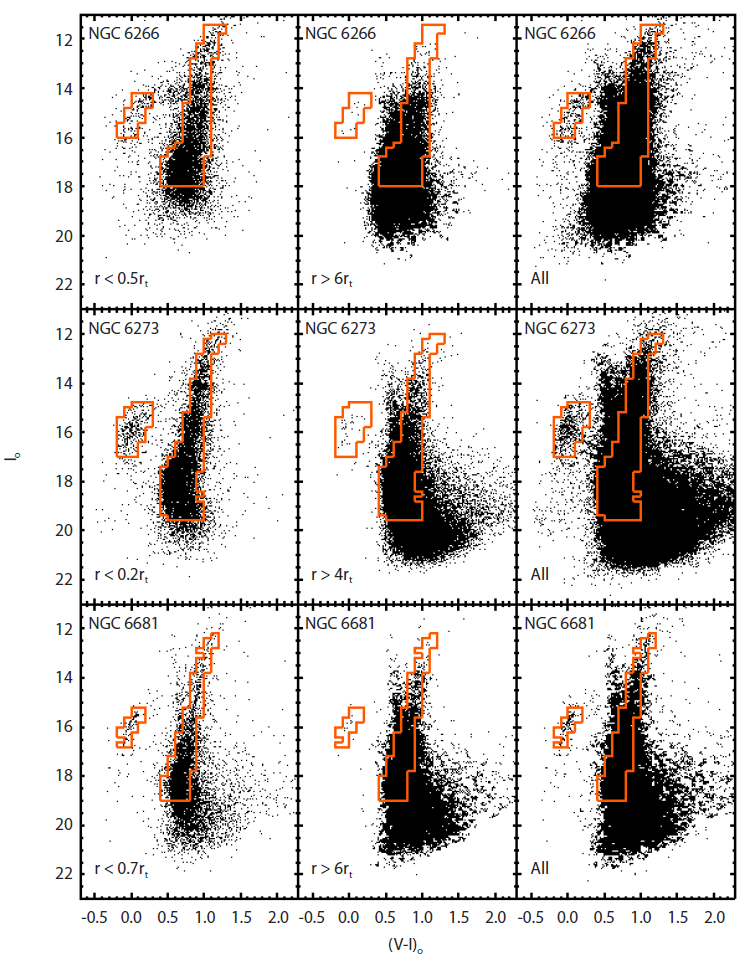
where NC(aK) and Nf(ak) are the cumulative number of stars in the CM planes of the cluster’ central region and the back-ground field area. The cumulative function S(ak) reaches a maximum for a particular sub-grid element of the CM plane, and the corresponding value of s(i, j) is decided to threshold, i.e., slim Finally, the filtering mask area was chosen by selecting all sub-areas with slim < s(i, j) and we selected the stars within these regions as final selection member of each cluster. In addition, to avoid poor statistical photometric completeness, we assigned the faint limit magnitudes of Io = 18 for NGC 6266, Io = 19.5 for NGC 6273 and Io = 19 for NGC 6681. Fig. 4 indicates CMDs used stars preselected in the first stage of the CCM mask filtering. Fig. 4, from the left panels to the right panels, shows CMDs of stars within the radii of the determined central areas, field areas, and all areas in each cluster. The line means subgrid regions finally selected by the CM masking procedure. The sample stars selected in the subgrid regions were considered in the subsequent analysis to confirm the spatial configuration in each cluster.
4. SURFACE DENSITY MAP
In order to search characteristics of stellar distribution around the target clusters, we first constructed two-dimen-sional star count maps for each cluster using the sample stars selected by the filtering mask processes in Section 3. The number of stars was counted in each grid of 1´×1´ within the observed field. The two dimensional star count maps were then transformed into smoothed surface density maps using Gaussian smoothing algorithm with various kernel values. We also assigned the contour levels for the smoothed surface density maps in a unit of standard deviation (σ) of the background density level. Note that the background density levels were determined in the field areas located four or six tidal radius away from the clusters’ centers. Extinction maps in E(B-V) (Schlegel et al. 1998) were compared with isodensity contours of the Gaussian smoothed surface density maps to check the contamination by dusts toward the line-of-sight for each cluster.
Fig. 5 represents the Gaussian smoothed surface density maps of NGC 6266 with kernel values of 1´.5, 2´.5, and 3´.5. Isodensity contours for the Gaussian smoothed surface density maps with a kernel value 3´.5 are also overlaid with the dust extinction map. The isodensity contour levels in the maps consist of the background level, 0.5σ, 0.75σ, 1.0σ, 1.25σ, 1.5σ, 2.0σ, 2.5σ, 3.0σ, and 4.0σ above the background level. The circle indicates the tidal radius of the cluster, rt = 8´.97 (Harris 1996). The short and long thin arrows represent the direction to the Galactic center and the direction perpendicular to the Galactic plane, respectively. The thick arrow indicates the direction of the cluster’ proper motion, for which Dinescu et al. (2003) determined the values as μα cosδ = -3.50 ± 0.37 mas yr-1 and μδ = -0.82 ± 0.37 mas yr-1.
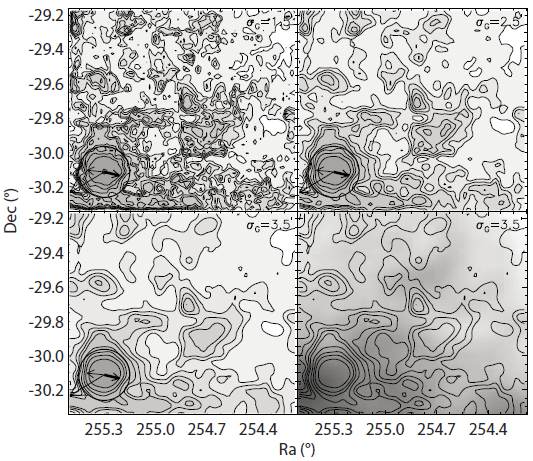
It is apparent in Fig. 5 that overdensity feature is extended over the tidal radius of NGC 6266 around the contour level of 0.5σ above the background. Especially, extratidal overdensity feature toward the direction of the proper motion is well developed, extending out to about 6rt ≈ 60´. This feature is likely to trace the cluster’ leading tail through its orbital path, while we could not identify the trailing tail at the opposite direction of the proper motion because of the limited observing area. Moreover, the isodensity contours reveal overdensity extensions to the direction perpendicular to the Galactic plane, which is a clear sign of disk shocking, as discussed in Leon et al. (2000). The contours also show a somewhat distorted S-shape feature to the line of north-west to south-east directions from the cluster center. This is in a good agreement with the previous studies that the stars evaporated from the cluster form a twisted, two lobed distribution of cluster member stars (Combes et al. 1999; Yim & Lee 2002). Although the dust extinction in this observed field is somewhat high (E(B-V) = 0.220∽0.512), the apparent extratidal overdensity feature of NGC 6266 in the surface isodensity maps does not seem to be severely disturbed by the variation of the dust extinction.
Fig. 6 shows surface isodensity maps of NGC 6273 smoothed the star count map with Gaussian kernel widths of 1´.5, 2´.5, and 3´.5. The contour levels are 0.5σ, 1.0σ, 1.5σ, 2.0σ, 2.5σ, 3.0σ, 4.0σ, 5.0σ, 6.0σ, and 7.0σ above the background level. The circle centered on the cluster indicates its tidal radius, i.e., rt =14´.50 (Harris 1996). As arrows are the same as Fig. 5, the thick arrow represents the projected proper motion of the cluster, i.e., μα cosδ = -2.86 ± 0.49 mas yr-1 and μδ = -0.45 ± 0.51 mas yr-1 (Casetti-Dinescu et al. 2010).
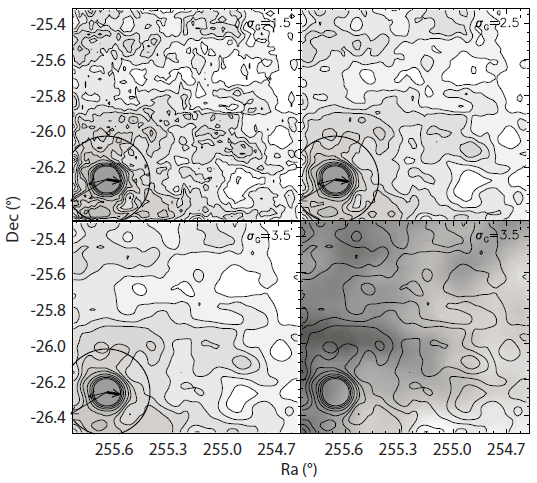
It is apparent in Fig. 6 that the contours in the central region of the cluster within 0.5rt show a circular symmetric structure. A distorted and asymmetric structure appeares in the contours greater than 0.5rt of the cluster, with contour levels less than 2.5σ. An extension toward south-west direction from the cluster out to 3rt, at the contour levels of 1.0σ, is likely to be aligned with the direction of the projected proper motion. This feature might be associated with the cluster’ leading tail through the orbital path. It is hard to identify any extensions toward the directions of the Galactic center and plane due to the limited observed area. However, there seems to be an distorted extension out to 3rt to the north-west direction, which is aligned with the opposite direction of the Galactic center and plane from the cluster. This feature might be related to the interaction with the Galaxy, such as disk and bulge shocks (Gnedin & Ostriker 1997). The E(B-V) dust extinction map in the bottom-right panel of Fig. 6 does not show any anticorrelation with the spatial structure of the isodensity contours.
Fig. 7 shows two-dimensional surface density maps of NGC 6681, smoothed by Gaussian filtering with various kernel value of 2´.5, 3´.5, and 4´.5. The overlying isodensity contour levels were set to be the background level, 0.25σ, 0.5σ, 0.75σ, 1.0σ, 1.25σ, 2.0σ, 2.5σ, 3.0σ, and 4.0σ above the background level. The circle indicates its tidal radius, rt = 7´.91 (Harris 1996). The short and long arrows indicate the direction of the Galactic center and the direction perpendicular to the Galactic plane, respectively. The proper motion of NGC 6681 has not yet been reported.
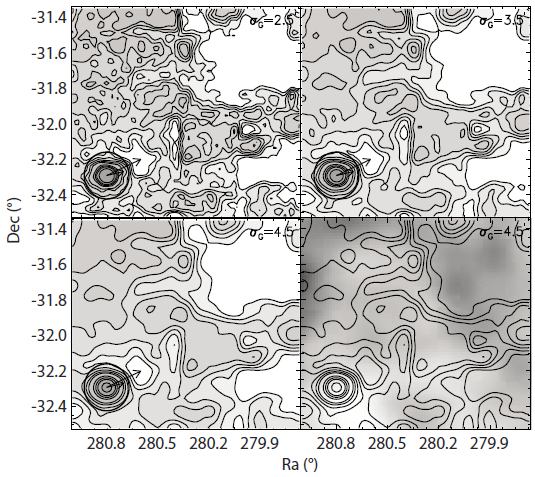
As appears in Fig. 7, the isodensity contours within the tidal radius are fairly smooth. Instead, those in the outer region in the cluster show slightly elongated elliptic structure to east-west direction, which seems to be aligned with the direction of the Galactic center and plane. No distinctive tidal extensions outside of the cluster’s tidal radius are detected in Fig. 7. Indeed, the cluster NGC 6681 is one of the post-core collapsed clusters (Harris 1996), which have the highest concentration in the radial surface density distribution. We note, however, the maps reveal overdensity extension feature with a somewhat low confidence toward south-west direction from the cluster at the contour levels of 0.5σ above the background, extending to about 5.5rt ≈ 43´. Since the proper motion of NGC 6681 has not yet been reported, we could not match the structure with the cluster’s orbit. The outer structures of the spatial stellar distribution seem to be biased by dust extinction fluctuations as it can be seen in the bottom-right panel of Fig. 7. Thus, it is hard to relate the shapes of the isodensity contours appeared in the outside of the cluster with the cluster’ kinematics and the dynamical effects of the Galaxy.
5. RADIAL DENSITY PROFILE
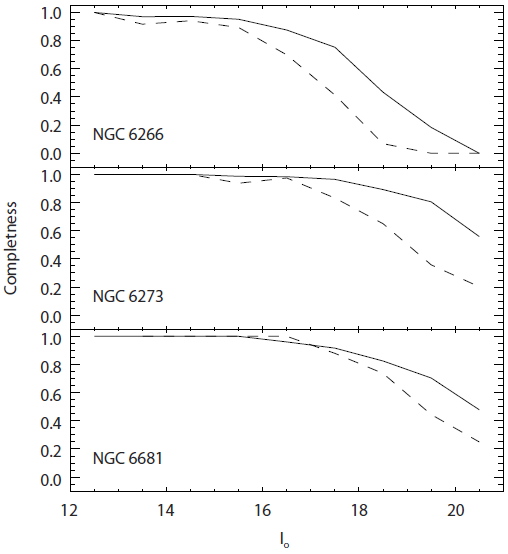
In this section, we construct the radial number density profiles for each cluster by counting number of stars selected by the filtering mask process. In order to evaluate the completeness of star counting to the photometric data, we performed the artificial star test on I filter images using the DAOPHOT/ADDSTAR routine. First, we added a few number of artificial stars on each I image not to enhance the crowding effect, typically 5 % of the detected stars in 0.5 mag bin. After that, we performed photometry to the new images with artificial stars, and repeated these procedures 10 times on each image. As a result, we computed the completeness factor f, which is defined as the ratio of the numbers of the recovered stars to the added stars.
Fig. 8 shows the completeness profiles within tidal radii for each cluster with respect to the measured magnitudes at inner region (1´.5 < r < 3´.5) and outer region (3´.5 < r < rt). In general, the completeness fraction values at inner region are lower than those at outer region due to the crowding effect. The profiles for the outer regions indicate that the recovery rates are 80 % at Io = 17.5, 19.5 and 19.0 for NGC 6266, NGC 6273 and NGC 6681. The radial density profile was then obtained from background-subtracted star counts by counting stars in concentric annuli. Using the obtained completeness fractions, we corrected the star count values in each annulus. The effective radius in each annulus was assigned by the equation where ri and ri+1 are inner and outer radii of an annulus. Background density level was determined by counting star in the field area, the same as in the filtering mask process. Here, we note that stars located beyond 2´ from the clusters’ center were counted to avoid severe crowding effect on the radial surface density profile.
To secure the surface density in the central region, used the polynomial fit surface photometry data of Trager et al. (1995) (T95). To combine the data of T95, the measured number density values were transformed into the surface density profile (SDP) values by using the Eq. (4). The constant in the equation was determined by matching our data profile with the surface density profile of T95 in the overlapping region (2´< r < 3´.5).
Here, Ni,i+1 indicates the background subtracted number of stars in an annulus between the radial ranges ri and ri+1, and Ai,i+1 means the area of an annulus and f means the completeness factor. The inner part of the combined radial density profile has been empirically fitted to the single-mass isotropic King (1966) models with dynamical parameters of Harris (1996). Instead, a power law has been fitted to the outer part of the profile. Indeed, previous studies have suggested that the radial surface density of stripped stars could be fitted by a power law of rγ nearby tidal radius of a globular cluster (e.g., Johnston et al. 1999). Here, we assign the slope of power low (γ) as a quantity of the overdensity around tidal radius of target clusters.
To trace the angular variation of the stellar number density distributions, we derived radial density profiles with 8 different sectional directions (R1~R8) from the clusters’ center, as shown in Fig. 9. Each concentric annulus has been divided into 8 sections with a position angle of 45°. It is apparent in Fig. 9 that the radial ranges of R1~R4 extend to 60´, while those of R5~R8 to just 15´. For the outer parts of the 8 different sectional radial density profiles, we also fitted the power law and obtained the slope to analyze the dependency of the overdensity feature on the direction from the cluster’s center.
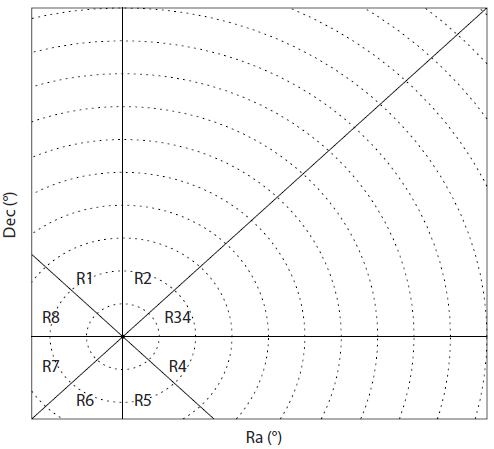
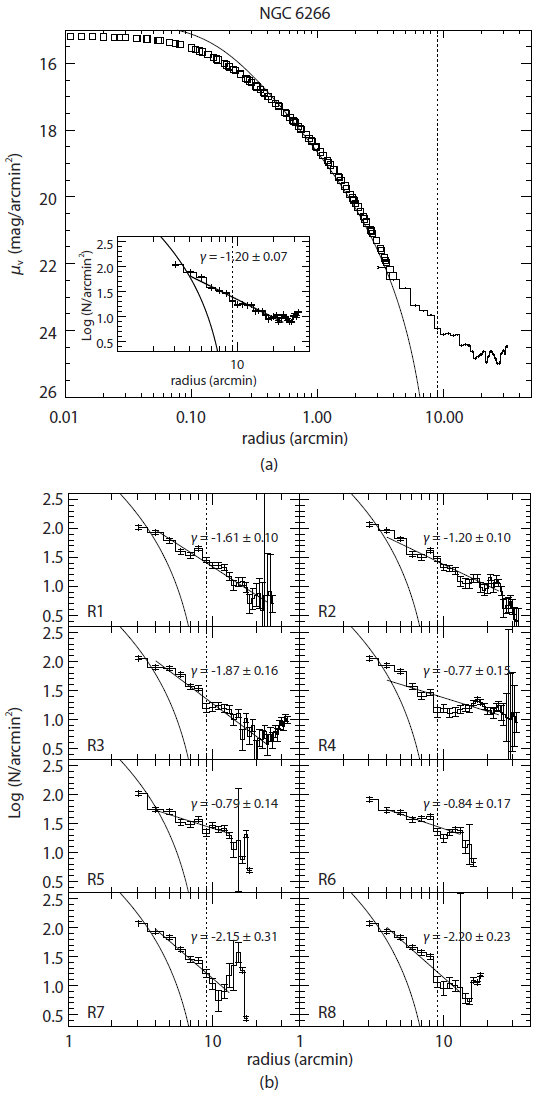
Fig. 10 shows the profile of radial density measured in concentric annulus (upper panel: Fig. 10(a)) and those of 8 different sectional directions (lower panel: Fig. 10(b)) for NGC 6266. In the upper panel, we plotted the radial density profile with a King model of Wo = 7.57, c = 1.70, and rc = 10˝.8 (Harris 1996). Note again that the radial density profile is composed of the surface photometry data of T95 and the measured number density data in this study. It is apparent that the radial density profile departs from the theoretical King model at 0.5rt, extending out to 4rt from the cluster’s center. To clarify the overdensity feature, we plotted the radial density profile at the outer region of the cluster in inset of the upper panel. Indeed, the overdensity feature in the radial density profile is represented by a power law with a slop of γ = -1.20 ± 0.07. It is likely to be similar with the value predicted from a theoretical simulation with a constant orbit-averaged mass-loss rate (Johnston et al. 1999). The sectional radial number density profiles with 8 different position angles for NGC 6266 were obtained and plotted in the lower panels of Fig. 10. A big error bar of a few points might due to the small number of stars in the sectional annulus with a gap of the mosaic chips. In general, all the sectional profiles show an overdensity feature at the outer region like the case of concentric annulus measurement. The profile to R4 direction shows the shallowest slop of γ = -0.77 ± 0.15. This is in a good agreement with the extended overdensity feature to the direction of the proper motion of NGC 6266 on the two dimensional surface density map. In addition, the slopes of power law at the sectional radial density profiles to R2, R5, and R6 directions are shallower than those of the other directions. These particular sections are likely to be associated with the direction perpendicular to the Galactic plane, for which the overdensity feature has been appeared as a twisted two lobed distribution of cluster member stars in the surface density contour map of Fig. 5.
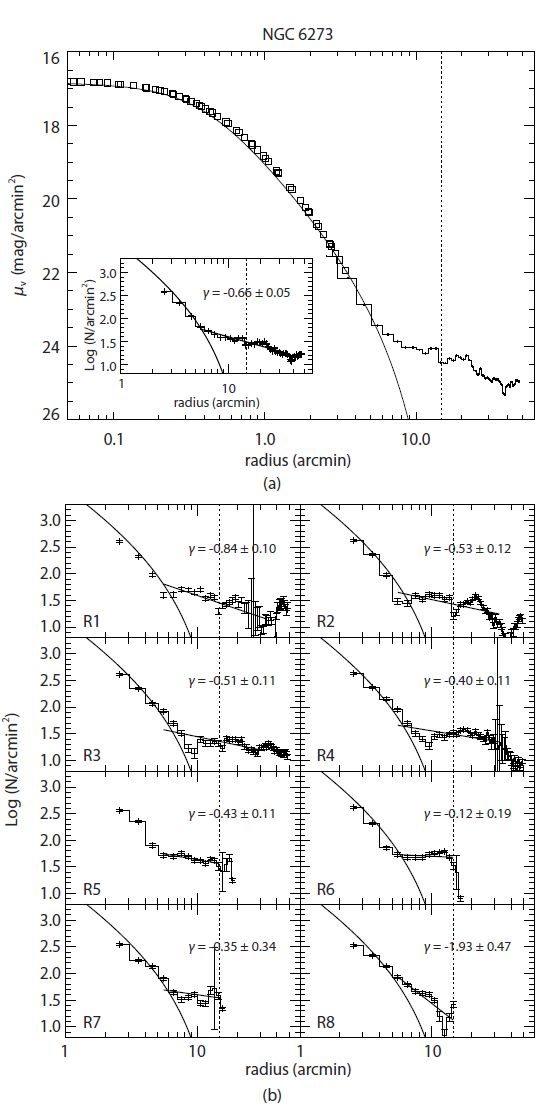
The upper panel of Fig. 11 shows the radial density profile of NGC 6273, combined with surface photometry data of T95 and the radial number density data. The inner part of the profile was fitted a theoretical King model with parameters of Wo = 7.01, c = 1.53, and rc = 25˝.8 (Harris 1996). Apparently in the plot, the radial density profile departs from the King model with a break at the radius 0.5rt, and the overdensity feature extends to approximately 3.5rt. As shown in the small box plot of the upper panel, the departure of the radial density profile from the King profile is characterized by a power law with a slope of γ = -0.66 ± 0.05, which is somewhat shallower than the value suggested by a theoretical simulation of Johnston et al. (1999). This may be caused by the effect of contaminations from background-foreground population of stars. Indeed, Combes et al. (1999) predicted that observed radial density profile is likely to represent shallower slopes due to the contamination. The lower panel of Fig. 11 shows radial number density profiles of NGC 6273 in 8 different sections. Similar to the case of NGC 6266, overdensity features beyond tidal radius of NGC 6273 are identified in all radial density profile with different sections. Note again that some unusual errors of number density in R1 and R4 possibly due to the very small number of stars influenced by gaps between the mosaic chips. The slopes of the power law in R6 and R7 seem to be the flattest among all 8 sectional regions. It can be noted that sectional areas of R6 and R7 correspond to the perpendicular direction of the Galactic plane. We also note that the slope of the power law in R4 tends to be slightly shallower than that of other sections. This seems to be in a good agreement with the stretched overdensity feature beyond tidal radius in the direction of the proper motion, as shown in the surface density map of Fig. 6. Also, the slope of power law in R8 is somewhat steeper than those in the other sections. This may be caused by dust extinction (e.g., van den Bergh 1984).
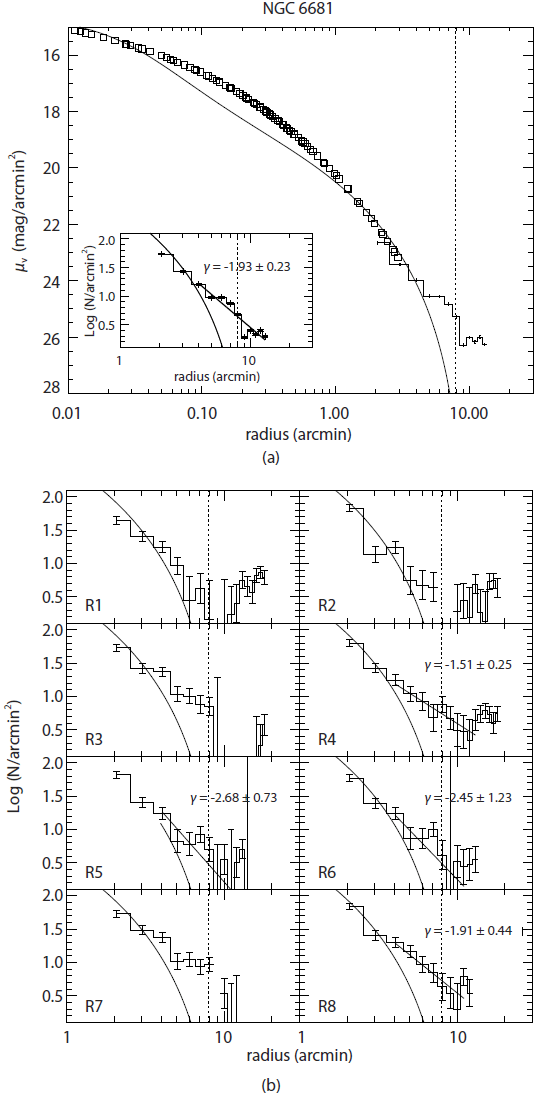
The combined radial surface density profile of NGC 6681 is presented in the upper panel of Fig. 12, which was fitted by a King model with Wo = 10.75, c = 2.50, and rc = 1˝.8 (Harris 1996). As appears in Fig. 12, the observed density profile departs from the King model with a break at 0.6rt. The overdensity feature extends out to 2.5rt, and the radial profile at the outer region was fitted by a power law with a slope of γ = -1.93 ± 0.23, as shown in the small box plot of the upper panel. Note that this value is slightly steeper than those for the other clusters in this study. The lower panel of Fig. 12 represents radial number density profiles of NGC 6681 in 8 different directions. In sections R1, R2, R3, and R7, no power laws could be applied to the radial profiles because the observed number densities around tidal radius of the cluster were below the background density level. The radial density profiles of the sections R4, R5, R6, and R8 were fitted by power laws at the outer region of the cluster. While slopes of power law are steeper than γ = -1 predicted by Johnston et al. (1999), power law slopes of the radial profiles in R4 and R8 are shallower than those in R5 and R6, which confirms extending overdensity feature appeared in the surface density map of Fig. 7. Nevertheless, it is hard to confirm the overdensity feature beyond tidal radius of NGC 6681 through the sectional radial density profiles because of low statistical number of member stars. However, we mention that highly concentrated clusters such as NGC 6681 have little overdensity features beyond tidal radius even if the clusters went through the dynamical effect by the Galactic bulge or disk (Kiss et al. 2007). Indeed, Lauchner et al. (2006), by comparing dynamical structures of globular clusters with different concentration indices, found that low concentrated globular clusters tend to be dispersed rather than high concentrated clusters.
6. DISCUSSION AND SUMMARY
NGC 6266 is one of the most massive metal-poor globular cluster in the Galactic bulge with a tidal radius of rt ∽ 8´.97. The surface density map around NGC 6266 presented a well developed extratidal overdensity extensions toward the direction of the proper motion extending out to about 6rt ∽ 60´.2 and the direction perpendicular to the Galactic plane. These overdensity features are likely to trace the cluster’s leading tail through its orbital path and the disk-shocking to the Galactic plane as discussed in Leon et al. (2000). Isodensity contours of NGC 6266 also show a somewhat distorted S-shape feature, which is in a good agreement with the previous studies that the stars evaporated from the cluster form a two-lobed distribution (Combes et al. 1999;Yim & Lee 2002). Analyses of radial density profiles confirmed the overdensity features in the spatial surface density map of stars around NGC 6266. Indeed, the concentric annular radial density profile departs from the theoretical King model at ~0.5rt, extending out to 4rt from the cluster’ center. Sectional radial density profiles reconfirmed the overdensity features in the direction of the proper motion of NGC 6266 and the direction perpendicular to the Galactic plane.
NGC 6273 is the flattest globular cluster (b/a=0.73) in the Milky Way (White & Shawl 1987) with a tidal radius of rt ∽ 14´.5. Isodensity contours of NGC 6273 revealed a distorted and asymmetric structure at the region outside 0.5rt of the cluster. An overdensity extension toward south-west direction from the cluster out to 3rt is likely to be aligned with the direction of the projected proper motion. In addition, a distorted overdensity extension out to 3rt to the north-west direction is aligned with the opposite direction of the Galactic center and plane from the cluster. The annular radial density profile of NGC 6273 represented a feature of departing from the King model with a break at the radius 0.5rt. This overdensity feature extends to approximately 3.5rt. The sectional radial density profiles confirmed the overdensity structures, which appeared in the surface density in a direction perpendicular to the Galactic plane and the direction of the cluster’s proper motion.
The cluster NGC 6681 is the highest concentrated post-core-collapsed cluster (Harris 1996) with a tidal radius of rt ∽ 7´.91. The isodensity contours within the tidal radius presented slightly elongated elliptic structure to east-west direction, which seems to be aligned with the direction of the Galactic center and plane. While no distinctive tidal extensions outside of the cluster’ tidal radius are detected, there appeared an overdensity extension feature with a somewhat low confidence level toward south-west direction from the cluster center, extending to about 5.5rt ∽ 43´. The annular radial density profile confirmed the overdensity feature from 0.6rt out to 2.5rt. Sectional radial density profiles reproduced the elongated structure of the overdensity feature which appeared in the surface density map. Owing to the low statistics, however, we could not confirm the overdensity feature beyond tidal radius through analyses of sectional radial density profiles.
In summary, we have undertaken a wide-field 71´×71´ CCD photometric observations to examine spatial distribution of stars around three metal-poor globular clusters located in the Galactic bulge (NGC 6266, NGC 6273, and NGC 6681). To minimize contamination of field stars from the photometric data of detected stars, we applied two stage filtering method, including the coarse filtering process (Law et al. 2003) in three-dimensional color-color-magnitude space of the ((Io, (V-I)o), (B-V)o) as a first stage and the color-magnitude mask filtering (Grillmair et al. 1995) in the (Io, (V-I)o) plane as a second stage. Analysis of surface density maps of the selected stars around the target clusters and their radial density profiles show common overdensity features beyond the tidal radii of the clusters. Directions of the overdensity features are associated with the clusters orbital paths, the direction of the Galactic center, and the direction perpendicular to the Galactic plane. These extratidal feature of spatial stellar distribution around globular clusters in the Galactic bulge are likely to be associated with the clusters kinematical properties and their dynamical interaction with the Galaxy.

