1. INTRODUCTION
Cataclysmic variables (CVs) are close binary system in which matters are transferred from the Roche lobe-filling secondary star of late-type to the white dwarf primary. When the secondary evolves to fill up the Roche lobe, matter moves to the primary through Lagrangian point (L1) located inside the system and matter-accretion occurs. In case the white dwarf shows significant strength of magnetic fields, it is called magnetic cataclysmic variable stars (MCVs) and MCVs are classified into intermediate polars (IPs or DQ Her) or polars (or AM Her) depending on the magnetic field strength
In the polars, the magnetic strength of white dwarf is so strong that it hiders the formation of accretion-disk and matter passing Lagrangian point accumulates directly on the surface of the white dwarf along the magnetic field lines. However, in the IPs, the magnetic field is not strong enough, thus, the matter through the Lagrangian point forms the accretion disk; from the inner periphery of the accretion disk, the matter falls onto the surface of the white dwarf along the magnetic field lines.
DO Dra was first categorized as a CV by Patterson et al. (1982) and observed as such at Palomar-Green Survey. At first, it was registered as PG 1140+ 719. Wenzel (1983) observed a phenomenon of explosion in PG 1140+ 719 region which enhanced the brightness by 5 times and recovered the original brightness in 4 days and classified it as a dwarf nova with long periods. Since then, the formal name assigned to PG 1140+ 719 became DO Dra (Samus et al. 2017). While Norton et al. (1999) classified DO Dra as an IP-type, DO Dra is believed to be a complex star which has magnetic fields and generates ejections.
Patterson et al. (1992) discovered the period of 550±3 sec with double peak structure, and Haswell et al. (1997) determined Pspin = 529.s31(2), Porb = 0.d16537398(17), the secondary mass, M2 = 0.375(14)M⊙, the primary star mass, Mwd = 0.83(10) M⊙, and the inclination, i = 45(4)°. Šimon (2000) discovered the ejection period of 870 day, and the magnitude decrease rate faster than that of non-magnetic structure. Andronov et al. (2008) identified the ejection periods of 311 day ~ 422 day using the observation data obtained in 2006 ejection and confirmed that the quasi-periodic oscillations (QPOs) also exist in DO Dra.
QPOs are phenomena of magnitude variation typically en-countered in the X-ray binary star system. Rossi X-Ray Timing Explorer (RXTE) discovered QPOs with the frequency from 0.001Hz to 450 Hz (Remillard et al. 2002). QPOs of a white dwarf accompany the non-periodical oscillation of magnitude with the interval of a few min to dozens of min. Recently, on the characteristics of QPOs in the X-Ray region and the optical region for polar-type magnetic white dwarfs, Bonnet-Bidaud et al. (2015) have suggested that QPOs with short periods of 1 sec ~ 3 sec are formed by shock waves. Also, Busschaert et al. (2015) have provided an explanation that QPOs show different behavior in the region of bremsstrahlung only compared to the region where both the cyclotron radiation and the bremsstrahlung radiation occur at the same time through numerical modeling to explain the observation data. QPOs were also observed at TT Ari (Tremko et al. 1996;Andronov et al. 1999;Smak 2014), and while QPOs in IP-type stars are believed to be generated by the bright bulb around the white dwarf with magnetic fields, detailed numerical calculation results have not been reported yet. These QPOs were discovered at DO Dra and Andronov et al. (2008) also discovered disappearance of the QPOs at DO Dra and proposed to name this phenomenon as transient-periodic oscillations (TPOs).
The optical monitoring of MCVs has been performed in Korea since 1995 using domestic telescopes and as a part of “Inter-Longitude Astronomy" campaign (Andronov et al. 2010), international observation monitoring was conducted and the analysis results have been reported (Andronov et al. 2008, 2011, 2015;Kim et al. 2004, 2005a, 2005b, 2009;Yun et al. 2011)
While DO Dra, one of the target stars of ILA campaign, shows variable amplitude and ejection behavior with indeterminable periods, various periods and QPO phenomena obtained from photometric observation data of DO Dra have been analyzed and the results are presented in this study.
2. OBSERVATION AND DATA ANALYSIS
Photometric observation data of DO Dra had been obtained from Mt. Lemmon optical astronomy observatory (LOAO) and Chungbuk national university observatory (CBNUO) for about 10 years from 2005 till 2014. The LOAO telescope located at Mt. Lemmon in Arizona is 1.0 m in diameter and the effective focal ratio is f/7.5. It is mounted on a fork equatorial mount and adopts CCD with 0.64 arcsec/pixel, 2k × 2k resolution, and its field of view (FOV) is 22'.2 × 22'.2. The telescope at CBUNO is 0.6 m in diameter and its optical system is an R-C type with effective focal ratio of f/2.92. in 2012, a CCD with wide FOV of 72' × 72' and 4k × 4k (4096×4096) pixel resolution was been installed. In Fig. 1, a finding map from LOAO including 9 comparison stars is shown and in Table 1, all the relevant data for comparison stars considered in this study are listed. The journal of observations are listed in Appendix I and II.

|

|
The IRAF/DAOPHOT package (Massey & Davis 1992) is used to determine instrumental magnitudes of the variable star as well as comparison stars. Using MCV computer program by Andronov & Baklanov (2004) which uses the method of multiple comparison stars (Kim et al. 2004), the final magnitudes are determined. The method of multiple comparison stars allows to estimate an independent brightness of comparison stars in the vicinity of the variable star. The primary comparison star is selected as C1 and its magnitude is 15.m082 for B filter, 14.m28 for V filter (Henden & Honeycutt 1995) and 13.m84 for R filter (Pelle 2005).
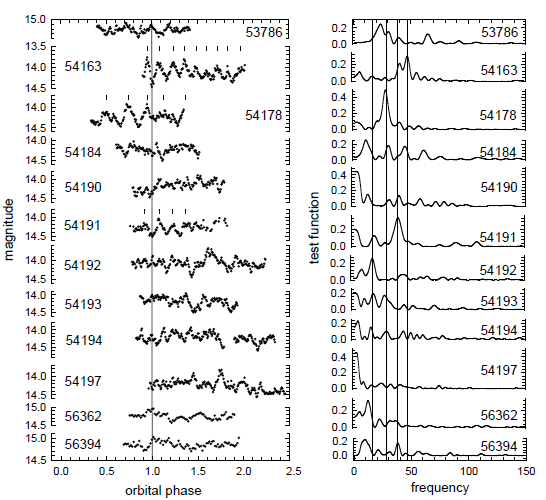
In order to find the periods embedded in this system, a periodogram S(f) is calculated. The test function S(f) is the square of the correlation coefficient between the observations and the values calculated using sine fit with a trial frequency (see Andronov 1994, 2003 for details). Fig. 2 shows the orbital light curves (left) and periodogram (right) for observation days showing QPO in our data.

3. QUASI PERIODIC OSCILLATION
For QPOs observed in polar-type MCVs, observation and numerical calculation results have been reported (Bonnet-Bidaud et al. 2015;Busschaert et al. 2015), however, there is no report on qualitative and quantitative model calculation results for IP-type MCVs, yet. Thus, it is of significance to sort out the characteristics observed in these stars.
Mateo et al. (1991) have discovered the rotation period of 14.2 min (852 sec) which is longer than the other rotation periods from the one-day observation data with B filter. Also, Andronov et al. (2008) have discovered the period of 30.4 min (1,824 sec) which is approximately twice the period determined by Mateo et al. In this study, in order to analyze the periods of various QPOs, we have selected days showing significant variations in light intensity on the light curves. For these selected days, we have generated light curves and periodograms and those are presented in Fig. 2. In the light curves on the left of Fig. 2, we can see magnitude oscillations with periods different from the rotation period or the revolution period. On HJD 2454178, the significant variations of magnitude were observed with the maximum amplitude of 0.4. Subsequently, QPOs have been observed for HJD 2454191 to HJD 2454194. On HJD 2454197, QPOs were not observed at first but started to appear from the middle of data and on HJD 2456000, we can see magnitude variations became relatively small. In this figure, the eclipse timing of QPOs observed on HJD 2454163, HJD 2454178, and HJD 2454191 are indicated with the short vertical bar. The first vertical solid line on the right plot of Fig.2 indicates the approximate frequency of f ≈17.5 cycles/ day; the second line and the third line represent f ≈ 28 cycles/ day, f ≈ 44 cycles/day, respectively; the fourth line indicates f ≈ 47.5 cycles/day discovered by Andronov et al. (2008). Around the solid lines drawn, several similar periods were discovered. For the consecutive days of HJD 2453191 through HJD 2453194, the light curves show similar periodic behavior.
Table 2 shows the measured QPO periods from the periodogram analysis of light curves as suggested by Andronov (2003) for the individual days where QPOs were observed. According to the period information summarized in this table, the period of QPOs ranges PQPOs = 30m ~ 80m, we can conclude that QPOs do not occur always and the periods of QPOs are changing.
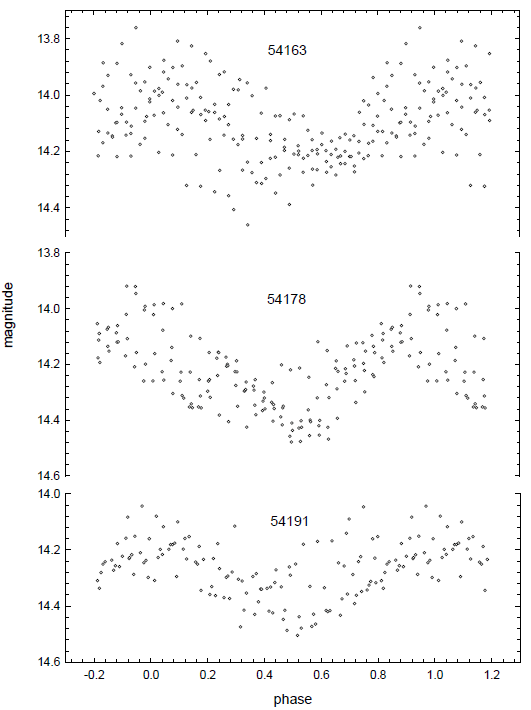
The individual days where QPOs are observed clearly can be found by calculating the periodogram S(f). In the left plot of Fig. 2, the calculated times of maximum are indicated with the short vertical bar for 3 days of HJD 2454163, HJD 2454178, and HJD 2454191 which show clear periodic behavior compared to others. Using the times of maximum, as the epoch time, T0, and the periods of the QPO period, PQPOs for the individual QPOs are estimated as shown below.
T0 = HJD 2454163.9273(15)
PQPOs= 0.d0211168(15) for HJD 2454163
T0 = HJD 2454178.8776(15)
PQPOs = 0.d0357537(1) for HJD 2454178
T0 = HJD 2454191.8327(9)
PQPOs = 0.d0251576(7) for HJD 2453191
Using these light elements of QPOs determined separately, folded light curves are presented in Fig. 3.

4. DISCUSSION
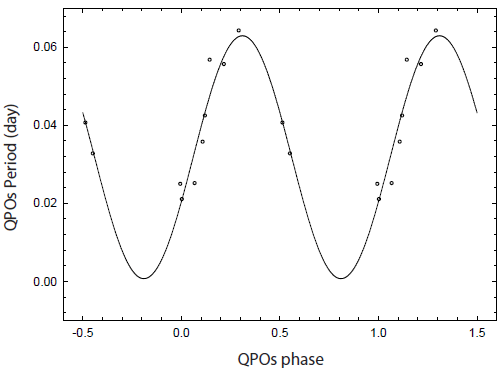
Although QPOs had been identified clearly during the ten year long observation of DO Dra, it was difficult to get any general statistical conclusions on the periodicity. From the fact that the interval of the observation showing QPO, it is obvious that the period ranges between 13 day and 15 day. We have checked whether there is a distinct QPO period in this range. A least square analysis has been carried out for the periodicity as shown in Table 2, starting from a period of 13 day up to 15 day with the increment of 0.01 day. It is interesting that the QPO behavior seems to repeat itself in 13.52 day, although this result should be confirmed in the future analysis to be more accurate. In this process, HJD 2456362 and HJD 2456394 were excluded because of the accumulated error propagation. The QPO periods presented in Table 2 are superposed with sine curve with the period of 13.52 day and presented in Fig. 4. Andronov et al. (2008) pointed out that various QPOs and transient periodic oscillations (TPOs) exist in the observational data, but they could not found some periodicity of these QPOs. At this time, the observational data are not sufficient to confirm this periodicity. Therefore, further monitoring observation is necessary to clearly identify this period variation.

There have been several attempts to explain the QPO models identified in the optical and X-ray light curves observed in polar-type stars with strong magnetic fields (Bonnet-Bidaud et al. 2015;Busschaert et al. 2015), however, calculation models of IP-type stars with accretion disk are so complicated that the explanations were not ever made yet. But a lot of QPOs have been observed in these stars, and it is believed that the periods depend on the various elements such as accretion disk, the change in accretion rate of mass which passes the magnetic sphere of white dwarfs, etc., and that the amplitude of QPOs will display variations.
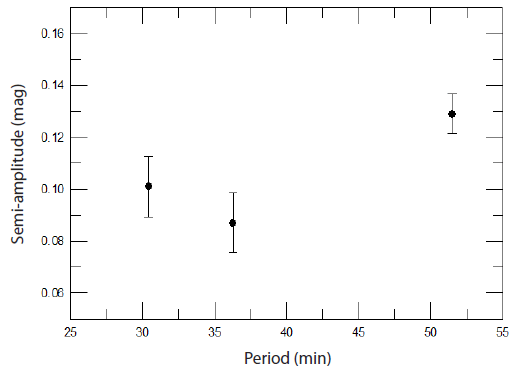
In order to see this dependence, the semi-amplitude and the QPO period in Table 2 are plotted for the days showing the obvious QPO. It can be concluded from Fig. 5 that the semi-amplitude increases as the QPO period becomes longer, even though this is hard to be confirmed due to lack of data. However, this trend can be used as initial data for magnetic field change or accretion rate change in the future model calculation to enable observational verification of theory. In order to achieve this purpose, continuous monitoring and analysis related to the variation of QPO periods are essential.

Assuming that blobs located between white dwarfs and accretion disks constitute one of the various causes of QPO, the location of blobs can be estimated from the Kepler’s law. Blobs are believed to change periodically between the maximum distance of Rblobs = Rwd • 9.272/3 = 4.41Rwd and the minimum distance of 2.28Rwd (Andronov et al. 2008) or of 1.39Rwd (Mateo et al. 1991).
However, it is worth mentioning that QPOs do not occur always and occasionally, they show transient behavior of which mechanism is not clear to be explained yet.
Based on the results of light elements determined for QPOs observed on HJD 2454163, HJD 2454178, and HJD 2454191, it can be concluded that QPOs occur with the period of 13.52 day. However, it is not possible to explain this behavior of QPOs with unsteady amplitudes and periods at this time. Further monitoring observations will enable us to analyze more accurately, and understand the physical condition of radiative region of the magnetic cataclysmic variables.


