1 INTRODUCTION
Gamma-ray bursts (GRBs) are extremely energetic phenomena in the universe and their peak energy in their spectra ranges from ~10 to ~400 keV (e.g., Barraud et al. 2003; Piran 2004; Zhang 2007). They are considered to be tracers of star formation history in the early universe because GRBs, especially long bursts, appear to be associated with the death of massive stars (Woosley 1993; Paczyński 1998; MacFadyen & Woosley 1999). Since they were first detected in the late 1960s (Klebesadel et al. 1973), we have obtained extensive information on observed GRBs with follow-up observations of afterglow (e.g., Costa et al. 1997; Frail et al. 1997; Metzger et al. 1997; van Paradijs et al. 1997). In part, this is because not only are they brief, but it is also impractical to determine their distance with observations in gamma-ray ranges. Nonetheless, bearing in mind that the prompt emission contains immediate details on the central engine, an analysis of light curves and spectra of the observed GRBs in gammaray ranges is frequently demanded (e.g., Chang 2012).
With the successful launching of space missions (such as Swift and Fermi), several empirical relationships between various properties of the light curves of prompt gammaray emissions and observed GRB energetics have been established as standard candles at a cosmological distance scale. Familiar relationships include that of the variability and the isotropic peak luminosity (Fenimore & Ramirez-Ruiz 2000; Reichart et al. 2001), of the number of peaks of GRB light curves and the isotropic luminosity (Schaefer 2003), and of the spectral lag and the isotropic peak luminosity (Norris et al. 2000; Norris 2002; Gehrels et al. 2006; Zhang et al. 2006; Schaefer 2007; Hakkila et al. 2008; Zhang et al. 2008; Ukwatta et al. 2010, 2012; Qi & Lu 2012). In addition, emission properties of GRBs are studied in terms of the peak energy of the prompt spectrum and prompt light curves (Fenimore et al. 1996; Kobayashi et al. 1997; Beloborodov et al. 1998; Fenimore 1999; Chang & Yi 2000; Lamb et al. 2004; Liang & Dai 2004; Liang et al. 2004). Among all of these, the most notable relationships involve the correlation between peak energy and isotropic energy (Amati et al. 2002), jet-corrected energy (Ghirlanda et al. 2004; Liang & Zhang 2005; Ghirlanda et al. 2006, 2012), and isotropic peak luminosity (Schaefer 2003; Wei & Gao 2003; Yonetoku et al. 2004). These issues obviously depend on the degree of beaming in GRB emission (Kumar 1999; Kumar & Piran 2000). For instance, the amount of collimation can adjust the inferred energy or luminosity by several orders of magnitude from a presumed isotropic energy.
It is widely accepted that the fireball model explains both the prompt emission and afterglow, in which highly relativistic internal and/or external shocks with a Lorentz factor ≥100 collide with each other and are subsequently decelerated by the ambient circumburst medium (Mészáros & Rees 1993; Rees & Mészáros 1994; Kobayashi et al. 1997; Daigne & Mochkovitch 1998, 2000). The shock should be basically confined to a collimated narrow cone according to the special relativistic effects due to large Lorentz factors, resulting in afterglow flux that has been observed to steepen in many cases (Chevalier & Li 1999; Rhoads 1999; Sari et al. 1999; Frail et al. 2001; Panaitescu & Kumar 2001, 2002; Burrows & Racusin 2007). The peak energy of the observed GRBs is an important quantity in the fireball model in that the peak energy in the source frame depends on the fireball bulk Lorentz factor. To know the total energy budget of GRBs is also key to understanding the progenitors and central engines of these enormous explosions. In this sense, those correlations mentioned above can shed light on the radiation processes for the prompt GRB emission (Nava et al. 2006).
In this study, we revisit the analysis of Chang (2012), in which the lag-luminosity relation in the GRB source frame is examined using the collimation-corrected peak luminosity rather than the isotropic peak luminosity. Chang (2012) noted that if a lag-luminosity relationship in the source frame indeed exists, the collimation-correction luminosity should be considered to obtain a correct relationship, otherwise the luminosity of the individual GRB is likely to be overestimated by several orders of magnitude because of filling factors of the GRB jet. Most previous investigations used spectral lags extracted in the observer-frame and the isotropic peak luminosity (e.g., Ukwatta et al. 2010, 2012) until Chang (2012) computed and considered collimation-corrected luminosity based on bulk Lorentz factors archived in the published literature. It is fair to point out, however, that a larger dataset is required to increase the statistical significance of correlations found in Chang (2012). Having more GRBs at hand presently, it will be beneficial to update reported correlations and verify whether the conclusions drawn from an earlier GRB sample still hold. This is the main goal of this paper. In doing so, we investigate the lag-luminosity relationship in great detail by looking at spectral lags resulting from all possible combinations of channels, rather than taking into account only the spectral lag between channels 2 and 3 as used in earlier research, Swift/Burst Alert Telescope (BAT) has four energy channels (channel 1: 15-25 keV, channel 2: 25-50 keV, channel 3: 50-100 keV, channel 4: 100-200 keV).
Over the course of the analysis, we compiled the opening angles of 205 long GRBs, demonstrating that its distribution is bimodal. As the physical property of GRBs critically depends on whether the geometry of the gamma-ray emitting ejecta is spherical or jet-like (Harrison et al. 1999; Kulkarni et al. 1999; Meszaros & Rees 1999; Sari et al. 1999), the jet opening angle of GRBs is an important quantity to measure. Unfortunately, however, the jet opening angle is difficult to reliably estimate because it requires observations of an achromatic jet break time in the power-law decay of the afterglow emission (Harrison et al. 1999; Sari et al. 1999; O’Brien et al. 2006; Ryan et al. 2015); as such, these statistical attributes are indeterminate. We further investigate the relationship between peak luminosity and peak energy because peak energy is somehow related to the jet angle via the bulk Lorentz factor.
This paper is organized as follows. We begin with brief descriptions of the distribution of opening angles of long GRB jets in Section 2. We present results of analysis and discuss the correlation between spectral lag and peak luminosity as well as the correlation between peak energy and peak luminosity in Sections 3 and 4, respectively. Finally, we summarize and conclude by discussing the implications of our findings in Section 5.
2 DISTRIBUTION OF OPENING ANGLES
We statistically examine here the opening angles of long GRBs, which are archived together with short GRBs in Ryan et al. (2015). There, jet angles of the long and short GRBs detected by the Swift satellite are derived from light curves of afterglows, assuming a uniform circumburst medium. Because large Lorentz factors simply imply strong beaming of the radiation, the jet opening angle Δθopening can be basically defined by Δθopening=1/Γ0 , where the bulk Lorentz factor Γ0 is calculated using the observed light curves of the afterglow (e.g., Sari et al. 1999). Two assumptions can be made in estimating Γ0: a homogeneous circumburst medium with a typical density value of n0~1 cm-3 or a wind density profile of n(r)∝r-2 (e.g., Mirabal et al. 2003). It is interesting to note here that though a wind profile is expected based on the premise that GRBs are associated with the death of a massive star, most of GRBs are consistent with a constant density environment, and only a small portion exhibits a wind profile.
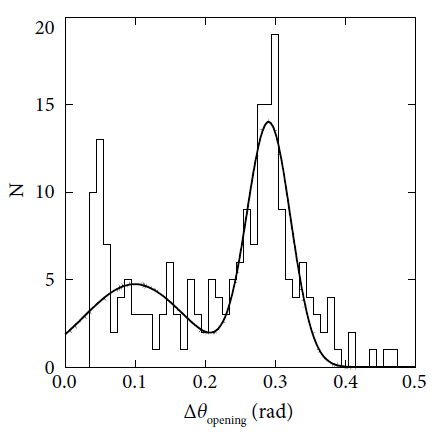
In Fig. 1, we show that the distribution of opening angles of the long GRBs is bimodal, which is well represented by a double Gaussian function having maxima at ~0.1 and ~0.3 radians rather than a single Gaussian function (cf., Gao & Dai 2010). The number of GRBs is counted in bins 0.01 radians wide resulting in a histogram to which a double Gaussian function is fitted by adjusting six parameters simultaneously. The thick curve represents the best fit of the double Gaussian function. It should be noted, in comparison, that the distribution using the pre- Swift measurements in particular is often suggested to be a Poisson distribution or a fairly broad Gaussian distribution appearing similar to the uniform distribution (e.g., Frail et al. 2001; Bloom et al. 2003; Racusin et al. 2009). To compare the goodness of the single and double Gaussian fits we compared reduced chi-square values and obtained 0.31 and 0.17, respectively. To make sure we have repeated fitting processes with bin sizes of 0.05 and 0.005 and came to the same conclusions. We suspect that the bimodal distribution of jet opening angles can be explained either by the fact that GRBs in origin are due to two populations with broad and narrow jets or because the energy injection from the source to outflow is sporadic rather than continuous, as has been repeatedly suggested (Panaitescu et al. 2006; Schady et al. 2007; Curran et al. 2008).

3 SPECTRAL LAG AND LUMINOSITY
Here, we investigate the relationship between the spectral lag and the peak luminosity. For spectral lags in the observer frame, we have used data from Ukwatta et al. (2010) and Kawakubo et al. (2015). Because Swift/BAT has four energy channels (channel 1: 15-25 keV, channel 2: 25-50 keV, channel 3: 50-100 keV, channel 4: 100-200 keV), six observed spectral lags can be defined. We denote the spectral lag between channel i and channel j as τij. We choose GRBs only whose spectral lag is positive, i.e., only those in whose light curves the hard photons arrive earlier than the soft ones. While the spectral lag in the observer frame is measured with observed light curves of two arbitrary energy channels, the two energy channels in the observer frame correspond to a different pair of energy channels in the GRB source frame as a result of the cosmological expansion. Hence, effects of the expanding universe should be taken into account, i.e., time dilation and redshift in energy, to study physical properties in the source frame. Two corresponding corrections are required: 1) to correct for the time dilation effect by multiplying the spectral lag value in the observer frame by (1+z)-1, and 2) to take into account the fact that the observed energy channels correspond to different energy channels in the source frame. Though the second correction is not straightforward, an approximate correction can be made based on the assumption that the pulse width is proportional to the energy (Fenimore et al. 1995; Gehrels et al. 2006; Zhang et al. 2009). Alternatively, a simpler second correction can be made by defining the two energy channels in the source frame to project those two channels into the observer frame and extract spectral lags between them using the relationship Eobserver=Esource/(1+z), as in Ukwatta et al. (2010, 2012). For the isotropic peak luminosity Liso, data of GRBs are adopted from Ukwatta et al. (2010, 2012) and Kawakubo et al. (2015). We have subsequently selected GRBs whose redshifts and jet opening angles are known to further analyze the relationship of collimation-corrected peak luminosity Lcoll in the source frame. We have derived the collimation-corrected peak luminosity using the opening angles shown in Fig. 1. We have basically followed the method used in Chang (2012) for the current analysis.
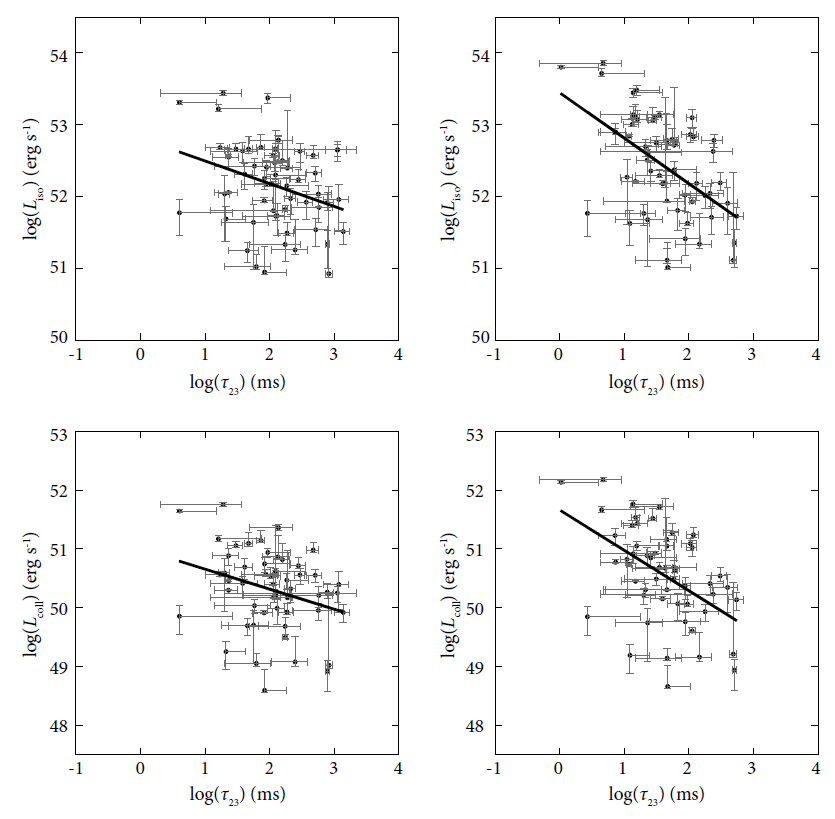
In Fig. 2, as an example, we show the peak luminosity, Liso or Lcoll, versus the spectral lag between channel 2 and channel 3 τ23 in a log-log plot, obtained from 58 or 54 long GRBs detected by the Swift satellite. In the top and bottom panels, results of the isotropic peak luminosity and the collimation- corrected peak luminosity are shown, respectively. In the left and right panels, using GRBs whose redshifts are known, results of the observer frame and the source frame are shown, respectively. Thick straight lines represent the best fit of the data obtained by the linear least-squares method. Parameters of the best fit are given in Table 1. We also provide the linear Pearson’s correlation coefficients of the relationship with null probabilities in Tables 2 and 3 for results for the spectral lag parameters τij defined by other combinations of channels. As reported in Chang (2012), there is an anti-correlation between the peak luminosity and the spectral lag. In agreement with the previous conclusion, the correlation coefficient improves significantly in the source frame. Because GRBs are believed to be beamed, it is natural to expect that the collimation-corrected peak luminosity may correlate with the spectral lag. According to what we found in Table 3, the collimation-corrected luminosity correlates in a similar way with the spectral lag, except that the correlations are somewhat looser. As for the correlations resulting from six spectral lags in combination with different channels, spectral lags involving channels 3 and 4 end up with high correlation coefficients, i.e., τ34.

4 PEAK ENERGY AND LUMINOSITY
Because the jet opening angle is inversely proportional to the bulk Lorentz factor, it is then reasonable to suspect that the peak energy and the peak luminosity should be correlated even though the physical mechanisms leading to these correlations are still unclear (Kumar & Piran 2000; Eichler & Levinson 2004; Zhang & Choi 2008; Nava et al. 2008, 2010; Ghirlanda et al. 2011; Lazzati et al. 2011; Nava et al. 2012; Zhang et al. 2012). In fact, using a dataset of 11 Burst And Transient Source Experiment (BATSE) long GRBs in the observer frame, Yonetoku et al. (2004) first derived such a relationship, i.e., that between peak energy and isotropic peak luminosity. Some recent studies qualitatively draw a conclusion that short and long bursts should follow the same the peak energy and the peak luminosity relationship (Ghirlanda et al. 2009; Zhang et al. 2009, 2012; Qin & Chen 2013). This conclusion is different from the cases of Amati and Ghirlanda relationship, which are derived from long bursts but are not followed by the majority of short bursts (Amati 2006; Ghirlanda et al. 2009). Motivated by the current situation, we now investigate the peak energy and the collimation-corrected peak luminosity relationship of GRBs in the source frame.
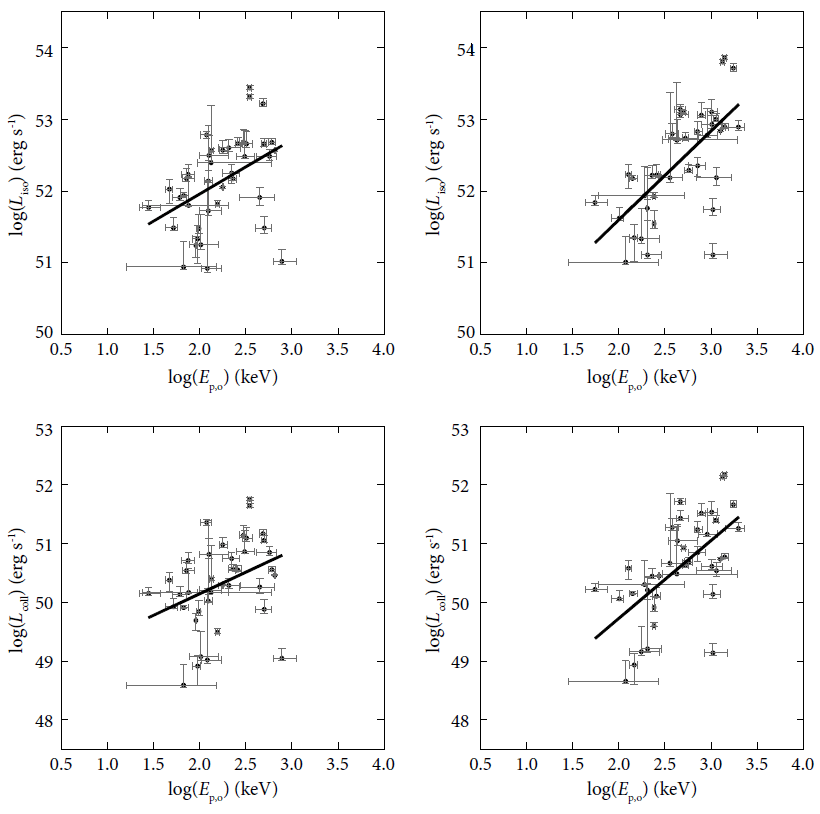
In Fig. 3, we show the peak luminosity, Liso or Lcoll, versus the peak energy in log-log plot, obtained from 39 long GRBs detected by the Swift satellite, as shown in Fig. 2. In the top and bottom panels, results of the isotropic peak luminosity and the collimation-corrected peak luminosity are shown, respectively. In the left and right panels, using long GRBs whose redshifts are known, results of the observer frame and the source frame are shown, respectively. The observer-frame peak energy Ep,o and the source-frame peak energy Ep,s are related by Ep,s=Ep,o(1+z), where Ep,o is derived as Ep,o=(2+α)E0 from the spectrum, of which α and E0 are the lower energy index and break energy fitted with the Band function, respectively (Band et al. 1993). Thick straight lines represent the best fit of the data obtained by the linear leastsquares method. Parameters of the best fit are given in Table 1. In Table 4, we provide the linear Pearson’s correlation coefficients of the relationship with null probabilities. In agreement with earlier claims (Yonetoku et al. 2004; Nava et al. 2008; Ghirlanda et al. 2009; Nava et al. 2012; Zhang et al. 2012), we have found that they are positively correlated. The collimation-corrected luminosity correlates with the peak energy more loosely. We also note the correlations are significantly improved when the parameters in the source frame are considered.

5 SUMMARY AND CONCLUSIONS
As an extension of the Ukwatta et al. (2010, 2012) relationship in which the isotropic peak luminosity and the spectral lag is anti-correlated in the source frame, Chang (2012) reported the relationship between the collimationcorrected peak luminosity and the spectral lag in the source frame using 12 long GRBs, detected by the Swift/BAT, whose redshifts and jet opening angles are archived in the published literature. Such a correlation would contribute to properly understanding the underlying process of the gamma-ray radiation of GRBs. In the present analysis, we have revisited the correlations found in Chang (2012) using a larger dataset to increase the statistical significance. We have investigated the lag-luminosity relationship in great detail by looking at spectral lags resulting from all possible combinations of channels rather than taking into account only the spectral lag between channels 2 and 3. We have also compiled all the opening angle data published in the literature.
Our main findings and implications are as follows:
-
(1) The distribution of opening angles of 205 long GRBs is bimodal and well represented by a double Gaussian function having maxima at ~0.1 and ~0.3 radians. We suspect that the bimodal distribution of jet opening angles can be explained either by the fact that GRBs in origin are due to two populations with broad and narrow jets or because energy injection from the source to outflow is sporadic rather than continuous.
-
(2) The anti-correlation between the peak luminosity, Liso or Lcoll, and spectral lag is confirmed both in the observer frame and in the source frame. In agreement with the previous conclusion, the correlation coefficient improves significantly in the source frame. The collimation-corrected luminosity correlates with the spectral lag less tightly. As for the correlations resulting from six spectral lags in combination with different channels, it is found that spectral lags involving channel 3 and 4 end up with high correlation coefficients, i.e., τ34.
-
(3) Peak luminosity, Liso or Lcoll, is positively correlated with peak energy. We also note that the correlations are significantly improved in the source frame. Because the jet opening angle is inversely proportional to the bulk Lorentz factor, it is natural to expect a positive correlation given the negative correlation between the jet opening angle and peak energy.